Clayton, MO
Demographics And Statistics
Living In Clayton, Missouri Summary
Life in Clayton research summary. HomeSnacks has been using Saturday Night Science to research the quality of life in Clayton over the past nine years using Census, FBI, Zillow, and other primary data sources. Based on the most recently available data, we found the following about life in Clayton:
The population in Clayton is 17,282.
The median home value in Clayton is $836,013.
The median income in Clayton is $128,898.
The cost of living in Clayton is 147 which is 1.5x higher than the national average.
The median rent in Clayton is $1,648.
The unemployment rate in Clayton is 2.5%.
The poverty rate in Clayton is 8.1%.
The average high in Clayton is 65.9° and the average low is 47.2°.
Clayton SnackAbility
Overall SnackAbility
Clayton, MO Crime Report
Crime in Clayton summary. We use data from the FBI to determine the crime rates in Clayton. Key points include:
There were 157 total crimes in Clayton in the last reporting year.
The overall crime rate per 100,000 people in Clayton is 897.1 / 100k people.
The violent crime rate per 100,000 people in Clayton is 102.9 / 100k people.
The property crime rate per 100,000 people in Clayton is 794.2 / 100k people.
Overall, crime in Clayton is -57.67% below the national average.
Total Crimes
Below National Average
Crime In Clayton Comparison Table
| Statistic | Count Raw |
Clayton / 100k People |
Missouri / 100k People |
National / 100k People |
|---|---|---|---|---|
| Total Crimes Per 100K | 157 | 897.1 | 2,403.3 | 2,119.2 |
| Violent Crime | 18 | 102.9 | 462.0 | 359.0 |
| Murder | 0 | 0.0 | 7.8 | 5.0 |
| Robbery | 4 | 22.9 | 51.5 | 61.0 |
| Aggravated Assault | 12 | 68.6 | 357.5 | 256.0 |
| Property Crime | 139 | 794.2 | 1,941.2 | 1,760.0 |
| Burglary | 18 | 102.9 | 236.3 | 229.0 |
| Larceny | 95 | 542.8 | 1,306.5 | 1,272.0 |
| Car Theft | 26 | 148.6 | 398.4 | 259.0 |
Clayton, MO Cost Of Living
Cost of living in Clayton summary. We use data on the cost of living to determine how expensive it is to live in Clayton. Real estate prices drive most of the variance in cost of living around Missouri. Key points include:
The cost of living in Clayton is 147 with 100 being average.
The cost of living in Clayton is 1.5x higher than the national average.
The median home value in Clayton is $836,013.
The median income in Clayton is $128,898.
Clayton's Overall Cost Of Living
Higher Than The National Average
Cost Of Living In Clayton Comparison Table
| Living Expense | Clayton | Missouri | National Average | |
|---|---|---|---|---|
| Overall | 147 | 88 | 100 | |
| Services | 94 | 93 | 100 | |
| Groceries | 98 | 96 | 100 | |
| Health | 88 | 91 | 100 | |
| Housing | 270 | 78 | 100 | |
| Transportation | 95 | 90 | 100 | |
| Utilities | 101 | 99 | 100 | |
Clayton, MO Weather
The average high in Clayton is 65.9° and the average low is 47.2°.
There are 70.0 days of precipitation each year.
Expect an average of 42.9 inches of precipitation each year with 16.1 inches of snow.
| Stat | Clayton |
|---|---|
| Average Annual High | 65.9 |
| Average Annual Low | 47.2 |
| Annual Precipitation Days | 70.0 |
| Average Annual Precipitation | 42.9 |
| Average Annual Snowfall | 16.1 |
Average High
Days of Rain
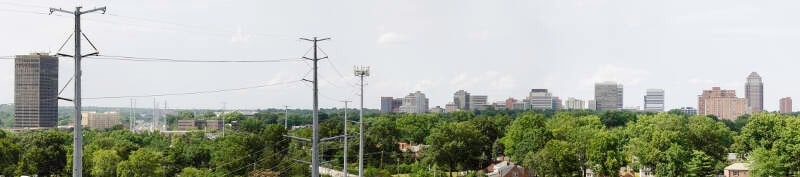
Clayton, MO Photos

Rankings for Clayton in Missouri


Locations Around Clayton
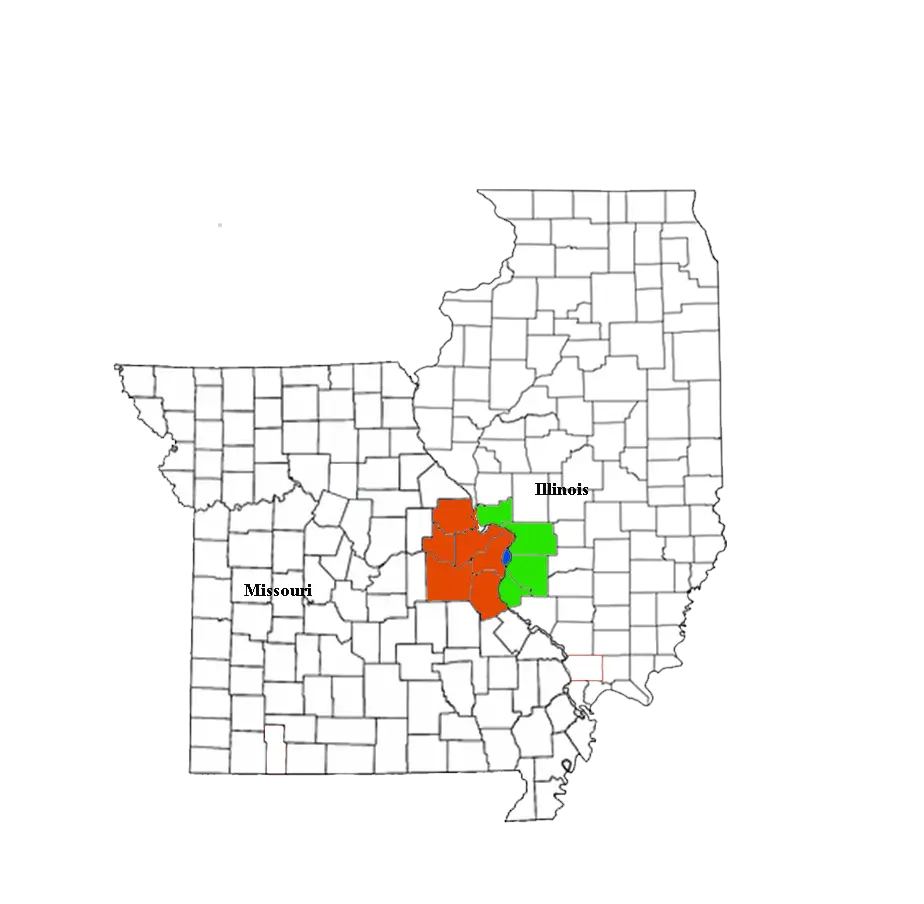
Map Of Clayton, MO
Best Places Around Clayton
Swansea, IL
Population 14,603
Columbia, IL
Population 11,063
Fairview Heights, IL
Population 16,255
Pontoon Beach, IL
Population 6,131
Collinsville, IL
Population 24,126
Wildwood, MO
Population 35,168
Ballwin, MO
Population 30,835
Chesterfield, MO
Population 49,591
Town and Country, MO
Population 11,605
Kirkwood, MO
Population 29,302
Clayton Demographics And Statistics
Population over time in Clayton
The current population in Clayton is 17,282. The population has increased 12.7% from 2010.
| Year | Population | % Change |
|---|---|---|
| 2023 | 17,282 | 0.4% |
| 2022 | 17,212 | 1.8% |
| 2021 | 16,905 | 0.8% |
| 2020 | 16,763 | 1.1% |
| 2019 | 16,588 | 0.9% |
| 2018 | 16,448 | 1.4% |
| 2017 | 16,214 | 1.1% |
| 2016 | 16,034 | 0.8% |
| 2015 | 15,900 | -0.1% |
| 2014 | 15,912 | 0.3% |
| 2013 | 15,862 | 0.8% |
| 2012 | 15,740 | 1.1% |
| 2011 | 15,575 | 1.6% |
| 2010 | 15,337 | - |
Race / Ethnicity in Clayton
Clayton is:
67.0% White with 11,587 White residents.
8.8% African American with 1,525 African American residents.
0.1% American Indian with 13 American Indian residents.
12.7% Asian with 2,191 Asian residents.
0.0% Hawaiian with 0 Hawaiian residents.
0.7% Other with 118 Other residents.
6.2% Two Or More with 1,065 Two Or More residents.
4.5% Hispanic with 783 Hispanic residents.
| Race | Clayton | MO | USA |
|---|---|---|---|
| White | 67.0% | 76.8% | 58.2% |
| African American | 8.8% | 11.0% | 12.0% |
| American Indian | 0.1% | 0.2% | 0.5% |
| Asian | 12.7% | 2.1% | 5.7% |
| Hawaiian | 0.0% | 0.1% | 0.2% |
| Other | 0.7% | 0.4% | 0.5% |
| Two Or More | 6.2% | 4.4% | 3.9% |
| Hispanic | 4.5% | 5.1% | 19.0% |
Gender in Clayton
Clayton is 52.0% female with 8,993 female residents.
Clayton is 48.0% male with 8,289 male residents.
| Gender | Clayton | MO | USA |
|---|---|---|---|
| Female | 52.0% | 50.7% | 50.5% |
| Male | 48.0% | 49.3% | 49.5% |
Highest level of educational attainment in Clayton for adults over 25
-0.0% of adults in Clayton completed < 9th grade.
3.0% of adults in Clayton completed 9-12th grade.
5.0% of adults in Clayton completed high school / ged.
7.0% of adults in Clayton completed some college.
1.0% of adults in Clayton completed associate's degree.
31.0% of adults in Clayton completed bachelor's degree.
28.0% of adults in Clayton completed master's degree.
16.0% of adults in Clayton completed professional degree.
9.0% of adults in Clayton completed doctorate degree.
| Education | Clayton | MO | USA |
|---|---|---|---|
| < 9th Grade | -0.0% | 3.0% | 5.0% |
| 9-12th Grade | 3.0% | 6.0% | 6.0% |
| High School / GED | 5.0% | 30.0% | 26.0% |
| Some College | 7.0% | 21.0% | 19.0% |
| Associate's Degree | 1.0% | 8.0% | 9.0% |
| Bachelor's Degree | 31.0% | 20.0% | 21.0% |
| Master's Degree | 28.0% | 9.0% | 10.0% |
| Professional Degree | 16.0% | 2.0% | 2.0% |
| Doctorate Degree | 9.0% | 1.0% | 2.0% |
Household Income For Clayton, Missouri
6.1% of households in Clayton earn Less than $10,000.
1.9% of households in Clayton earn $10,000 to $14,999.
2.7% of households in Clayton earn $15,000 to $24,999.
2.0% of households in Clayton earn $25,000 to $34,999.
8.7% of households in Clayton earn $35,000 to $49,999.
10.8% of households in Clayton earn $50,000 to $74,999.
8.7% of households in Clayton earn $75,000 to $99,999.
14.9% of households in Clayton earn $100,000 to $149,999.
10.6% of households in Clayton earn $150,000 to $199,999.
33.5% of households in Clayton earn $200,000 or more.
| Income | Clayton | MO | USA |
|---|---|---|---|
| Less than $10,000 | 6.1% | 4.8% | 4.9% |
| $10,000 to $14,999 | 1.9% | 4.0% | 3.6% |
| $15,000 to $24,999 | 2.7% | 7.6% | 6.6% |
| $25,000 to $34,999 | 2.0% | 7.9% | 6.8% |
| $35,000 to $49,999 | 8.7% | 12.2% | 10.4% |
| $50,000 to $74,999 | 10.8% | 17.5% | 15.7% |
| $75,000 to $99,999 | 8.7% | 13.3% | 12.7% |
| $100,000 to $149,999 | 14.9% | 16.9% | 17.4% |
| $150,000 to $199,999 | 10.6% | 7.7% | 9.3% |
| $200,000 or more | 33.5% | 8.1% | 12.6% |


