Most Asian cities in Colorado research summary. We analyzed Colorado’s most recent Census data to determine the most Asian cities in Colorado based on the percentage of Asian residents. Here are the results of our analysis:
-
The most Asian city in Colorado is Superior based on the most recent Census data.
-
Superior is 16.82% Asian.
-
The least Asian city in Colorado is Woodland Park.
-
Woodland Park is 0.0% Asian.
-
Colorado is 3.1% Asian.
-
Colorado is the 22nd most Asian state in the United States.
Table Of Contents: Top Ten | Methodology | Summary | Table
Here are the cities in Colorado with the largest Asian population in 2024:
Which city in Colorado had the largest Asian population? Superior took the number one overall spot for the largest Asian in Colorado for 2024. 16.82% of Superior identify as Asian.
Read below to see how we crunched the numbers and how your town ranked.
To see where Colorado ranked as a state on diversity, we have a ranking of the most diverse states in America.
And if you already knew these places were Asian, check out the best places to live in Colorado or the most diverse places in Colorado.
The 10 Most Asian Cities In Colorado For 2024
/10
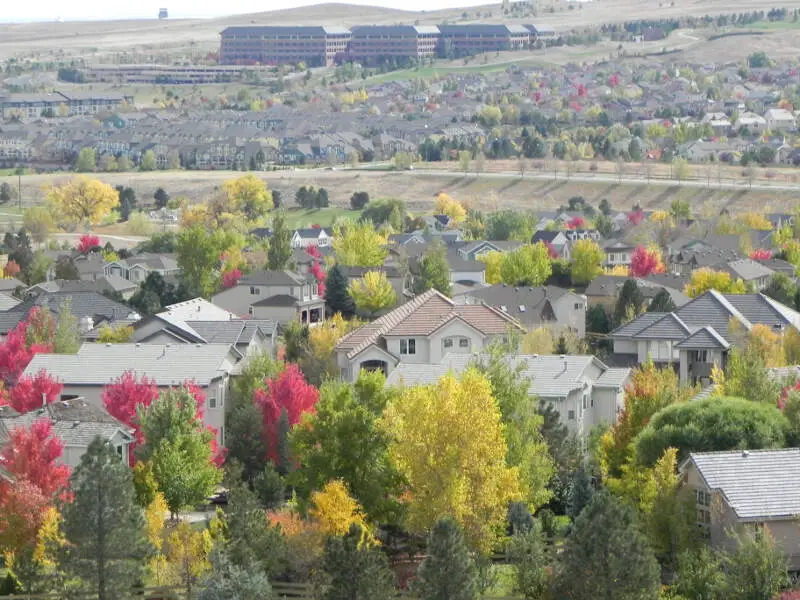
Population: 13,146
% Asian: 16.82%
# Of Asian Residents: 2,211
More on Superior: Data | Cost Of Living | Real Estate

/10
Population: 15,537
% Asian: 13.71%
# Of Asian Residents: 2,130
More on Greenwood Village: Data | Cost Of Living | Real Estate
/10
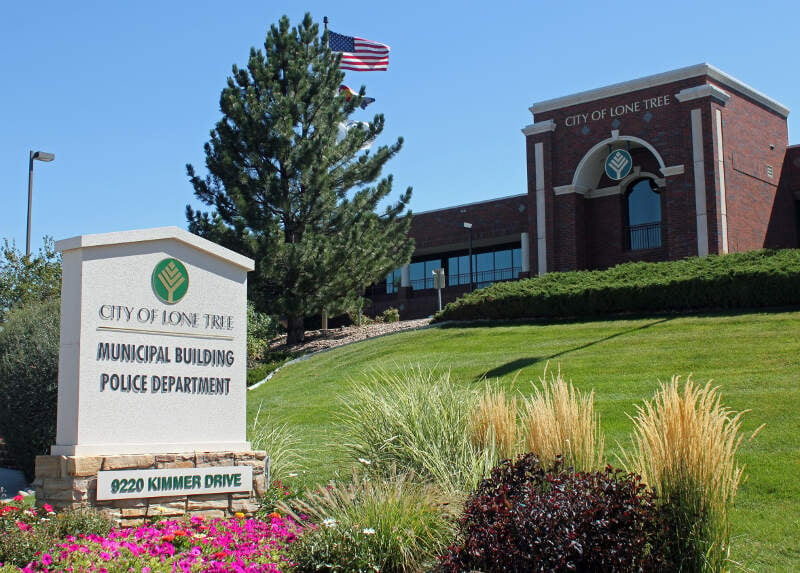
Population: 13,993
% Asian: 9.95%
# Of Asian Residents: 1,392
More on Lone Tree: Data | Crime | Cost Of Living | Real Estate
/10
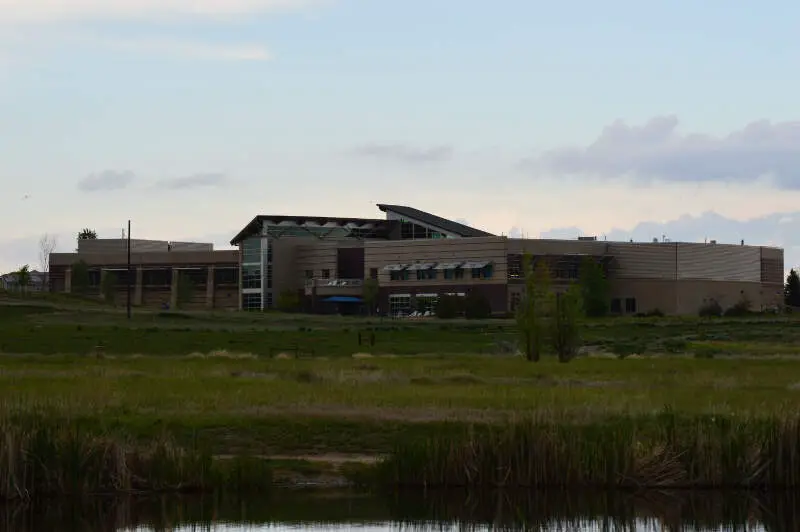
Population: 73,946
% Asian: 6.91%
# Of Asian Residents: 5,110
More on Broomfield: Data | Crime | Cost Of Living | Real Estate
/10
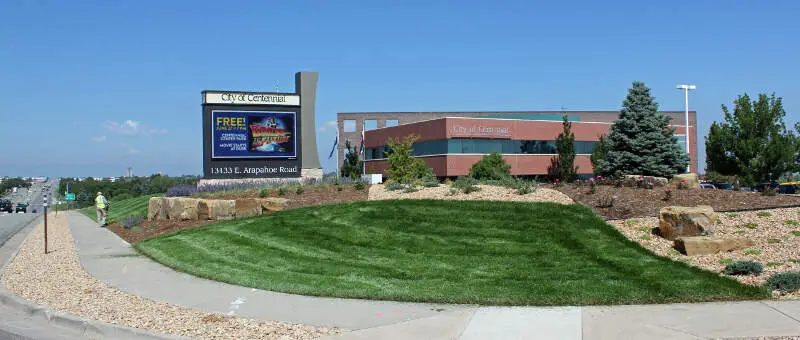
Population: 107,702
% Asian: 6.33%
# Of Asian Residents: 6,822
More on Centennial: Data | Crime | Cost Of Living | Real Estate
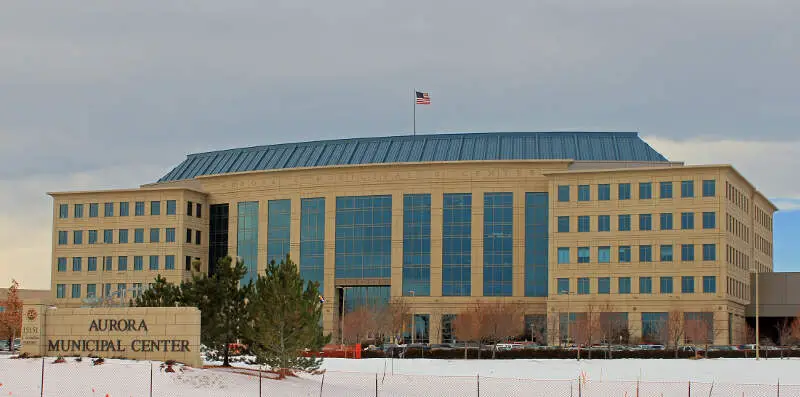
/10
Population: 387,349
% Asian: 5.93%
# Of Asian Residents: 22,965
More on Aurora: Data | Crime | Cost Of Living | Real Estate
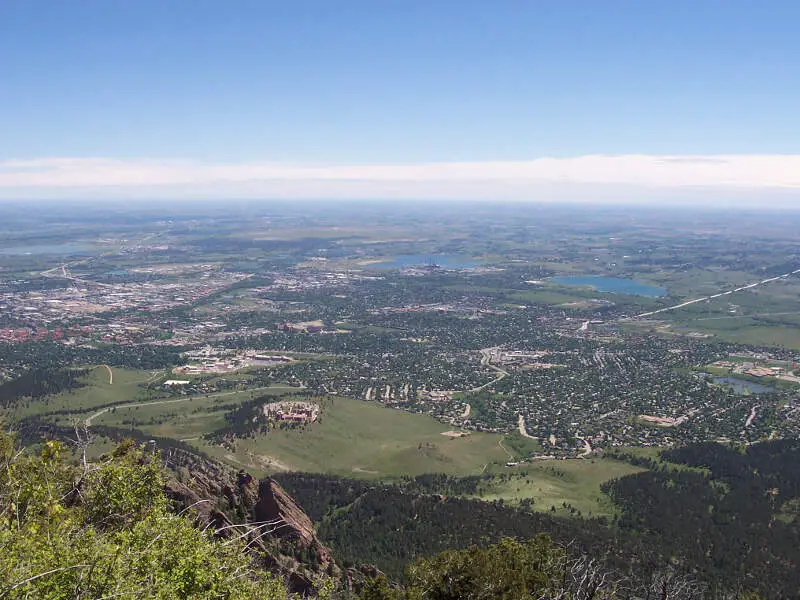
/10
Population: 106,598
% Asian: 5.88%
# Of Asian Residents: 6,269
More on Boulder: Data | Crime | Cost Of Living | Real Estate
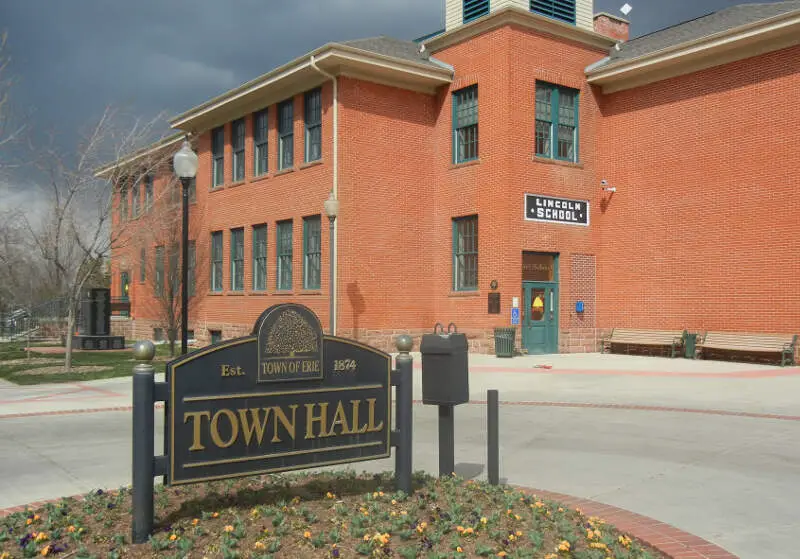
/10
Population: 30,447
% Asian: 5.87%
# Of Asian Residents: 1,787
More on Erie: Data | Crime | Cost Of Living | Real Estate

/10
Population: 6,115
% Asian: 5.79%
# Of Asian Residents: 354
More on Avon: Data | Crime | Cost Of Living | Real Estate

/10
Population: 141,799
% Asian: 5.54%
# Of Asian Residents: 7,854
More on Thornton: Data | Crime | Cost Of Living | Real Estate
Methodology: How We Determined The Cities In Colorado With The Largest Asian Population For 2024
We used Saturday Night Science to compare Census data on race across every place in Colorado.
The Census’s most recently available data comes from the 2018-2022 American Community Survey.
Specifically, we looked at table B03002: Hispanic OR LATINO ORIGIN BY RACE. Here are the category names as defined by the Census:
- Hispanic or Latino
- White alone*
- Black or African American alone*
- American Indian and Alaska Native alone*
- Asian alone*
- Native Hawaiian and Other Pacific Islander alone*
- Some other race alone*
- Two or more races*
Our particular column of interest here was the number of people who identified as Asian alone.
We limited our analysis to cities with a population greater than 5,000 people. That left us with 70 cities.
We then calculated the percentage of residents that are Asian. The percentages ranked from 16.8% to 0.0%.
Finally, we ranked each city based on the percentage of Asian population, with a higher score being more Asian than a lower score. Superior took the distinction of being the most Asian, while Woodland Park was the least Asian city.
We updated this article for 2024. This report reflects our tenth time ranking the cities in Colorado with the largest Asian population.
Read on for more information on how the cities in Colorado ranked by population of Asian residents or, for a more general take on diversity in America, head over to our ranking of the most diverse cities in America.
Summary: Asian Populations Across Colorado
If you’re looking for a breakdown of Asian populations across Colorado according to the most recent data, this is an accurate list.
The most Asian cities in Colorado are Superior, Greenwood Village, Lone Tree, Broomfield, Centennial, Aurora, Boulder, Erie, Avon, and Thornton.
If you’re curious enough, here are the least Asian places in Colorado:
- Woodland Park
- Eagle
- Brush
For more Colorado reading, check out:
Table: Asian Population By City In Colorado
| Rank | City | Population | Asian Population | % Asian |
|---|---|---|---|---|
| 1 | Superior | 13,146 | 2,211 | 16.82% |
| 2 | Greenwood Village | 15,537 | 2,130 | 13.71% |
| 3 | Lone Tree | 13,993 | 1,392 | 9.95% |
| 4 | Broomfield | 73,946 | 5,110 | 6.91% |
| 5 | Centennial | 107,702 | 6,822 | 6.33% |
| 6 | Aurora | 387,349 | 22,965 | 5.93% |
| 7 | Boulder | 106,598 | 6,269 | 5.88% |
| 8 | Erie | 30,447 | 1,787 | 5.87% |
| 9 | Avon | 6,115 | 354 | 5.79% |
| 10 | Thornton | 141,799 | 7,854 | 5.54% |
| 11 | Parker | 58,733 | 3,023 | 5.15% |
| 12 | Westminster | 115,502 | 5,533 | 4.79% |
| 13 | Frederick | 15,037 | 645 | 4.29% |
| 14 | Louisville | 20,920 | 819 | 3.91% |
| 15 | John | 17,327 | 674 | 3.89% |
| 16 | Lakewood | 156,149 | 6,072 | 3.89% |
| 17 | Denver | 710,800 | 24,807 | 3.49% |
| 18 | Alamosa | 9,792 | 327 | 3.34% |
| 19 | Fort Collins | 168,758 | 5,606 | 3.32% |
| 20 | Lafayette | 30,295 | 1,003 | 3.31% |
| 21 | Sheridan | 6,062 | 186 | 3.07% |
| 22 | Colorado Springs | 479,612 | 14,532 | 3.03% |
| 23 | Northglenn | 37,948 | 1,145 | 3.02% |
| 24 | Aspen | 6,952 | 195 | 2.8% |
| 25 | Longmont | 98,282 | 2,739 | 2.79% |
| 26 | Firestone | 16,704 | 465 | 2.78% |
| 27 | Littleton | 45,531 | 1,142 | 2.51% |
| 28 | Federal Heights | 14,173 | 344 | 2.43% |
| 29 | Fountain | 29,498 | 703 | 2.38% |
| 30 | Commerce City | 63,050 | 1,472 | 2.33% |
| 31 | Arvada | 123,066 | 2,817 | 2.29% |
| 32 | Castle Rock | 74,065 | 1,594 | 2.15% |
| 33 | Englewood | 33,634 | 710 | 2.11% |
| 34 | Glenwood Springs | 10,100 | 202 | 2.0% |
| 35 | Estes Park | 5,906 | 104 | 1.76% |
| 36 | Salida | 5,697 | 100 | 1.76% |
| 37 | Cherry Hills Village | 6,405 | 109 | 1.7% |
| 38 | Brighton | 40,569 | 688 | 1.7% |
| 39 | Trinidad | 8,334 | 139 | 1.67% |
| 40 | Golden | 20,461 | 341 | 1.67% |
| 41 | Windsor | 33,905 | 555 | 1.64% |
| 42 | Cortez | 8,832 | 142 | 1.61% |
| 43 | Steamboat Springs | 13,251 | 206 | 1.55% |
| 44 | Evans | 22,092 | 324 | 1.47% |
| 45 | Delta | 9,137 | 121 | 1.32% |
| 46 | Grand Junction | 65,918 | 794 | 1.2% |
| 47 | Greeley | 107,949 | 1,256 | 1.16% |
| 48 | La Junta | 7,244 | 84 | 1.16% |
| 49 | Wheat Ridge | 32,263 | 363 | 1.13% |
| 50 | Gunnison | 6,629 | 71 | 1.07% |
| 51 | Carbondale | 6,497 | 69 | 1.06% |
| 52 | Durango | 19,148 | 184 | 0.96% |
| 53 | Montrose | 20,394 | 193 | 0.95% |
| 54 | Loveland | 76,500 | 715 | 0.93% |
| 55 | Lamar | 7,667 | 65 | 0.85% |
| 56 | Berthoud | 10,892 | 89 | 0.82% |
| 57 | Pueblo | 111,430 | 790 | 0.71% |
| 58 | Wellington | 11,163 | 71 | 0.64% |
| 59 | Edgewater | 5,002 | 31 | 0.62% |
| 60 | Rifle | 10,420 | 59 | 0.57% |
| 61 | Milliken | 8,438 | 47 | 0.56% |
| 62 | Fruita | 13,462 | 64 | 0.48% |
| 63 | Sterling | 13,466 | 62 | 0.46% |
| 64 | Fort Morgan | 11,501 | 52 | 0.45% |
| 65 | Craig | 9,013 | 36 | 0.4% |
| 66 | Gypsum | 8,291 | 23 | 0.28% |
| 67 | Fort Lupton | 8,164 | 10 | 0.12% |
| 68 | Brush | 5,304 | 0 | 0.0% |
| 69 | Eagle | 7,481 | 0 | 0.0% |
| 70 | Woodland Park | 7,911 | 0 | 0.0% |
