Most Asian cities in Kansas research summary. We analyzed Kansas’s most recent Census data to determine the most Asian cities in Kansas based on the percentage of Asian residents.
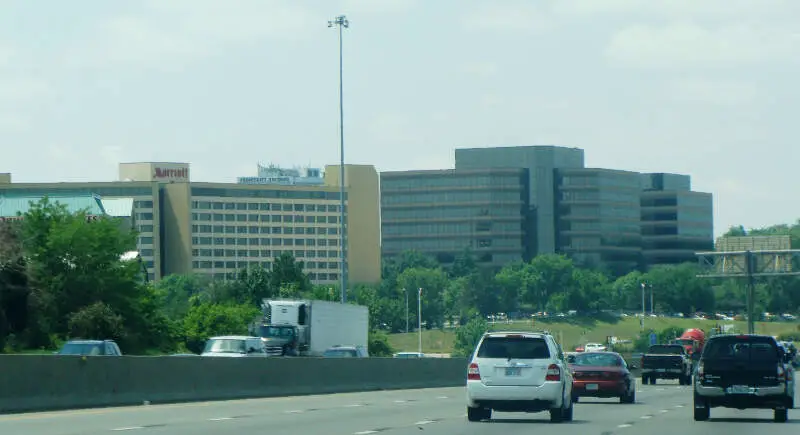
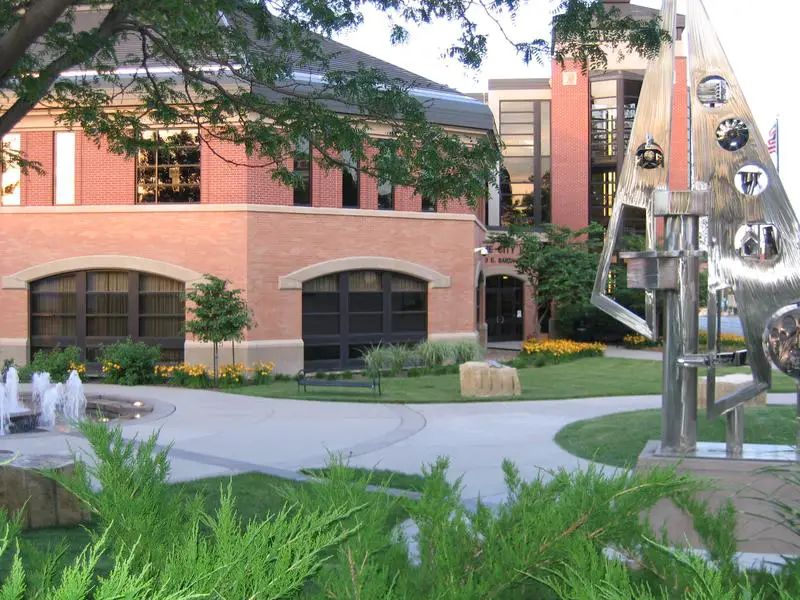
9.0% Asian · #1 most Asian in Kansas
Overland Park is the second most populous city in the U.S. state of Kansas. Located in Johnson County, it is also the second most populous city in the Kansas City metropolitan area. As of the 2010 census, the city population was 173,372.
Data | Crime | Cost of living | Movers
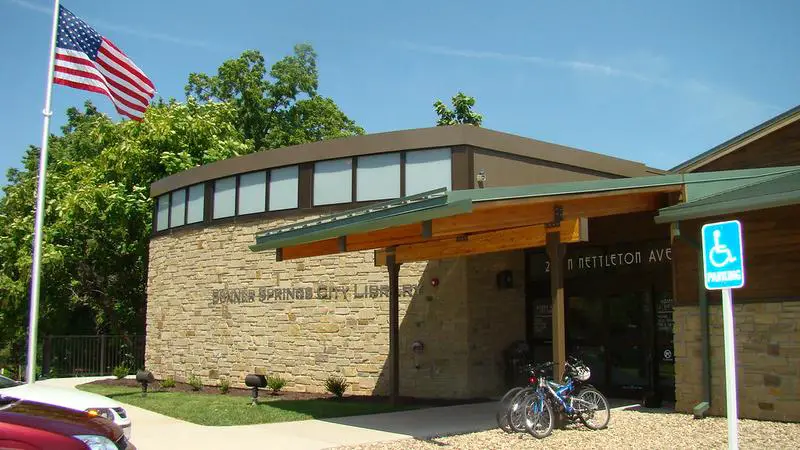
5.7% Asian · #2 most Asian in Kansas
Bonner Springs is a city in Johnson, Leavenworth, and Wyandotte counties in the State of Kansas, and part of the Kansas City Metropolitan Area. As of the 2010 census, the city population was 7,314.
Data | Crime | Cost of living | Movers
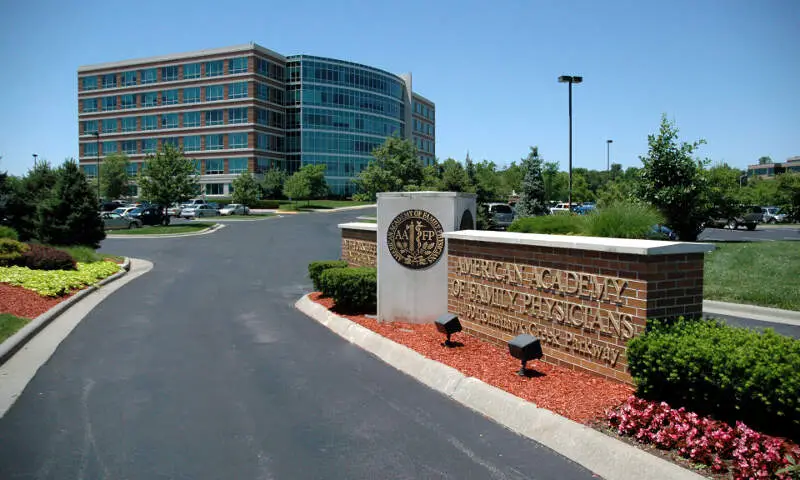
5.7% Asian · #3 most Asian in Kansas
Leawood is a city in Johnson County, Kansas, United States, and part of the Kansas City metropolitan area. As of the 2010 census, the city population was 31,867.
Data | Crime | Cost of living | Movers
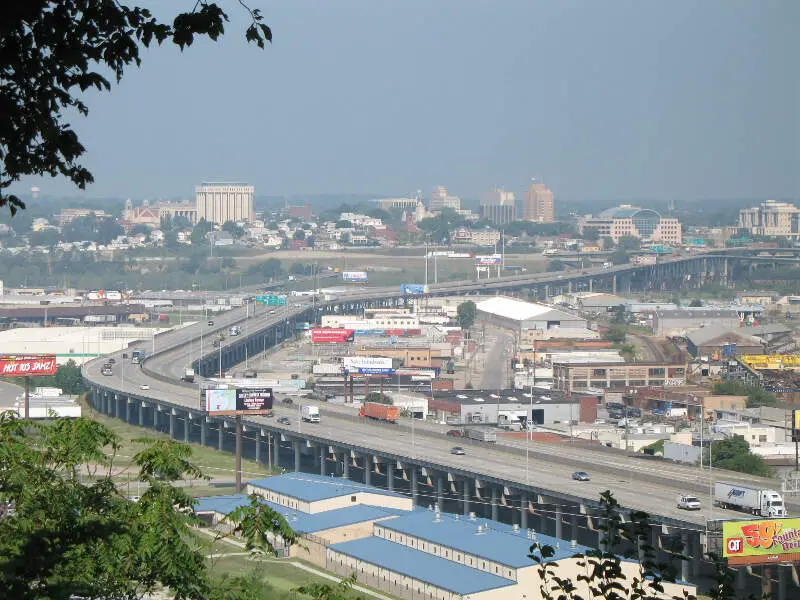
5.3% Asian · #4 most Asian in Kansas
Kansas City is the third-largest city in the state of Kansas, the county seat of Wyandotte County, and the third-largest city of the Kansas City metropolitan area. Kansas City, Kansas is abbreviated as “KCK” to differentiate it from Kansas City, Missouri. It is part of a consolidated city-county government known as the “Unified Government”. Wyandotte County also includes the independent cities of Bonner Springs and Edwardsville. As of the 2010 census, the city had a population of 145,786 residents. It is situated at Kaw Point, which is the junction of the Missouri and Kansas rivers.
Data | Crime | Cost of living | Movers
5.1% Asian · #5 most Asian in Kansas
Lawrence is the county seat of Douglas County and sixth largest city in Kansas. It is located in the northeastern sector of the state, next to Interstate 70, between the Kansas and Wakarusa Rivers. As of the 2010 census, the city’s population was 87,643. Lawrence is a college town and the home to the University of Kansas and Haskell Indian Nations University.
Data | Crime | Cost of living | Movers
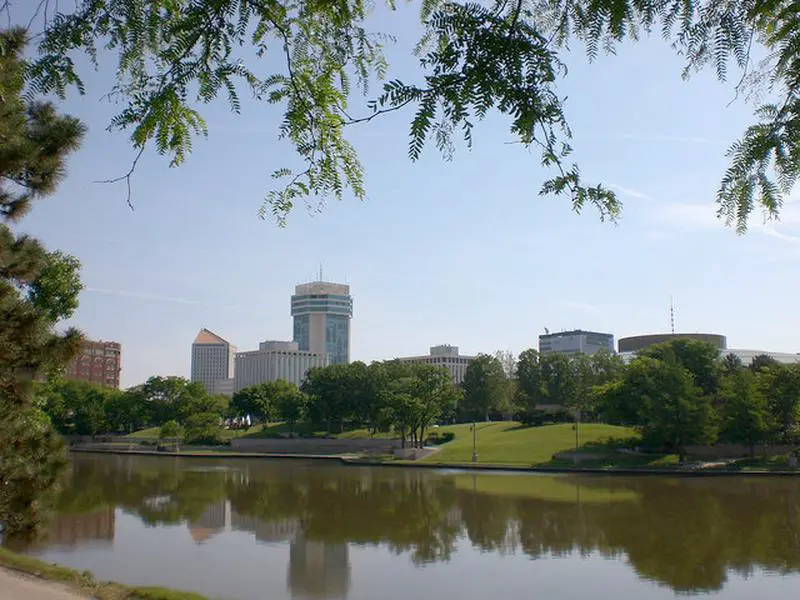
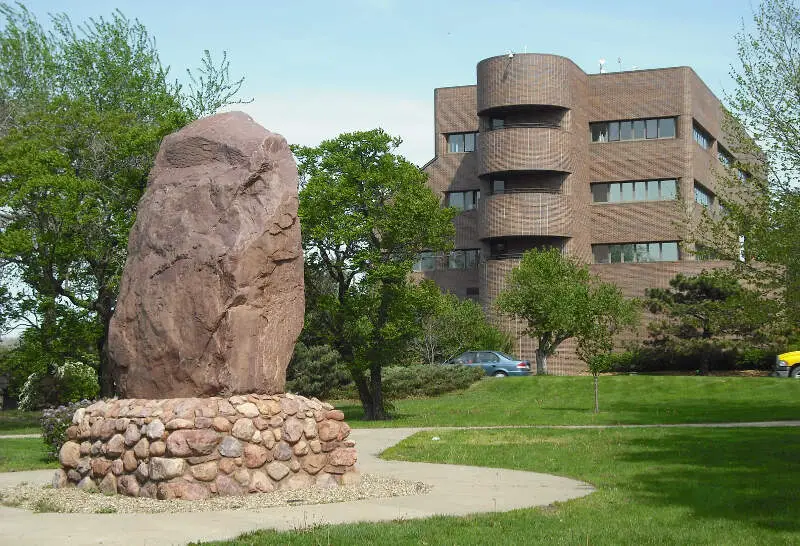
4.9% Asian · #6 most Asian in Kansas
Wichita is the largest city in the U.S. state of Kansas. Located in south-central Kansas on the Arkansas River, Wichita is the county seat of Sedgwick County and the principal city of the Wichita metropolitan area whose estimated population in 2015 was 644,610. As of 2016, the city of Wichita had an estimated population of 389,902.
Data | Crime | Cost of living | Movers | Compare
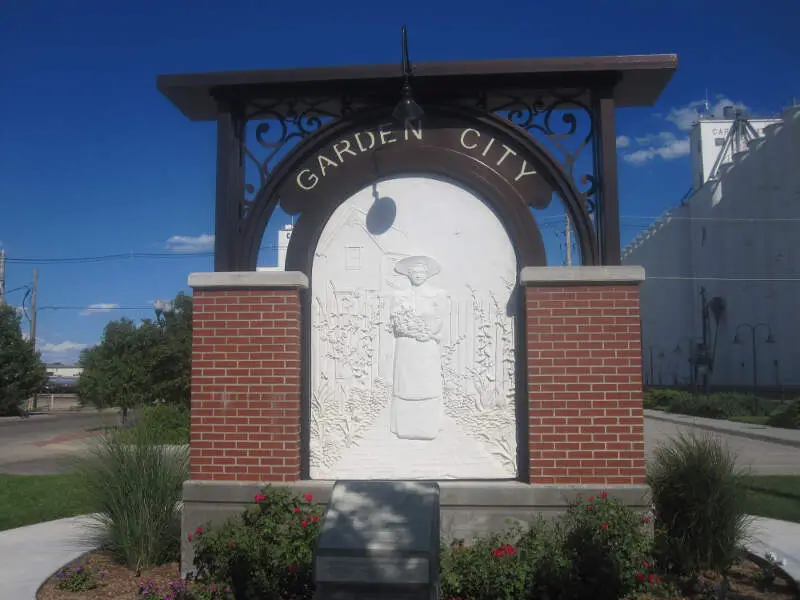
4.9% Asian · #7 most Asian in Kansas
Garden City is a city in and the county seat of Finney County, Kansas, United States. As of the 2010 census, the city population was 26,658. The city is home to Garden City Community College and the Lee Richardson Zoo, the largest zoological park in western Kansas.
Data | Crime | Cost of living | Movers
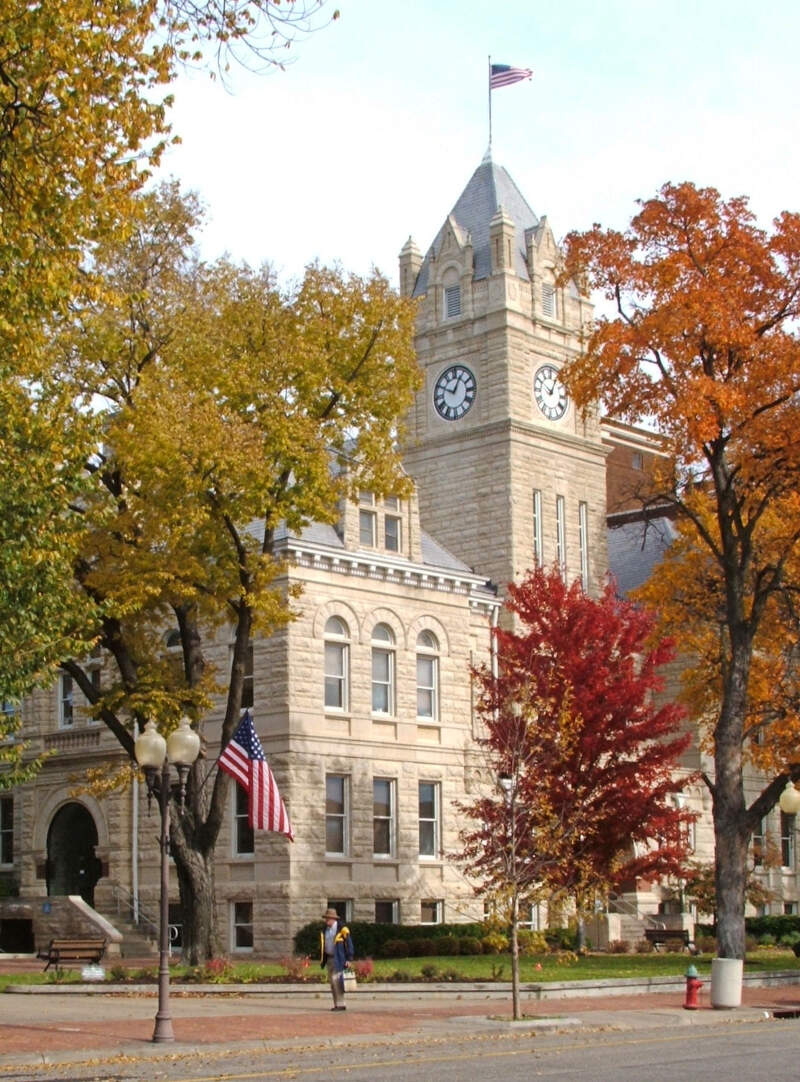
4.6% Asian · #8 most Asian in Kansas
Manhattan is a city in northeastern Kansas in the United States at the junction of the Kansas River and Big Blue River. It is the county seat of Riley County, although it extends into Pottawatomie County. As of the 2010 census, the city population was 52,281.
Data | Crime | Cost of living | Movers
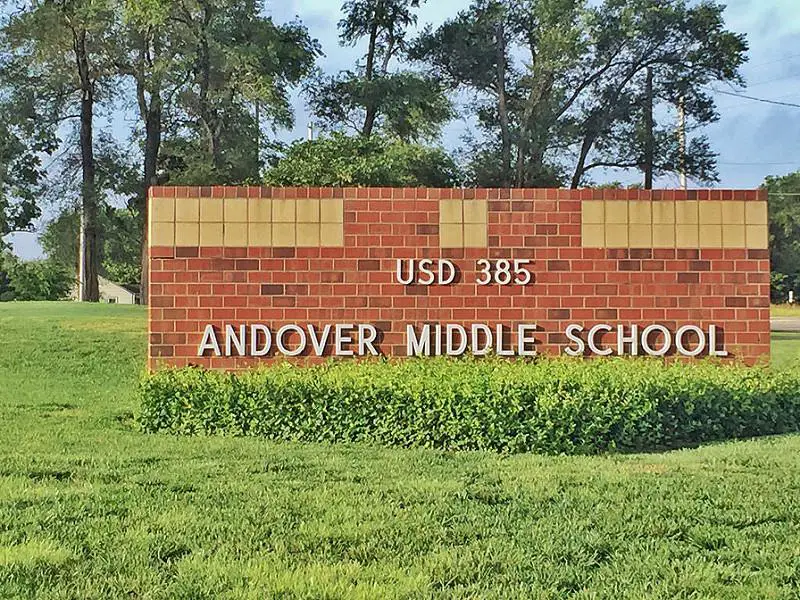
4.5% Asian · #9 most Asian in Kansas
Andover is a city in Butler County, Kansas, United States, and a suburb of Wichita. As of the 2010 census, the city population was 11,791.
Data | Crime | Cost of living | Movers
4.3% Asian · #10 most Asian in Kansas
Olathe is a city in, and is the county seat of, Johnson County, Kansas, United States. Located in northeastern Kansas, it is the fourth most populous city in Kansas, with a population of 125,872 persons as of 2010. Olathe is also the fourth-largest city in the Kansas City metropolitan area. It is bordered by the cities of Lenexa to the north, Overland Park to the east, De Soto to the northwest, and Gardner to the southwest.
Data | Crime | Cost of living | Movers
The receipts
Compare the top ten
Pick a metric. The bars rescale. The red line is Kansas’s statewide median.
On the map
Where Kansas’s Asian communities live
Saturday Night Science
Methodology: How We Determined The Cities In Kansas With The Largest Asian Population For 2026
We used Saturday Night Science to compare Census data on race across every place in Kansas.
The Census’s most recently available data comes from the 2020-2024 American Community Survey.
Specifically, we looked at table B03002: Hispanic OR LATINO ORIGIN BY RACE. Here are the category names as defined by the Census:
- Hispanic or Latino
- White alone*
- Black or African American alone*
- American Indian and Alaska Native alone*
- Asian alone*
- Native Hawaiian and Other Pacific Islander alone*
- Some other race alone*
- Two or more races*
Our particular column of interest here was the number of people who identified as Asian alone.
We limited our analysis to cities with a population greater than 5,000 people. That left us with 58 cities.
We then calculated the percentage of residents that are Asian. The percentages ranked from 9.0% to 0.0%.
Finally, we ranked each city based on the percentage of Asian population, with a higher percentage being more Asian. Overland Park took the distinction of being the most Asian, while Abilene was the least Asian city.
We updated this article for 2026. This report reflects our eleventh time ranking the cities in Kansas with the largest Asian population.
The full plate
Cities In Kansas By Asian Population
Click any column to sort. Search by city name.
| Rank | City | Population | Asian Population | % Asian |
|---|---|---|---|---|
| 1 | Overland Park | 200,306 | 17,970 | 9.0% |
| 2 | Bonner Springs | 7,839 | 445 | 5.7% |
| 3 | Leawood | 33,809 | 1,911 | 5.7% |
| 4 | Kansas City | 155,135 | 8,245 | 5.3% |
| 5 | Lawrence | 96,051 | 4,932 | 5.1% |
| 6 | Wichita | 397,945 | 19,467 | 4.9% |
| 7 | Garden City | 27,819 | 1,356 | 4.9% |
| 8 | Manhattan | 54,239 | 2,485 | 4.6% |
| 9 | Andover | 15,965 | 718 | 4.5% |
| 10 | Olathe | 145,057 | 6,223 | 4.3% |
| 11 | Mission | 9,915 | 424 | 4.3% |
| 12 | Lenexa | 58,384 | 2,374 | 4.1% |
| 13 | Bel Aire | 9,043 | 360 | 4.0% |
| 14 | Park City | 7,673 | 234 | 3.0% |
| 15 | Winfield | 11,711 | 353 | 3.0% |
| 16 | Shawnee | 68,542 | 1,939 | 2.8% |
| 17 | Pittsburg | 20,637 | 582 | 2.8% |
| 18 | Liberal | 19,316 | 503 | 2.6% |
| 19 | Junction City | 22,331 | 570 | 2.6% |
| 20 | Emporia | 24,131 | 529 | 2.2% |
| 21 | Leavenworth | 37,195 | 784 | 2.1% |
| 22 | Hays | 21,143 | 401 | 1.9% |
| 23 | Salina | 46,307 | 856 | 1.8% |
| 24 | De Soto | 6,414 | 116 | 1.8% |
| 25 | Merriam | 11,085 | 183 | 1.7% |
| 26 | Prairie Village | 22,874 | 373 | 1.6% |
| 27 | Topeka | 125,786 | 1,937 | 1.5% |
| 28 | Lansing | 11,246 | 157 | 1.4% |
| 29 | El Dorado | 12,769 | 173 | 1.4% |
| 30 | Valley Center | 8,590 | 104 | 1.2% |
| 31 | Dodge City | 27,613 | 314 | 1.1% |
| 32 | Roeland Park | 6,763 | 74 | 1.1% |
| 33 | Derby | 26,062 | 270 | 1.0% |
| 34 | Gardner | 24,526 | 228 | 0.9% |
| 35 | Ottawa | 12,678 | 109 | 0.9% |
| 36 | McPherson | 13,995 | 111 | 0.8% |
| 37 | Chanute | 8,598 | 60 | 0.7% |
| 38 | Haysville | 11,117 | 71 | 0.6% |
| 39 | Hutchinson | 39,709 | 253 | 0.6% |
| 40 | Arkansas City | 11,884 | 65 | 0.5% |
| 41 | Atchison | 10,785 | 48 | 0.4% |
| 42 | Iola | 5,348 | 22 | 0.4% |
| 43 | Paola | 5,770 | 21 | 0.4% |
| 44 | Great Bend | 14,479 | 48 | 0.3% |
| 45 | Pratt | 6,577 | 21 | 0.3% |
| 46 | Wellington | 7,615 | 20 | 0.3% |
| 47 | Augusta | 9,216 | 19 | 0.2% |
| 48 | Newton | 18,397 | 37 | 0.2% |
| 49 | Fort Scott | 7,555 | 14 | 0.2% |
| 50 | Concordia | 5,015 | 8 | 0.2% |
| 51 | Coffeyville | 8,662 | 6 | 0.1% |
| 52 | Parsons | 9,425 | 2 | 0.0% |
| 55 | Independence | 8,422 | 0 | 0.0% |
| 55 | Mulvane | 6,171 | 0 | 0.0% |
| 55 | Eudora | 6,119 | 0 | 0.0% |
| 55 | Colby | 5,387 | 0 | 0.0% |
| 55 | Ulysses | 5,476 | 0 | 0.0% |
| 55 | Abilene | 6,449 | 0 | 0.0% |
Source: U.S. Census ACS 2020-2024. 58 cities with more than 5,000 residents.
Summary
Summary: Asian Populations Across Kansas
If you’re looking for a breakdown of Asian populations across Kansas according to the most recent data, this is an accurate list.
The most Asian cities in Kansas are Overland Park, Bonner Springs, Leawood, Kansas City, Lawrence, Wichita, Garden City, Manhattan, Andover, and Olathe. Not sold on Kansas? Take the two-minute Find Your Place quiz and see which state actually fits you.
Questions and answers
Most Asian Cities In Kansas FAQs
What is the most Asian city in Kansas?
Overland Park is the most Asian city in Kansas for 2026, at 9.0% of residents. Bonner Springs and Leawood are next.
What cities in Kansas have the largest Asian population?
The Kansas cities with the largest Asian population shares are Overland Park, Bonner Springs, Leawood, Kansas City, Lawrence, Wichita, Garden City, Manhattan, Andover, and Olathe. We ranked all 58 places with more than 5,000 residents.
What percent of Overland Park is Asian?
Asian residents make up 9.0% of Overland Park, the highest share of the 58 Kansas places we measured. The numbers come from the Census Bureau’s American Community Survey.
What is the least Asian city in Kansas?
Abilene is the least Asian city in Kansas, at 0.0%. It sits at the opposite end of the same ranking.
Where does this data come from?
Every share is calculated from the Census Bureau’s American Community Survey (2020-2024), based on residents identifying as Asian alone. We rank each Kansas place with more than 5,000 residents.


