Most Asian cities in Mississippi research summary. We analyzed Mississippi’s most recent Census data to determine the most Asian cities in Mississippi based on the percentage of Asian residents.
8.0% Asian · #1 most Asian in Mississippi
D’Iberville is a city in Harrison County, Mississippi, immediately north of Biloxi, across the Back Bay. As of the 2010 United States Census, it had a population of 9,486. It is part of the Gulfport-Biloxi Metropolitan Statistical Area.
Data | Crime | Cost of living | Movers
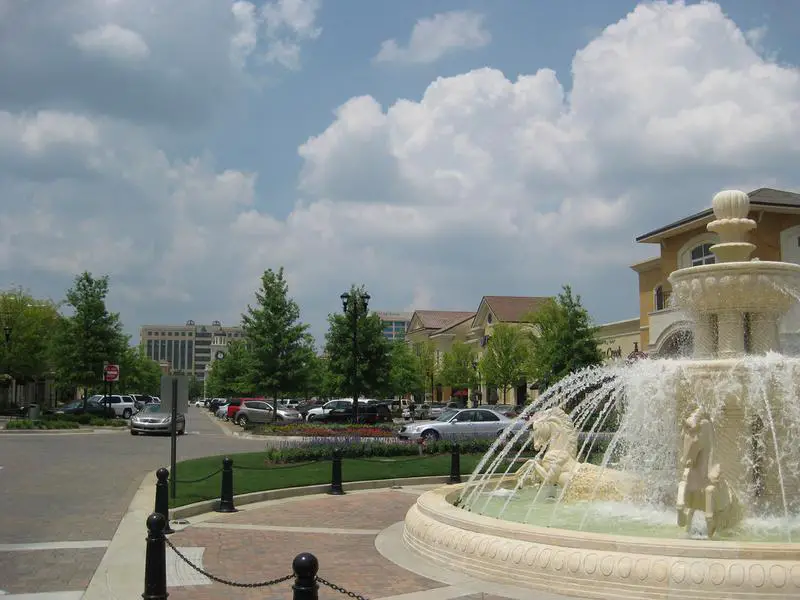
5.9% Asian · #2 most Asian in Mississippi
Madison is a city in Madison County, Mississippi, United States. The population was 24,841 at the 2010 census. The population is currently over 25,000. It is part of the Jackson Metropolitan Statistical Area.
Data | Crime | Cost of living | Movers
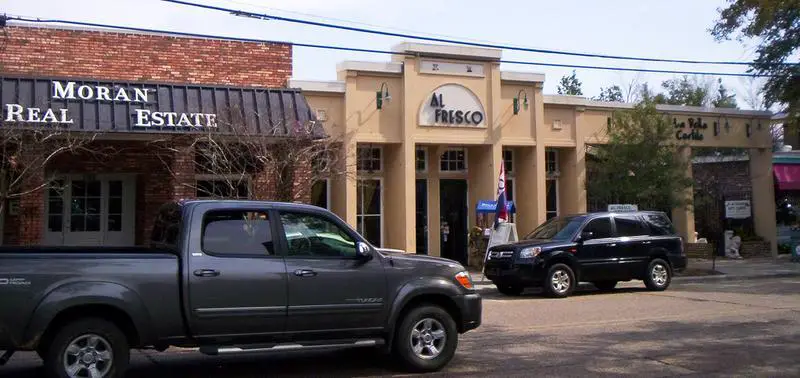
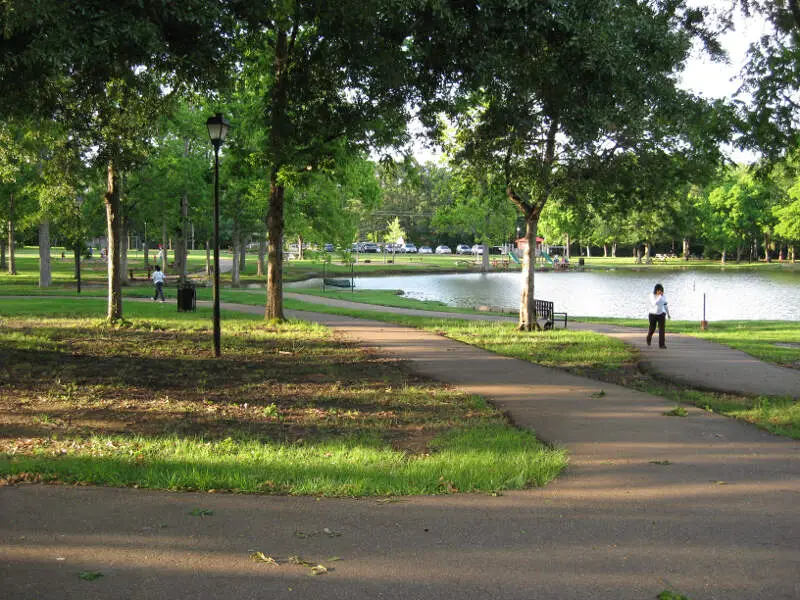
4.9% Asian · #3 most Asian in Mississippi
Ocean Springs is a city in Jackson County, Mississippi, United States, approximately 2 miles east of Biloxi and west of Gautier. It is part of the Pascagoula, Mississippi Metropolitan Statistical Area. The population was 17,225 at the 2000 U.S. Census. As of the 2010 U.S. Census, the city of Ocean Springs had a population of 17,442.
Data | Crime | Cost of living | Movers
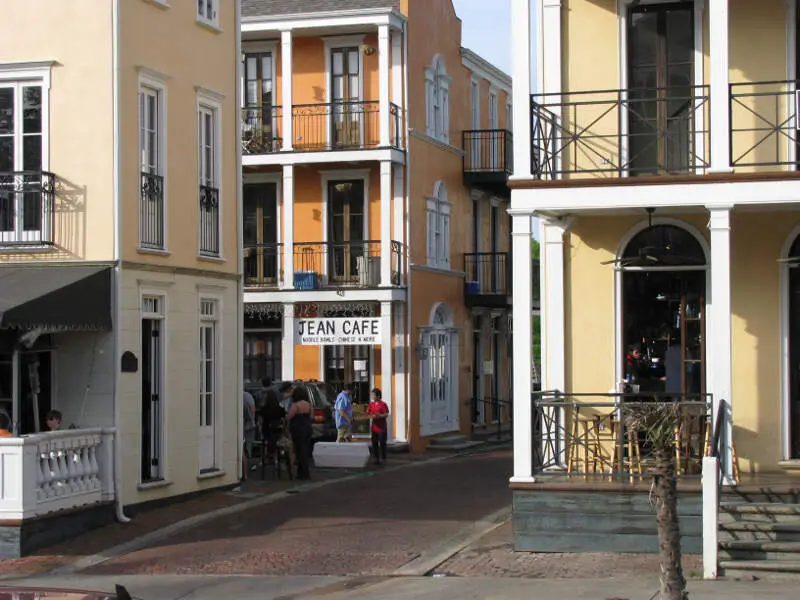
4.6% Asian · #4 most Asian in Mississippi
Clinton is a city in Hinds County, Mississippi, United States. Situated in the Jackson metropolitan area, it is the tenth largest city in Mississippi. The population was 25,216 at the 2010 United States Census.
Data | Crime | Cost of living | Movers
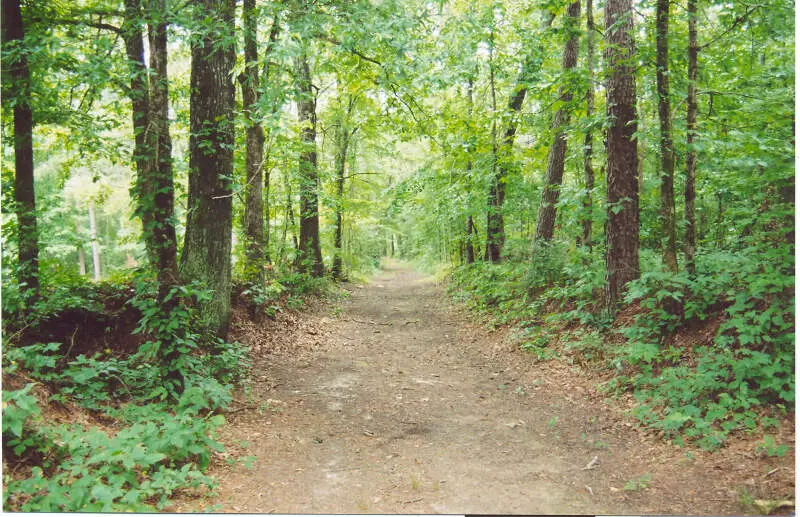
4.6% Asian · #5 most Asian in Mississippi
Starkville is a city in and the county seat of Oktibbeha County, Mississippi, United States. The Starkville Micropolitan Statistical Area includes all of Oktibbeha County. The population was 23,888 at the 2010 census.
Data | Crime | Cost of living | Movers

3.7% Asian · #6 most Asian in Mississippi
Flowood is a city in Rankin County, Mississippi. The population was 7,823 at the 2010 census. It is part of the Jackson Metropolitan Statistical Area.
Data | Crime | Cost of living | Movers
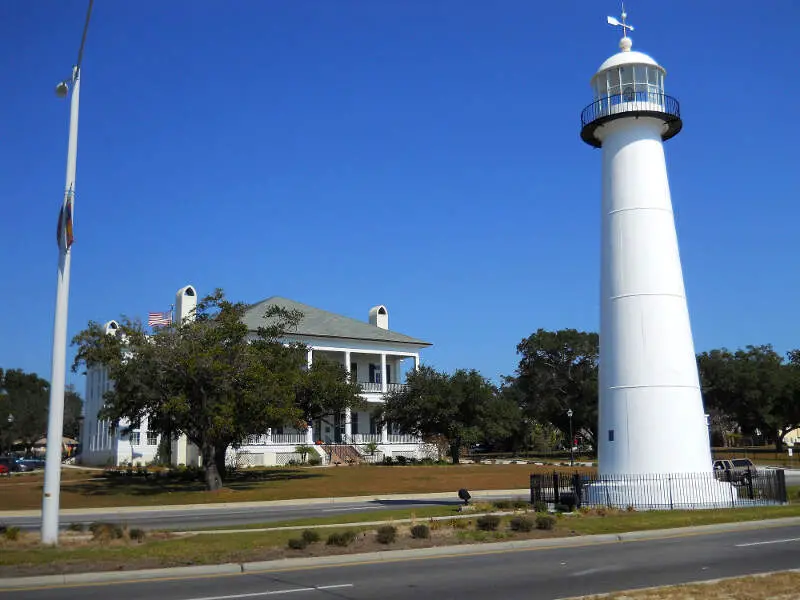
3.6% Asian · #7 most Asian in Mississippi
Biloxi is a city in Harrison County, Mississippi, United States. The 2010 United States Census recorded the population as 44,054, and in 2016 the estimated population was 45,975. Along with the adjoining city of Gulfport, Biloxi is a county seat of Harrison County. It was first settled by French colonists.
Data | Crime | Cost of living | Movers
3.5% Asian · #8 most Asian in Mississippi
Ridgeland is a city in Madison County, Mississippi. The population was 24,047 at the 2010 census. It is part of the Jackson Metropolitan Statistical Area.
Data | Crime | Cost of living | Movers
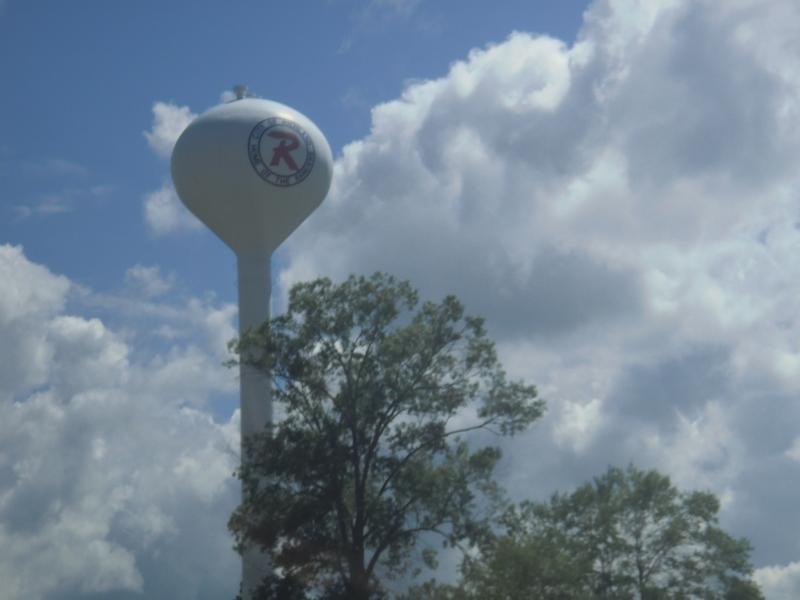
3.5% Asian · #9 most Asian in Mississippi
Data | Crime | Cost of living | Movers
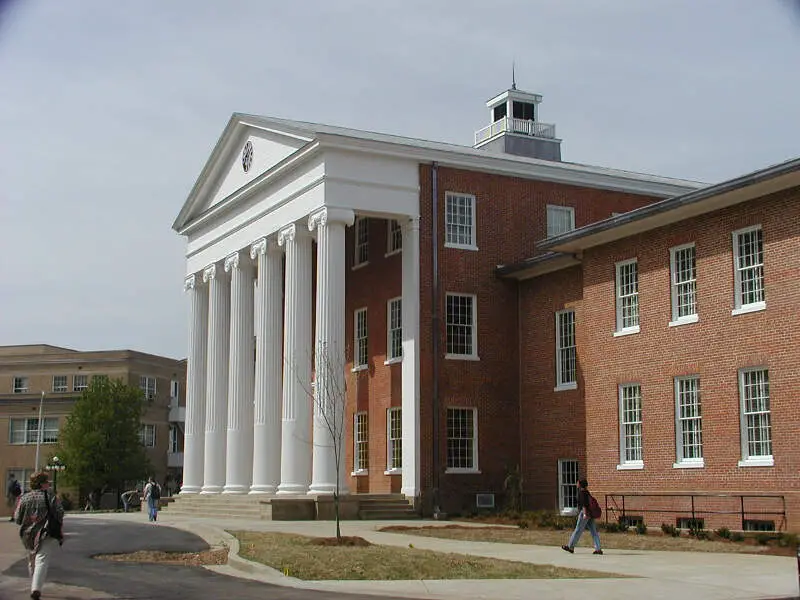
2.8% Asian · #10 most Asian in Mississippi
Oxford is a city in, and the county seat of, Lafayette County, Mississippi, United States. Founded in 1837, it was named after the British university city of Oxford in hopes of having the state university located there, which it did successfully attract.
Data | Crime | Cost of living | Movers
The receipts
Compare the top ten
Pick a metric. The bars rescale. The red line is Mississippi’s statewide median.
On the map
Where Mississippi’s Asian communities live
Saturday Night Science
Methodology: How We Determined The Cities In Mississippi With The Largest Asian Population For 2026
We used Saturday Night Science to compare Census data on race across every place in Mississippi.
The Census’s most recently available data comes from the 2020-2024 American Community Survey.
Specifically, we looked at table B03002: Hispanic OR LATINO ORIGIN BY RACE. Here are the category names as defined by the Census:
- Hispanic or Latino
- White alone*
- Black or African American alone*
- American Indian and Alaska Native alone*
- Asian alone*
- Native Hawaiian and Other Pacific Islander alone*
- Some other race alone*
- Two or more races*
Our particular column of interest here was the number of people who identified as Asian alone.
We limited our analysis to cities with a population greater than 5,000 people. That left us with 59 cities.
We then calculated the percentage of residents that are Asian. The percentages ranked from 8.0% to 0.0%.
Finally, we ranked each city based on the percentage of Asian population, with a higher percentage being more Asian. D’Iberville took the distinction of being the most Asian, while Kosciusko was the least Asian city.
We updated this article for 2026. This report reflects our eleventh time ranking the cities in Mississippi with the largest Asian population.
The full plate
Cities In Mississippi By Asian Population
Click any column to sort. Search by city name.
| Rank | City | Population | Asian Population | % Asian |
|---|---|---|---|---|
| 1 | D’Iberville | 13,203 | 1,059 | 8.0% |
| 2 | Madison | 27,946 | 1,648 | 5.9% |
| 3 | Ocean Springs | 18,646 | 905 | 4.9% |
| 4 | Clinton | 27,195 | 1,263 | 4.6% |
| 5 | Starkville | 25,721 | 1,188 | 4.6% |
| 6 | Flowood | 10,587 | 388 | 3.7% |
| 7 | Biloxi | 48,861 | 1,756 | 3.6% |
| 8 | Ridgeland | 24,587 | 853 | 3.5% |
| 9 | Richland | 7,346 | 254 | 3.5% |
| 10 | Oxford | 26,411 | 729 | 2.8% |
| 11 | Pearl | 27,737 | 706 | 2.5% |
| 12 | Cleveland | 10,623 | 224 | 2.1% |
| 13 | Olive Branch | 47,019 | 991 | 2.1% |
| 14 | Waveland | 7,062 | 146 | 2.1% |
| 15 | Long Beach | 17,009 | 305 | 1.8% |
| 16 | Petal | 11,294 | 195 | 1.7% |
| 17 | Tupelo | 37,791 | 641 | 1.7% |
| 18 | Gulfport | 73,003 | 1,213 | 1.7% |
| 19 | Columbus | 23,348 | 374 | 1.6% |
| 20 | Gautier | 19,046 | 284 | 1.5% |
| 21 | Bay St. Louis | 10,188 | 131 | 1.3% |
| 22 | Hernando | 17,949 | 222 | 1.2% |
| 23 | Pascagoula | 21,710 | 268 | 1.2% |
| 24 | Meridian | 34,137 | 417 | 1.2% |
| 25 | Southaven | 56,226 | 665 | 1.2% |
| 26 | Greenville | 28,166 | 333 | 1.2% |
| 27 | Byram | 12,799 | 132 | 1.0% |
| 28 | Booneville | 9,246 | 91 | 1.0% |
| 29 | Corinth | 14,323 | 125 | 0.9% |
| 30 | Moss Point | 11,957 | 100 | 0.8% |
| 31 | Horn Lake | 26,647 | 210 | 0.8% |
| 32 | Hattiesburg | 48,619 | 343 | 0.7% |
| 33 | Brookhaven | 11,650 | 82 | 0.7% |
| 34 | New Albany | 7,663 | 45 | 0.6% |
| 35 | McComb | 12,049 | 56 | 0.5% |
| 36 | Indianola | 9,062 | 40 | 0.4% |
| 37 | Greenwood | 14,086 | 60 | 0.4% |
| 38 | Philadelphia | 6,996 | 29 | 0.4% |
| 39 | Clarksdale | 14,231 | 53 | 0.4% |
| 40 | Brandon | 25,542 | 92 | 0.4% |
| 41 | Louisville | 5,983 | 18 | 0.3% |
| 42 | Holly Springs | 6,704 | 20 | 0.3% |
| 43 | Jackson | 146,631 | 407 | 0.3% |
| 44 | Laurel | 17,679 | 41 | 0.2% |
| 45 | Senatobia | 8,380 | 17 | 0.2% |
| 46 | Forest | 5,357 | 8 | 0.1% |
| 47 | Amory | 6,500 | 8 | 0.1% |
| 48 | Batesville | 7,387 | 7 | 0.1% |
| 49 | Vicksburg | 20,589 | 17 | 0.1% |
| 50 | West Point | 9,900 | 7 | 0.1% |
| 51 | Natchez | 14,192 | 6 | 0.0% |
| 52 | Yazoo City | 10,219 | 3 | 0.0% |
| 53 | Pontotoc | 5,806 | 1 | 0.0% |
| 56 | Ripley | 5,377 | 0 | 0.0% |
| 56 | Picayune | 11,900 | 0 | 0.0% |
| 56 | Grenada | 12,375 | 0 | 0.0% |
| 56 | Columbia | 6,632 | 0 | 0.0% |
| 56 | Canton | 10,811 | 0 | 0.0% |
| 56 | Kosciusko | 6,933 | 0 | 0.0% |
Source: U.S. Census ACS 2020-2024. 59 cities with more than 5,000 residents.
Summary
Summary: Asian Populations Across Mississippi
If you’re looking for a breakdown of Asian populations across Mississippi according to the most recent data, this is an accurate list.
The most Asian cities in Mississippi are D’Iberville, Madison, Ocean Springs, Clinton, Starkville, Flowood, Biloxi, Ridgeland, Richland, and Oxford.


