Most Asian cities in Wisconsin research summary. We analyzed Wisconsin’s most recent Census data to determine the most Asian cities in Wisconsin based on the percentage of Asian residents.
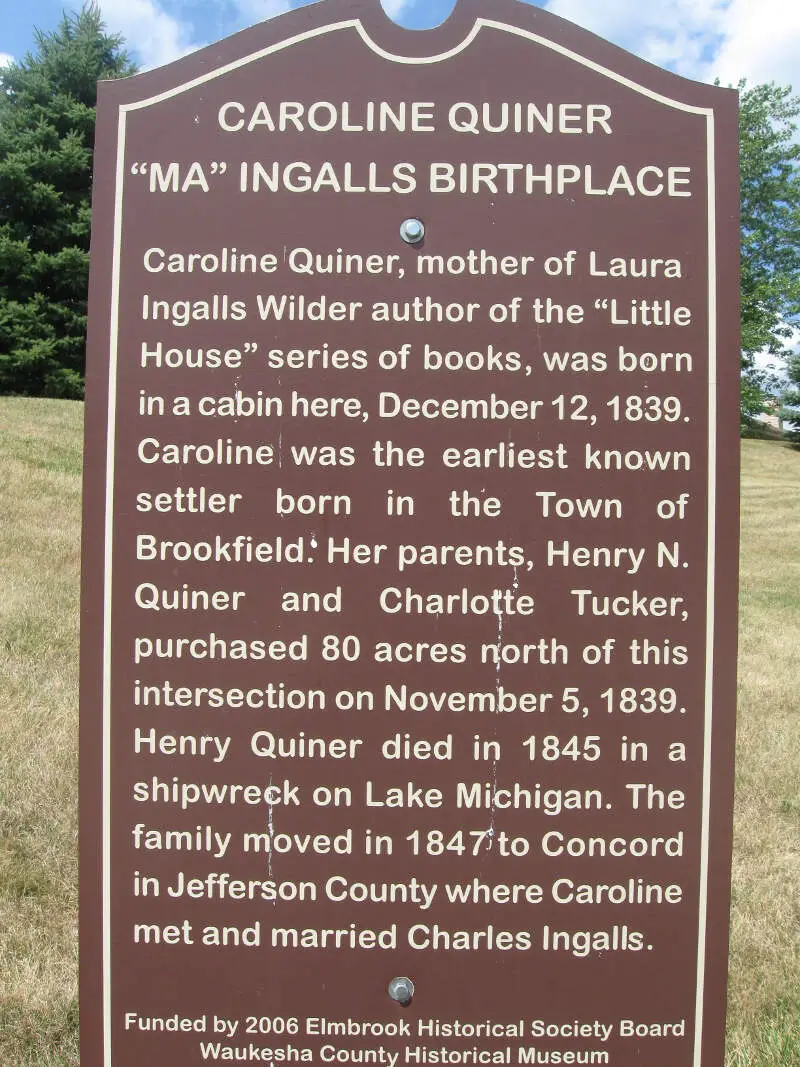
11.2% Asian · #1 most Asian in Wisconsin
Brookfield is a city located in Waukesha County, Wisconsin, United States. It had a population of 37,920 in the 2010 census. Brookfield is the third largest city in Waukesha County.
Data | Crime | Cost of living | Movers
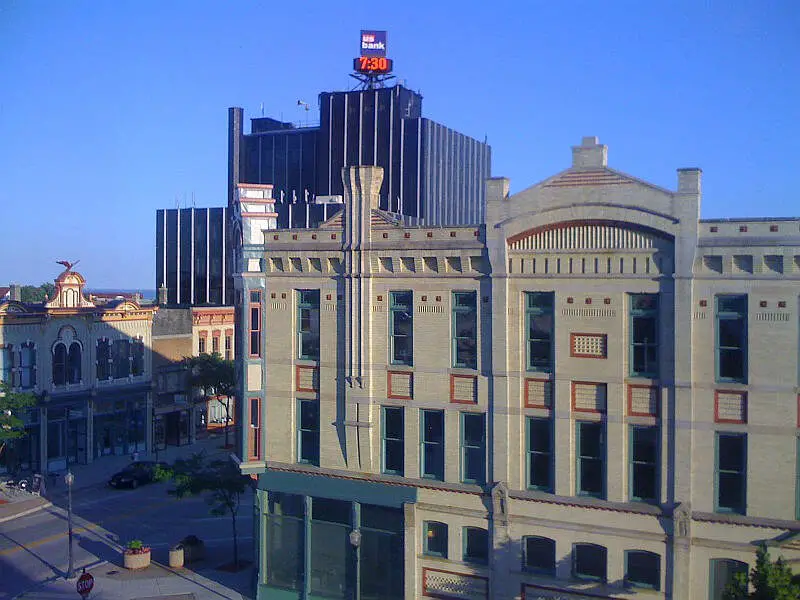
11.1% Asian · #2 most Asian in Wisconsin
Sheboygan is a city in and the county seat of Sheboygan County, Wisconsin, United States. The population was 49,288 at the 2010 census. It is the principal city of the Sheboygan, Wisconsin Metropolitan Statistical Area. The city is located on the western shore of Lake Michigan at the mouth of the Sheboygan River, about 50mi north of Milwaukee and 64mi south of Green Bay.
Data | Crime | Cost of living | Movers
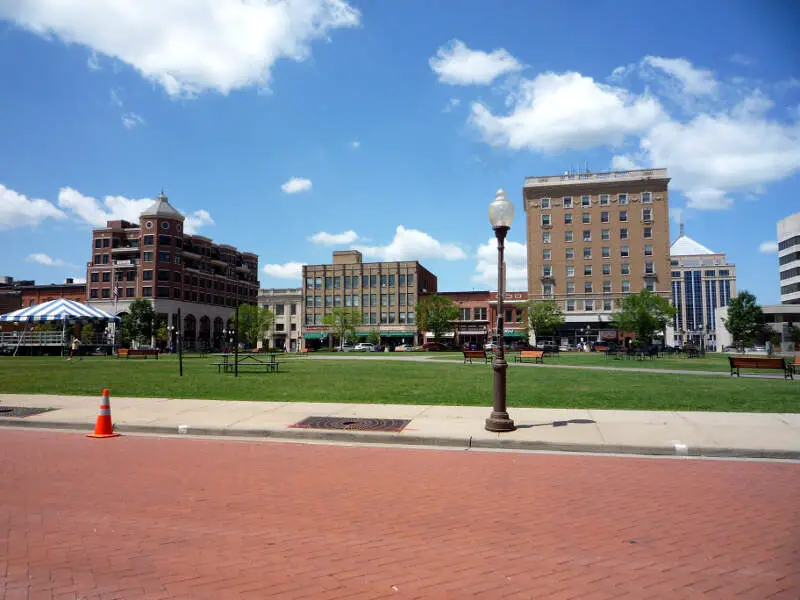
10.4% Asian · #3 most Asian in Wisconsin
Wausau is a city in and the county seat of Marathon County, Wisconsin, United States. The Wisconsin River divides the city into east and west. The city is adjacent to the Town of Wausau.
Data | Crime | Cost of living | Movers
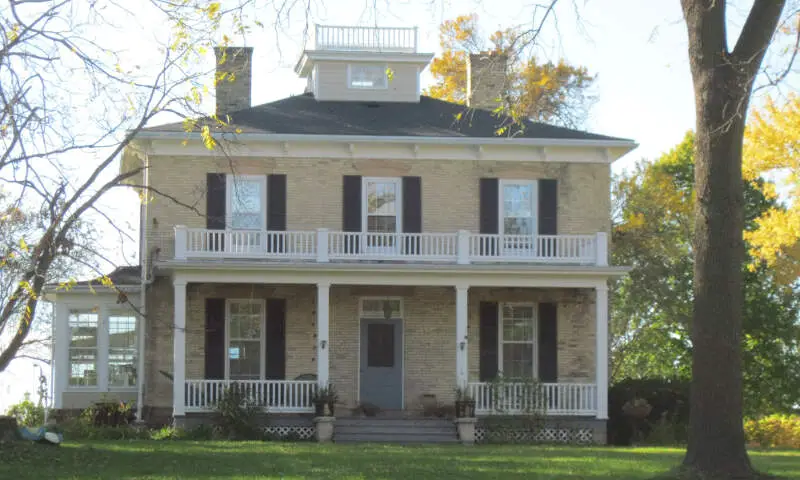
9.9% Asian · #4 most Asian in Wisconsin
Fitchburg is a city in Dane County, Wisconsin, United States. The population was 25,260 at the 2010 census. Fitchburg is a suburb of Madison and is part of the Madison Metropolitan Statistical Area. Fitchburg consists of a mix of suburban neighborhoods closer the border with the city of Madison, commercial and industrial properties, and more rural properties in the southern portion of the city. Despite its status as an incorporated city, some rural parts of Fitchburg still lack certain municipal services such as sewer, water, and natural gas.
Data | Crime | Cost of living | Movers

8.6% Asian · #5 most Asian in Wisconsin
Sun Prairie is a city in Dane County in the U.S. state of Wisconsin. A suburb of Madison, it is part of the Madison Metropolitan Statistical Area. The city’s population was 29,441 at the 2010 U.S. Census. It is the second most populous city in Dane County after Madison.
Data | Crime | Cost of living | Movers
8.0% Asian · #6 most Asian in Wisconsin
Sussex is a village in Waukesha County, Wisconsin, United States. It is approximately 19 miles northwest of Milwaukee and 9 miles north of Waukesha. The village is 7.24 square miles at an elevation of 930 feet. The population was 10,518 at the 2010 census. It is part of the Milwaukee metropolitan area.
Data | Crime | Cost of living | Movers
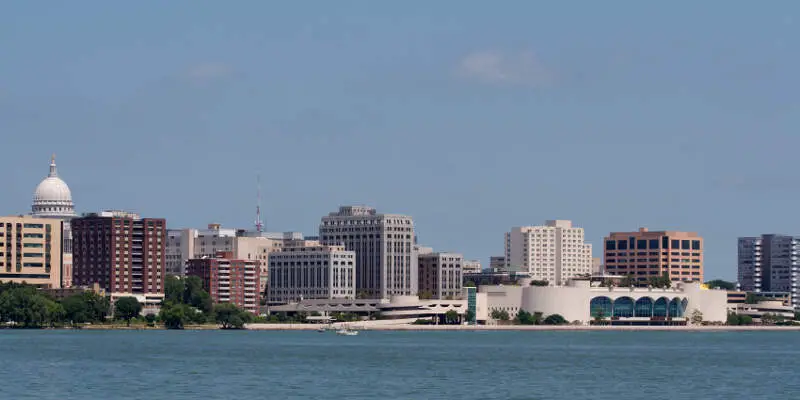
8.0% Asian · #7 most Asian in Wisconsin
Madison is the capital of the U.S. state of Wisconsin and the seat of Dane County. As of July 1, 2016, Madison’s estimated population of 252,551 made it the second-largest city in Wisconsin, after Milwaukee, and the 82nd-largest in the United States. The city forms the core of the United States Census Bureau’s Madison Metropolitan Statistical Area, which includes Dane County and neighboring Iowa, Green, and Columbia counties. The Madison Metropolitan Statistical Area’s 2010 population was 568,593.
Data | Crime | Cost of living | Movers
7.7% Asian · #8 most Asian in Wisconsin
Weston is a village in Marathon County, Wisconsin, United States. It is part of the Wausau Metropolitan Statistical Area. The population was 14,868 at the 2010 census.
Data | Crime | Cost of living | Movers
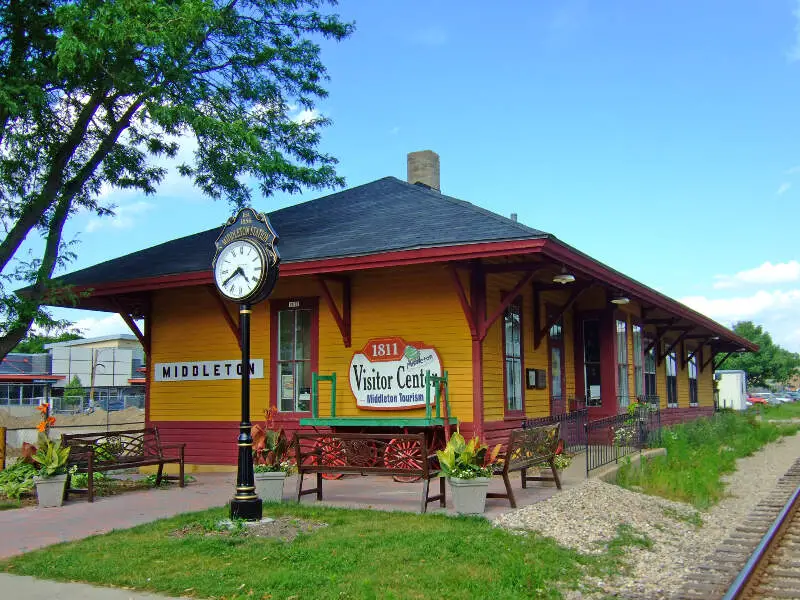
7.3% Asian · #9 most Asian in Wisconsin
Middleton is a city in Dane County, Wisconsin, United States, and a suburb of the state capital, Madison. Middleton’s motto is “The Good Neighbor City.” The population was 17,442 at the 2010 census.
Data | Crime | Cost of living | Movers
7.2% Asian · #10 most Asian in Wisconsin
Greenfield is a city in Milwaukee County, Wisconsin, United States. A suburb of Milwaukee, Greenfield is one of many bedroom communities in the Milwaukee metropolitan area. The population was 36,720 at the 2010 census.
Data | Crime | Cost of living | Movers
The receipts
Compare the top ten
Pick a metric. The bars rescale. The red line is Wisconsin’s statewide median.
On the map
Where Wisconsin’s Asian communities live
Saturday Night Science
Methodology: How We Determined The Cities In Wisconsin With The Largest Asian Population For 2026
We used Saturday Night Science to compare Census data on race across every place in Wisconsin.
The Census’s most recently available data comes from the 2020-2024 American Community Survey.
Specifically, we looked at table B03002: Hispanic OR LATINO ORIGIN BY RACE. Here are the category names as defined by the Census:
- Hispanic or Latino
- White alone*
- Black or African American alone*
- American Indian and Alaska Native alone*
- Asian alone*
- Native Hawaiian and Other Pacific Islander alone*
- Some other race alone*
- Two or more races*
Our particular column of interest here was the number of people who identified as Asian alone.
We limited our analysis to cities with a population greater than 5,000 people. That left us with 137 cities.
We then calculated the percentage of residents that are Asian. The percentages ranked from 11.2% to 0.0%.
Finally, we ranked each city based on the percentage of Asian population, with a higher percentage being more Asian. Brookfield took the distinction of being the most Asian, while Mayville was the least Asian city.
We updated this article for 2026. This report reflects our eleventh time ranking the cities in Wisconsin with the largest Asian population.
The full plate
Cities In Wisconsin By Asian Population
Click any column to sort. Search by city name.
| Rank | City | Population | Asian Population | % Asian |
|---|---|---|---|---|
| 1 | Brookfield | 41,273 | 4,609 | 11.2% |
| 2 | Sheboygan | 49,645 | 5,500 | 11.1% |
| 3 | Wausau | 39,996 | 4,161 | 10.4% |
| 4 | Fitchburg | 32,619 | 3,243 | 9.9% |
| 5 | Sun Prairie | 37,570 | 3,242 | 8.6% |
| 6 | Sussex | 12,066 | 965 | 8.0% |
| 7 | Madison | 278,001 | 22,178 | 8.0% |
| 8 | Weston | 15,749 | 1,207 | 7.7% |
| 9 | Middleton | 22,301 | 1,620 | 7.3% |
| 10 | Greenfield | 37,345 | 2,705 | 7.2% |
| 11 | Brown Deer | 12,564 | 873 | 6.9% |
| 12 | Glendale | 13,656 | 930 | 6.8% |
| 13 | Appleton | 75,023 | 4,961 | 6.6% |
| 14 | Holmen | 11,372 | 728 | 6.4% |
| 15 | New Berlin | 40,270 | 2,528 | 6.3% |
| 16 | Ashwaubenon | 17,314 | 1,061 | 6.1% |
| 17 | Cottage Grove | 8,513 | 519 | 6.1% |
| 18 | Oak Creek | 37,325 | 2,260 | 6.1% |
| 19 | Fox Point | 6,683 | 404 | 6.0% |
| 20 | Franklin | 35,886 | 2,125 | 5.9% |
| 21 | Germa | 20,962 | 1,177 | 5.6% |
| 22 | Menomonee Falls | 39,539 | 2,208 | 5.6% |
| 23 | Shorewood | 13,627 | 751 | 5.5% |
| 24 | Eau Claire | 70,322 | 3,780 | 5.4% |
| 25 | Onalaska | 19,348 | 1,032 | 5.3% |
| 26 | Kronenwetter | 8,395 | 433 | 5.2% |
| 27 | Milwaukee | 566,973 | 28,556 | 5.0% |
| 28 | Lake Hallie | 7,285 | 365 | 5.0% |
| 29 | Sheboygan Falls | 8,547 | 426 | 5.0% |
| 30 | Green Bay | 106,253 | 5,186 | 4.9% |
| 31 | Manitowoc | 34,620 | 1,633 | 4.7% |
| 32 | McFarland | 9,160 | 421 | 4.6% |
| 33 | Wauwatosa | 48,529 | 2,229 | 4.6% |
| 34 | Rothschild | 5,600 | 257 | 4.6% |
| 35 | Whitefish Bay | 14,665 | 673 | 4.6% |
| 36 | Mequon | 25,270 | 1,111 | 4.4% |
| 37 | Mukwonago | 8,415 | 369 | 4.4% |
| 38 | La Crosse | 51,356 | 2,239 | 4.4% |
| 39 | Oshkosh | 66,729 | 2,876 | 4.3% |
| 40 | Plover | 13,884 | 587 | 4.2% |
| 41 | Pewaukee | 16,211 | 677 | 4.2% |
| 42 | Greendale | 14,594 | 608 | 4.2% |
| 43 | Hartland | 9,972 | 413 | 4.1% |
| 44 | Fond du Lac | 44,494 | 1,588 | 3.6% |
| 45 | Whitewater | 15,807 | 487 | 3.1% |
| 46 | Hales Corners | 7,689 | 236 | 3.1% |
| 47 | Stevens Point | 25,785 | 783 | 3.0% |
| 48 | Pleasant Prairie | 21,669 | 656 | 3.0% |
| 49 | Menasha | 18,273 | 529 | 2.9% |
| 50 | Monona | 8,527 | 242 | 2.8% |
| 51 | Bellevue | 16,442 | 458 | 2.8% |
| 52 | Menomonie | 16,539 | 456 | 2.8% |
| 53 | Little Chute | 11,754 | 323 | 2.7% |
| 54 | West Allis | 59,612 | 1,615 | 2.7% |
| 55 | De Pere | 25,301 | 680 | 2.7% |
| 56 | Neenah | 27,336 | 725 | 2.7% |
| 57 | Waukesha | 71,233 | 1,873 | 2.6% |
| 58 | Marshfield | 18,700 | 475 | 2.5% |
| 59 | Mount Pleasant | 27,953 | 707 | 2.5% |
| 60 | Pewaukee | 8,196 | 204 | 2.5% |
| 61 | Berlin | 5,562 | 131 | 2.4% |
| 62 | Wisconsin Rapids | 18,722 | 438 | 2.3% |
| 63 | Verona | 15,232 | 349 | 2.3% |
| 64 | Burlington | 10,987 | 240 | 2.2% |
| 65 | Kimberly | 7,447 | 156 | 2.1% |
| 66 | Cudahy | 17,853 | 364 | 2.0% |
| 67 | Sturtevant | 6,772 | 138 | 2.0% |
| 68 | DeForest | 11,501 | 230 | 2.0% |
| 69 | Delafield | 7,202 | 142 | 2.0% |
| 70 | Mount Horeb | 7,736 | 152 | 2.0% |
| 71 | Kenosha | 99,372 | 1,910 | 1.9% |
| 72 | Kaukauna | 17,706 | 329 | 1.9% |
| 73 | Hobart | 10,610 | 195 | 1.8% |
| 74 | Platteville | 11,499 | 210 | 1.8% |
| 75 | Elm Grove | 6,459 | 104 | 1.6% |
| 76 | Cedarburg | 12,605 | 202 | 1.6% |
| 77 | Janesville | 66,030 | 1,038 | 1.6% |
| 78 | Hudson | 14,959 | 234 | 1.6% |
| 79 | Waunakee | 15,687 | 244 | 1.6% |
| 80 | Edgerton | 6,014 | 90 | 1.5% |
| 81 | Caledonia | 25,257 | 359 | 1.4% |
| 82 | St. Francis | 9,004 | 127 | 1.4% |
| 83 | Beaver Dam | 16,565 | 215 | 1.3% |
| 84 | South Milwaukee | 20,442 | 265 | 1.3% |
| 85 | Oregon | 11,547 | 145 | 1.3% |
| 86 | Ashland | 7,902 | 99 | 1.3% |
| 87 | Monroe | 10,587 | 132 | 1.2% |
| 88 | Waupun | 11,174 | 136 | 1.2% |
| 89 | River Falls | 16,719 | 202 | 1.2% |
| 90 | Richfield | 11,755 | 133 | 1.1% |
| 91 | Hartford | 15,821 | 176 | 1.1% |
| 92 | Grafton | 12,445 | 137 | 1.1% |
| 93 | Superior | 26,677 | 289 | 1.1% |
| 94 | Elkhorn | 10,221 | 110 | 1.1% |
| 95 | Altoona | 8,878 | 95 | 1.1% |
| 96 | Richland Center | 5,109 | 54 | 1.1% |
| 97 | Two Rivers | 11,231 | 118 | 1.1% |
| 98 | Howard | 21,087 | 220 | 1.0% |
| 99 | Portage | 10,236 | 95 | 0.9% |
| 100 | West Bend | 32,030 | 289 | 0.9% |
Source: U.S. Census ACS 2020-2024. 137 cities with more than 5,000 residents.
Summary
Summary: Asian Populations Across Wisconsin
If you’re looking for a breakdown of Asian populations across Wisconsin according to the most recent data, this is an accurate list.
The most Asian cities in Wisconsin are Brookfield, Sheboygan, Wausau, Fitchburg, Sun Prairie, Sussex, Madison, Weston, Middleton, and Greenfield.