Racial diversity in Arkansas is a mixed bag.
There are parts of Arkansas where there’s a high level of diversity. But where will you find the most diverse places in Arkansas?
To answer that question, we went to the US Census data. Using Saturday Night Science, we measured the Gini coefficient for all 68 cities in Arkansas to rank them from most to least diverse.
#1 most diverse in Arkansas
Springdale is the fourth-largest city in Arkansas. It is located in both Washington and Benton counties in Northwest Arkansas. Located on the Springfield Plateau deep in the Ozark Mountains, Springdale has long been an important industrial city for the region. In addition to several trucking companies, the city is home to the world headquarters of Tyson Foods, the world’s largest meat producing company. Originally named Shiloh, the city changed its name to Springdale when applying for a post office in 1872. The four-county Northwest Arkansas Metropolitan Statistical Area is ranked 109th in terms of population in the United States with 463,204 in 2010 according to the United States Census Bureau. The city had a population of 69,797 at the 2010 Census.
Data | Crime | Cost of living | Movers
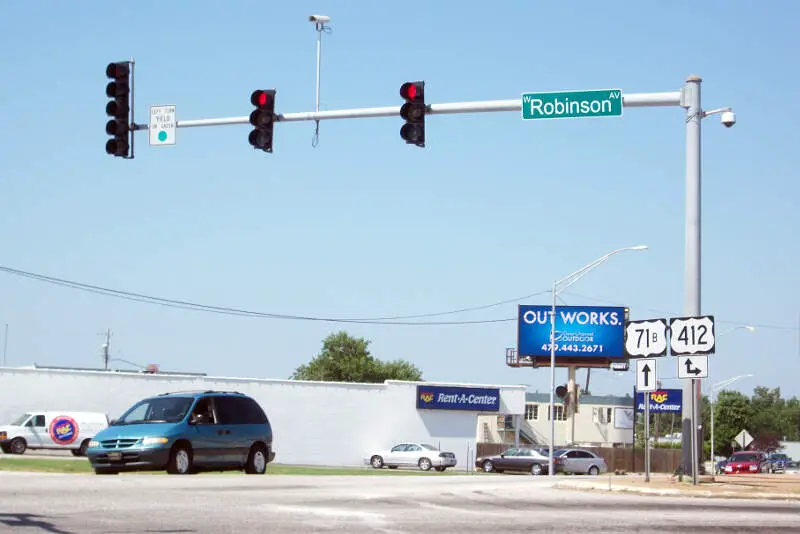
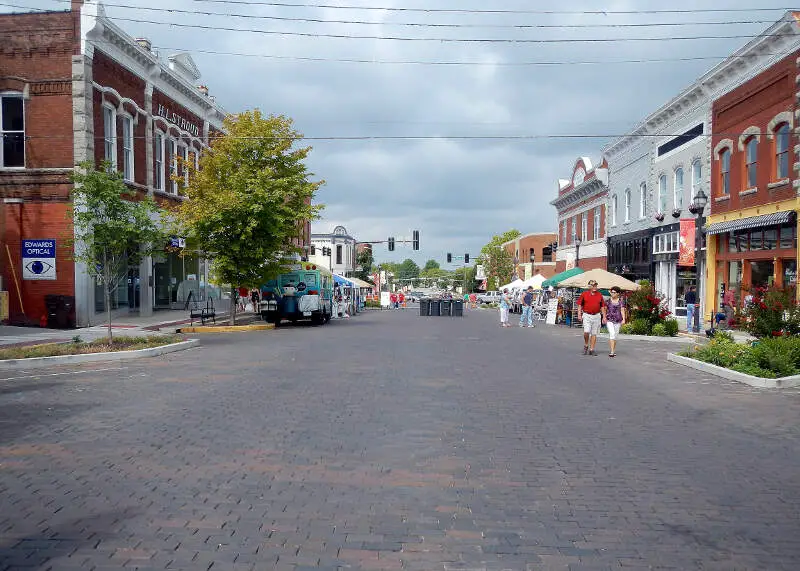
#2 most diverse in Arkansas
Siloam Springs is a city in Benton County, Arkansas, United States. The city shares a border on the Arkansas-Oklahoma state line with the city of West Siloam Springs, Oklahoma, which is within the Cherokee Nation territory. The town was founded in 1882 and was characterized by the purported healing powers of the spring water feeding Sager Creek and trading with nearby Native American tribes. John Brown University was founded in 1919 as a private, interdenominational, Christian liberal arts college in the city. Today, Siloam Springs is known for its efforts to preserve and revitalize the city’s historic downtown and as a promoter of the arts via Sager Creek Arts Center and the JBU art gallery. The community is located on the western edge of the growing Northwest Arkansas metropolitan area and has had a population increase of 47% to 15,039 between the 2000 and 2010 censuses.
Data | Crime | Cost of living | Movers
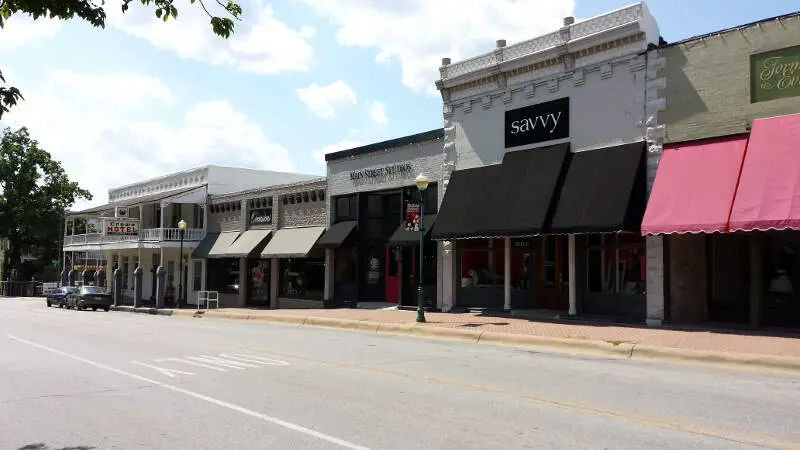
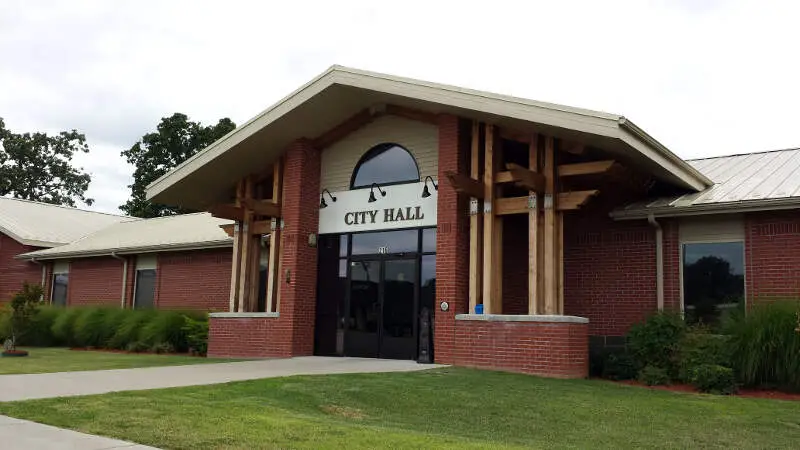
#3 most diverse in Arkansas
Warren is a city in and the county seat of Bradley County, Arkansas, United States. As of the 2010 census, the population was 6,003.
Data | Crime | Cost of living | Movers
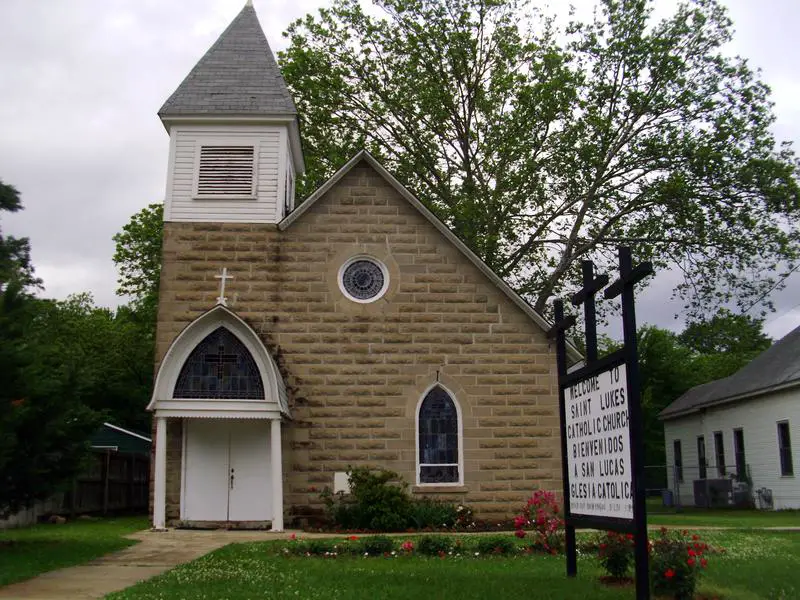
#4 most diverse in Arkansas
Hope is a city in Hempstead County in southwestern Arkansas, United States. Hope is the county seat of Hempstead County and the principal city of the Hope Micropolitan Statistical Area, which includes all of Hempstead and Nevada counties. As of the 2010 census the population was 10,095, and in 2015 the population was estimated at 9,891.
Data | Crime | Cost of living | Movers
#5 most diverse in Arkansas
Lowell is a city in Benton County, Arkansas, in the United States. Located within the Ozarks, first settlement was along Old Wire Road in the 1840s, and although destroyed during the Civil War, the community was reestablished by J. H. McClure and thrived when the St. Louis–San Francisco Railway came through the area in the 1880s. Today, the city is a growing bedroom community within the rapidly growing Northwest Arkansas region. Lowell is also home to the headquarters of trucking company J.B. Hunt.
Data | Crime | Cost of living | Movers
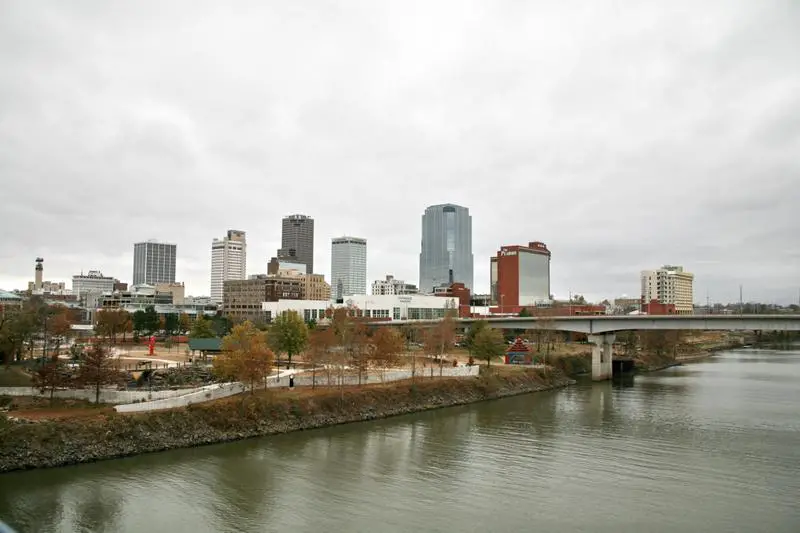
#6 most diverse in Arkansas
Little Rock is the capital and most populous city of the U.S. state of Arkansas. It is also the county seat of Pulaski County. It was incorporated on November 7, 1831, on the south bank of the Arkansas River close to the state’s geographic center. The city derives its name from a rock formation along the river, named “la petite roche” by the French explorer Jean-Baptiste Bnard de la Harpe in the 1720s. The capital of the Arkansas Territory was moved to Little Rock from Arkansas Post in 1821. The city’s population was 193,524 at the 2010 census. The six county Little Rock-North Little Rock-Conway, AR Metropolitan Statistical Area is ranked 75th in terms of population in the United States with 724,385 residents according to the 2013 estimate by the United States Census Bureau.
Data | Crime | Cost of living | Movers
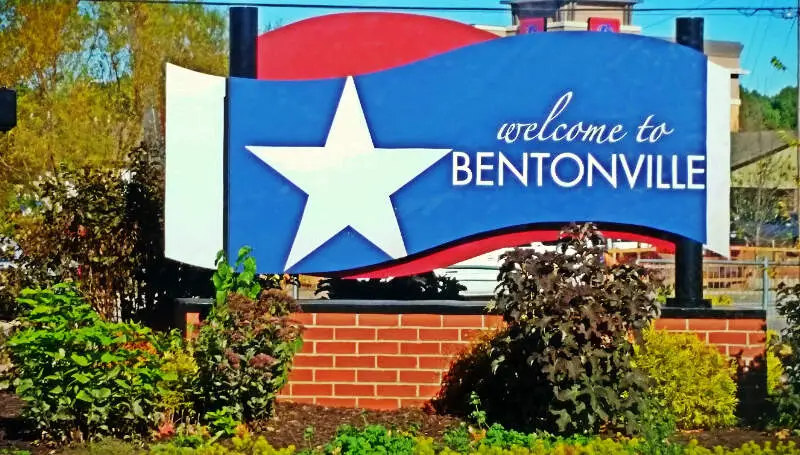
#7 most diverse in Arkansas
Bentonville is the ninth-largest city in Arkansas and the county seat of Benton County. The city is centrally located in the county with Rogers adjacent to the east. The city is the headquarters of Walmart, which is the world’s largest retailer. Originally named Osage after the Osage Indians who hunted in the area when white settlers first moved to the area in 1837, the community was renamed to Bentonville in 1906 in honor of New York inventor Linn Boyd Benton, after being first incorporated on April 3, 1873. It is one of the four main cities in the four-county Northwest Arkansas Metropolitan Statistical Area, which is ranked 109th in terms of population in the United States with 463,204 in 2010 according to the United States Census Bureau. The city itself had a population of 35,301 at the 2010 Census, with an estimated population of 47,093 in 2016.
Data | Crime | Cost of living | Movers
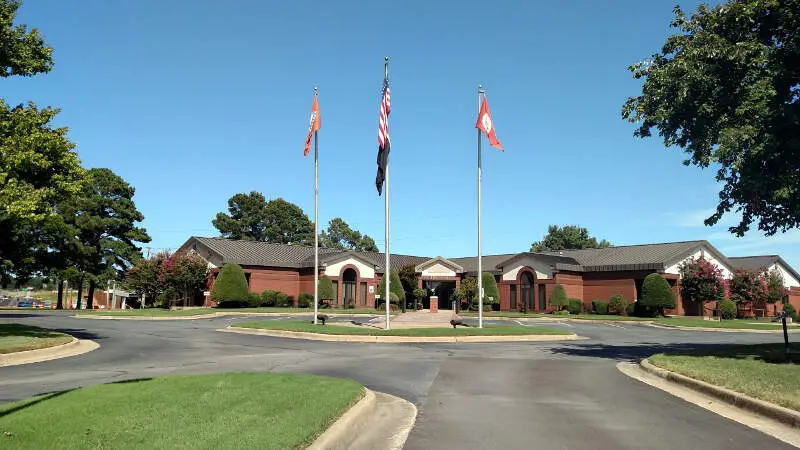
#8 most diverse in Arkansas
Data | Crime | Cost of living | Movers
#9 most diverse in Arkansas
Rogers is a city in Benton County, Arkansas, United States. As of the 2010 census, the city has a population of 55,964 making it the state’s-eighth largest city. Rogers is located in the northwest portion of the state in the Fayetteville-Springdale-Rogers Metropolitan Area, which is one of the fastest growing areas in the nation and is ranked 109th in terms of population in the United States with 465,776 in 2010 according to the United States Census Bureau.
Data | Crime | Cost of living | Movers
#10 most diverse in Arkansas
North Little Rock is a city in Pulaski County, Arkansas, United States, across the Arkansas River from Little Rock in the central part of the state. The population was 62,304 at the 2010 census. North Little Rock, along with Little Rock and Conway, anchors the six-county Little Rock-North Little Rock-Conway Metropolitan Statistical Area, which is further included in the Little Rock-North Little Rock Combined Statistical Area with 902,443 residents.
Data | Crime | Cost of living | Movers
The receipts
Compare the top ten
Pick a metric. The bars rescale. The red line is Arkansas’s statewide median.
On the map
Where diversity lives in Arkansas
Saturday Night Science
Methodology: How we determined the most diverse cities in Arkansas for 2026
We still believe in the accuracy of data — especially from the Census — and Saturday Night Science. So that’s where we went to get the race breakdown across Arkansas.
That leads us to the Census’s most recently available data, the 2020-2024 American Community Survey data from the US Census.
Specifically, we looked at table B03002: HISPANIC OR LATINO ORIGIN BY RACE. Here are the category names as defined by the Census:
- White alone*
- Black or African American alone*
- American Indian and Alaska Native alone*
- Asian alone*
- Native Hawaiian and Other Pacific Islander alone*
- Some other race alone*
- Two or more races*
- Hispanic or Latino
We limited our analysis to non-CDPs with a population greater than 5,000 people. That left us with 68 cities.
We then calculated the HHI for each city by finding the racial breakdown of a city in percent terms, squaring them, and then adding the squares together. This left us with scores ranging from 3,119 (Springdale) to 8,710 (Beebe).
Finally, we ranked each city based on the HHI, with a lower score being more diverse than a high score. Springdale took the distinction of being the most diverse, while Beebe was the least diverse city.
We updated this article for 2026. This report is our eleventh time ranking the most diverse places in Arkansas.
The full plate
Race By City In Arkansas For 2026
Click any column to sort. Search by city name.
| Rank | City | Population | HHI | % White | % Black | % Hispanic | % Asian |
|---|---|---|---|---|---|---|---|
| 1 | Springdale | 88,160 | 3,119 | 34.3% | 2.1% | 42.1% | 2.4% |
| 2 | Siloam Springs | 18,699 | 3,129 | 44.6% | 1.6% | 25.3% | 3.6% |
| 3 | Warren | 5,353 | 3,263 | 30.0% | 43.7% | 20.6% | 0.0% |
| 4 | Hope | 8,671 | 3,335 | 32.0% | 44.0% | 18.6% | 0.7% |
| 5 | Lowell | 10,849 | 3,470 | 49.4% | 1.4% | 28.5% | 1.7% |
| 6 | Little Rock | 203,436 | 3,531 | 42.7% | 39.7% | 10.6% | 3.0% |
| 7 | Bentonville | 58,249 | 3,609 | 55.1% | 3.4% | 10.3% | 13.1% |
| 8 | Jacksonville | 29,221 | 3,685 | 35.2% | 48.4% | 7.9% | 1.7% |
| 9 | Rogers | 72,981 | 3,707 | 49.0% | 1.0% | 33.9% | 2.7% |
| 10 | North Little Rock | 64,538 | 3,860 | 43.1% | 44.0% | 7.0% | 0.7% |
| 11 | Berryville | 5,707 | 3,895 | 55.1% | 0.5% | 22.8% | 0.2% |
| 12 | Fort Smith | 89,805 | 3,943 | 58.1% | 7.0% | 20.5% | 5.3% |
| 13 | Centerton | 21,920 | 3,966 | 58.9% | 5.7% | 13.6% | 6.0% |
| 14 | Wynne | 8,120 | 4,042 | 57.2% | 25.9% | 3.8% | 5.8% |
| 15 | El Dorado | 17,115 | 4,049 | 40.4% | 48.7% | 5.5% | 1.7% |
| 16 | Magnolia | 10,894 | 4,071 | 47.4% | 42.1% | 5.7% | 0.2% |
| 17 | Osceola | 6,688 | 4,168 | 31.1% | 55.8% | 6.5% | 0.0% |
| 18 | Marion | 13,623 | 4,169 | 51.3% | 38.7% | 3.5% | 1.3% |
| 19 | Texarkana | 29,177 | 4,273 | 54.9% | 34.9% | 4.9% | 0.5% |
| 20 | Pea Ridge | 8,108 | 4,326 | 62.3% | 3.8% | 13.2% | 0.8% |
| 21 | Arkadelphia | 10,099 | 4,333 | 57.9% | 30.3% | 6.4% | 0.6% |
| 22 | Monticello | 8,257 | 4,466 | 52.6% | 41.0% | 0.7% | 1.5% |
| 23 | De Queen | 6,058 | 4,525 | 24.7% | 5.4% | 62.2% | 0.0% |
| 24 | Stuttgart | 7,903 | 4,527 | 52.2% | 42.2% | 2.7% | 0.1% |
| 25 | Blytheville | 12,790 | 4,534 | 33.2% | 58.4% | 3.8% | 1.3% |
| 26 | Camden | 10,307 | 4,554 | 38.6% | 55.2% | 4.2% | 0.7% |
| 26 | Newport | 8,024 | 4,554 | 62.2% | 24.9% | 5.6% | 0.7% |
| 28 | Jonesboro | 80,137 | 4,567 | 63.0% | 22.7% | 7.5% | 1.6% |
| 29 | Clarksville | 9,526 | 4,567 | 63.2% | 3.4% | 22.4% | 6.3% |
| 30 | Batesville | 11,445 | 4,657 | 63.7% | 2.9% | 23.2% | 1.4% |
| 31 | Sherwood | 33,070 | 4,665 | 61.4% | 29.4% | 4.1% | 1.5% |
| 32 | White Hall | 5,512 | 4,734 | 61.4% | 30.6% | 4.5% | 1.7% |
| 33 | Malvern | 10,953 | 4,769 | 61.8% | 30.2% | 2.9% | 0.0% |
| 34 | Hot Springs | 37,920 | 4,818 | 66.6% | 15.6% | 10.8% | 1.2% |
| 35 | West Memphis | 23,929 | 4,826 | 28.3% | 63.2% | 2.9% | 0.6% |
| 36 | Conway | 67,642 | 4,928 | 67.3% | 17.6% | 8.2% | 1.6% |
| 37 | Van Buren | 23,763 | 5,125 | 69.3% | 2.0% | 15.7% | 2.6% |
| 38 | Maumelle | 19,373 | 5,129 | 68.4% | 20.0% | 2.8% | 3.5% |
| 39 | Fayetteville | 99,319 | 5,161 | 70.0% | 4.8% | 9.2% | 2.4% |
| 40 | Cave Springs | 6,008 | 5,261 | 68.3% | 0.3% | 6.6% | 0.8% |
| 41 | Bryant | 21,504 | 5,294 | 70.7% | 14.9% | 7.6% | 2.1% |
| 42 | Russellville | 29,162 | 5,354 | 70.5% | 4.0% | 18.5% | 1.2% |
| 43 | Barling | 5,007 | 5,395 | 71.6% | 2.2% | 13.3% | 8.5% |
| 44 | Tontitown | 6,425 | 5,439 | 72.4% | 2.9% | 6.3% | 4.0% |
| 45 | Helena-West Helena | 8,935 | 5,593 | 20.2% | 71.9% | 2.7% | 1.9% |
| 46 | Prairie Grove | 7,798 | 5,742 | 72.5% | 0.0% | 3.8% | 1.1% |
| 47 | Farmington | 9,094 | 5,753 | 73.9% | 3.4% | 5.8% | 0.3% |
| 48 | Forrest City | 12,646 | 5,806 | 20.8% | 73.1% | 4.8% | 0.2% |
| 49 | Pine Bluff | 39,743 | 6,103 | 16.7% | 76.2% | 2.4% | 0.6% |
| 50 | Benton | 36,595 | 6,209 | 77.7% | 9.9% | 7.7% | 0.9% |
| 51 | Searcy | 23,340 | 6,218 | 77.8% | 10.8% | 5.7% | 1.2% |
| 52 | Morrilton | 7,080 | 6,246 | 77.7% | 12.8% | 3.5% | 0.6% |
| 53 | Ward | 6,573 | 6,634 | 80.6% | 3.1% | 10.1% | 1.6% |
| 54 | Pocahontas | 7,538 | 6,739 | 81.4% | 1.8% | 1.5% | 0.9% |
| 55 | Trumann | 7,410 | 6,832 | 81.9% | 8.2% | 2.6% | 0.0% |
| 56 | Alma | 5,906 | 7,023 | 83.3% | 3.4% | 4.6% | 0.0% |
| 57 | Cabot | 26,960 | 7,223 | 84.6% | 3.1% | 5.4% | 1.3% |
| 58 | Greenwood | 9,616 | 7,342 | 85.2% | 0.5% | 7.7% | 1.6% |
| 59 | Paragould | 30,215 | 7,412 | 85.8% | 3.4% | 5.1% | 0.6% |
| 60 | Sheridan | 5,165 | 8,095 | 89.8% | 3.6% | 2.5% | 0.0% |
| 61 | Cherokee Village | 5,046 | 8,150 | 90.1% | 0.3% | 4.0% | 0.9% |
| 62 | Harrison | 13,350 | 8,219 | 90.4% | 0.3% | 5.9% | 0.1% |
| 63 | Mountain Home | 13,108 | 8,383 | 91.4% | 0.7% | 2.4% | 0.2% |
| 64 | Heber Springs | 7,161 | 8,430 | 91.6% | 0.7% | 2.9% | 0.0% |
| 65 | Walnut Ridge | 5,434 | 8,439 | 91.7% | 1.9% | 1.5% | 0.2% |
| 66 | Mena | 5,582 | 8,475 | 91.9% | 0.1% | 4.3% | 0.0% |
| 67 | Greenbrier | 6,018 | 8,563 | 92.4% | 2.4% | 3.6% | 0.0% |
| 68 | Beebe | 8,707 | 8,710 | 93.2% | 0.7% | 3.0% | 0.4% |
Source: U.S. Census ACS 2020-2024. 68 cities with more than 5,000 residents.
Summary
Summary: Diversity Across Arkansas
If you’re looking for a scientific breakdown of diversity across Arkansas, this is an accurate list.
The most diverse cities in Arkansas are Springdale, Siloam Springs, Warren, Hope, Lowell, Little Rock, Bentonville, Jacksonville, Rogers, and North Little Rock. Not sold on Arkansas? Take the two-minute Find Your Place quiz and see which state actually fits you.
Questions and answers
Most Diverse Cities In Arkansas FAQs
What is the most diverse city in Arkansas?
Springdale is the most diverse city in Arkansas for 2026, posting the lowest diversity index (3,119) of the 68 places we measured. Siloam Springs and Warren are next.
What are the 10 most diverse cities in Arkansas?
The ten most diverse cities in Arkansas are Springdale, Siloam Springs, Warren, Hope, Lowell, Little Rock, Bentonville, Jacksonville, Rogers, and North Little Rock. We ranked all 68 places with more than 5,000 residents by their racial-diversity HHI.
How do you measure diversity?
We use a Herfindahl-Hirschman Index (HHI) across each city’s White, Black, Hispanic, and Asian population shares from the Census American Community Survey. A lower score means the mix is more even, so the lowest HHI wins.
What is the least diverse city in Arkansas?
Beebe is the least diverse city in Arkansas, with a diversity index of 8,710. That means one group makes up most of its population.
Where does this data come from?
All population shares come from the Census Bureau’s American Community Survey (2020-2024). Diversity scores in Arkansas range from 3,119 in Springdale to 8,710 in Beebe.


