Racial diversity in Connecticut is a mixed bag.
There are parts of Connecticut where there’s a high level of diversity. But where will you find the most diverse places in Connecticut?
To answer that question, we went to the US Census data. Using Saturday Night Science, we measured the Gini coefficient for all 21 cities in Connecticut to rank them from most to least diverse.
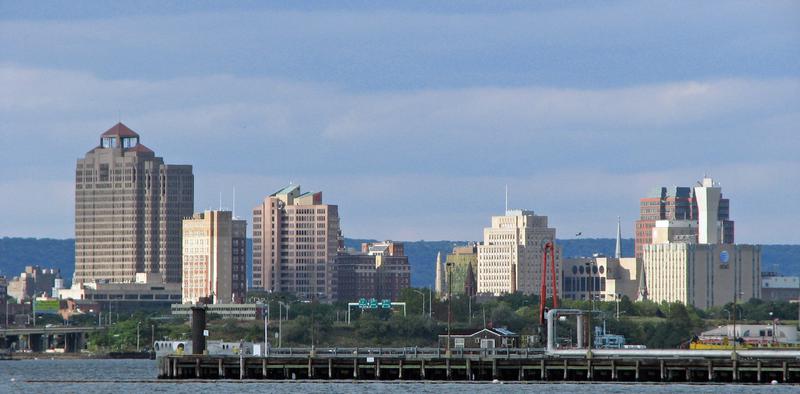
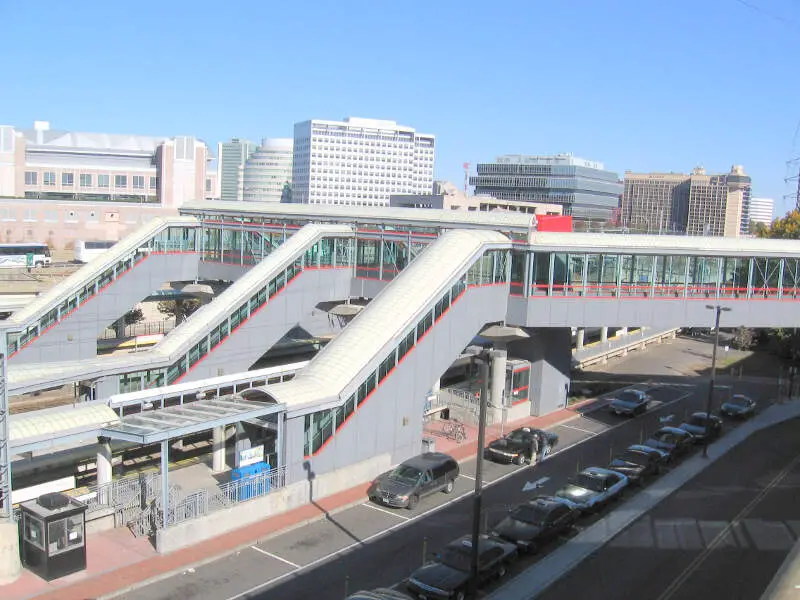
#1 most diverse in Connecticut
New Haven, in the U.S. state of Connecticut, is the principal municipality in Greater New Haven, which had a total population of 862,477 in 2010. It is located on New Haven Harbor on the northern shore of Long Island Sound in New Haven County, Connecticut, and is part of the New York metropolitan area. It is the second-largest city in Connecticut, with a population of 129,779 people as of the 2010 United States Census. According to a census of 1 July 2012, by the Census Bureau, the city had a population of 130,741.
Data | Crime | Cost of living | Movers
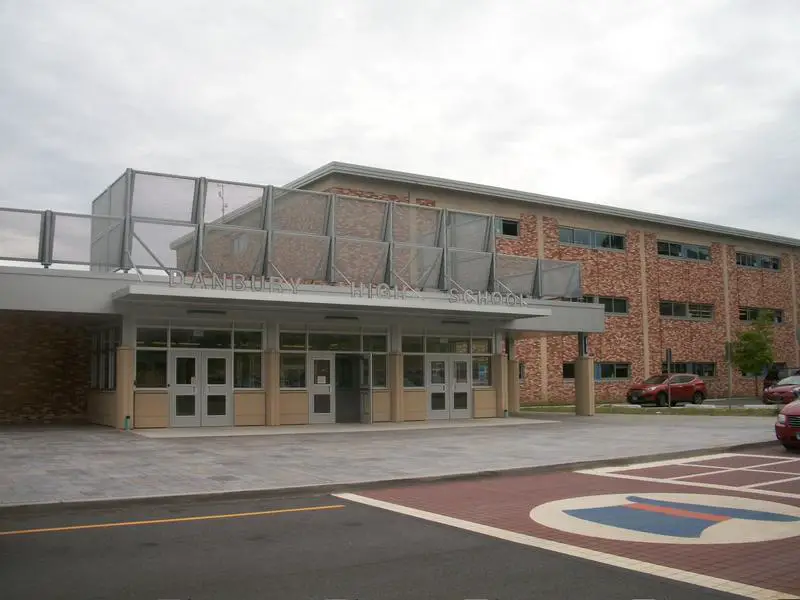
#2 most diverse in Connecticut
Danbury is a city in northern Fairfield County, Connecticut, United States, located along the Still River approximately 70 miles northeast of New York’s city center. Danbury’s population at the 2010 census was 80,893. Danbury is the fourth most populous city in Fairfield County, and seventh among Connecticut cities. The city is within the New York combined statistical area and Bridgeport metropolitan area.
Data | Crime | Cost of living | Movers
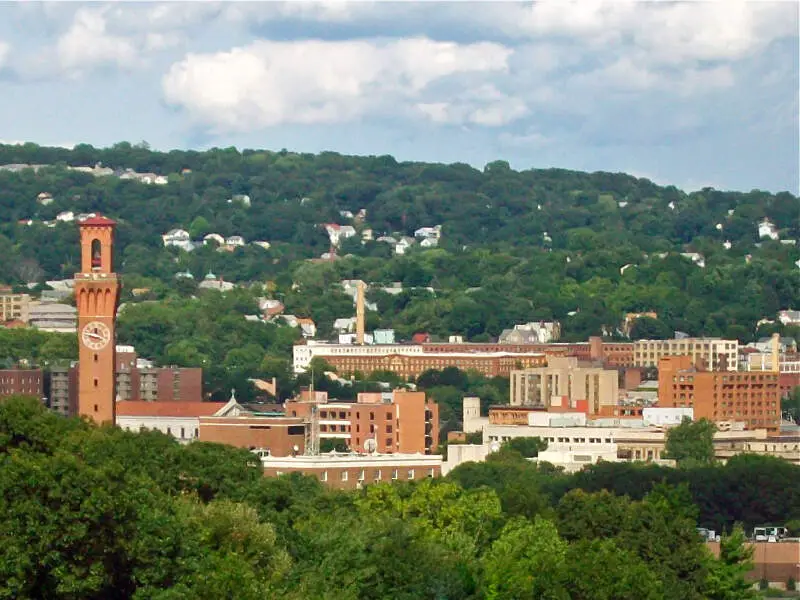
#3 most diverse in Connecticut
Waterbury is a city in the U.S. state of Connecticut on the Naugatuck River, 33 miles southwest of Hartford and 77 miles northeast of New York City. Waterbury is in New Haven County, Connecticut. As of the 2010 census, Waterbury had a population of 110,366, making it the 10th largest city in the New York Metropolitan Area, 9th largest city in New England and the 5th largest city in Connecticut.
Data | Crime | Cost of living | Movers
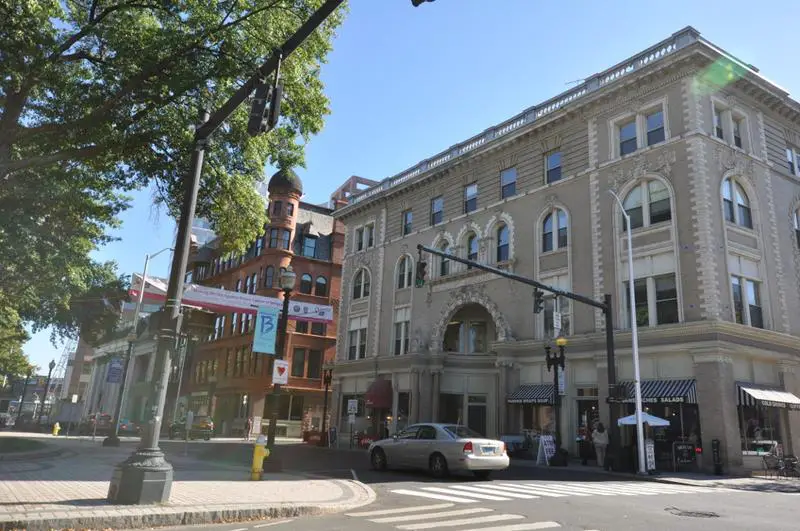
#4 most diverse in Connecticut
Bridgeport is a seaport city in the U.S. state of Connecticut. It is the largest city in the state and is located in Fairfield County at the mouth of the Pequonnock River on Long Island Sound. Bridgeport had a population of 144,229 during the 2010 Census, making it also the 5th-most populous in New England. It is bordered by the towns of Trumbull to the north, Fairfield to the west, and Stratford to the east. The Greater Bridgeport area is the 48th-largest urban area in the United States. Located 60 miles from Manhattan and 40 miles from the Bronx, Bridgeport is also part of the New York metropolitan area.
Data | Crime | Cost of living | Movers
#5 most diverse in Connecticut
Stamford is a city in Fairfield County, Connecticut, United States. According to the 2010 census, the population of the city is 122,643. As of July 1, 2014, according to the Census Bureau, the population of Stamford had risen to 128,278, making it the third-largest city in the state and the seventh-largest city in New England. Approximately 30 miles from Manhattan, Stamford is in the Bridgeport-Stamford-Norwalk Metro area which is a part of the Greater New York metropolitan area.
Data | Crime | Cost of living | Movers
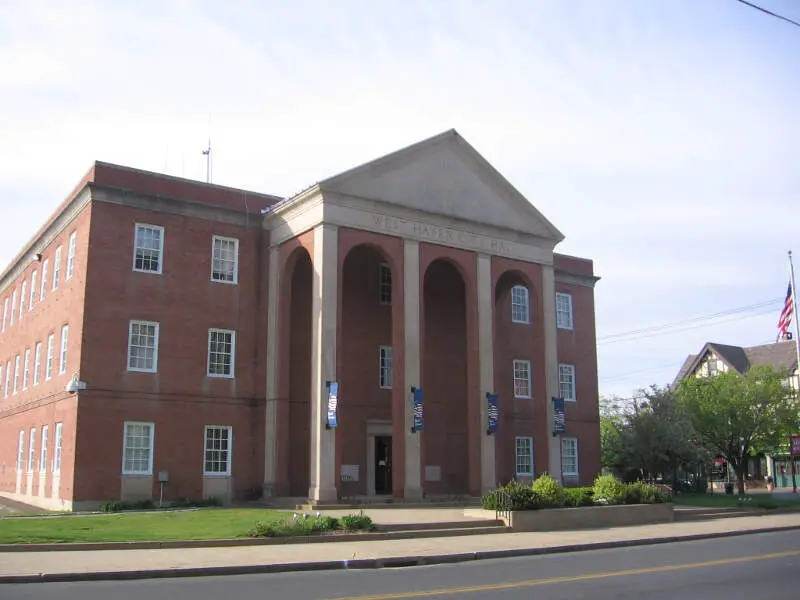
#6 most diverse in Connecticut
West Haven is a city in New Haven County, Connecticut, United States. At the 2010 census, the population of the city was 55,564.
Data | Crime | Cost of living | Movers
#7 most diverse in Connecticut
Norwalk, is a U.S city located in southwestern Connecticut, in southern Fairfield County, on the northern shore of Long Island Sound. Norwalk is included statistically within both the New York-Newark, NY-NJ-CT-PA Combined Statistical Area as well as the Bridgeport-Stamford-Norwalk, CT Metropolitan Statistical Area.
Data | Crime | Cost of living | Movers
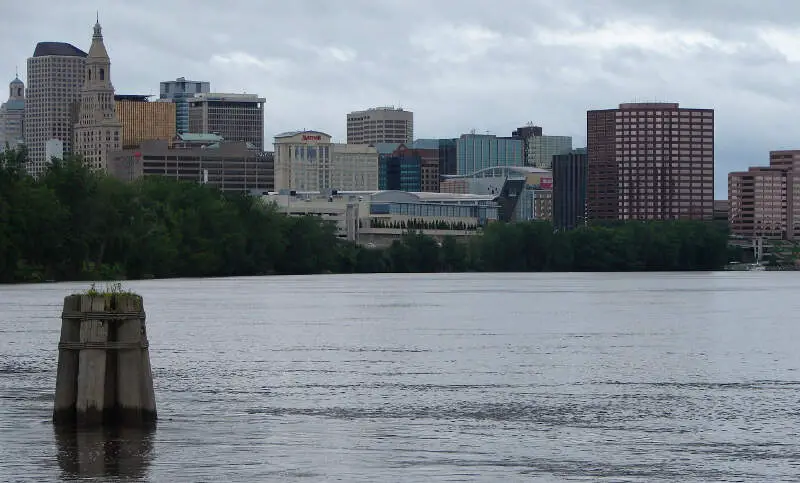
#8 most diverse in Connecticut
Hartford is the capital of the U.S. state of Connecticut. It was the seat of Hartford County until Connecticut disbanded county government in 1960. As of the 2010 Census, Hartford’s population was 124,775, making it Connecticut’s third-largest city after the coastal cities of Bridgeport and New Haven. Census Bureau estimates since then have indicated Hartford’s fall to fourth place statewide, as a result of sustained population growth in the coastal city of Stamford.
Data | Crime | Cost of living | Movers
#9 most diverse in Connecticut
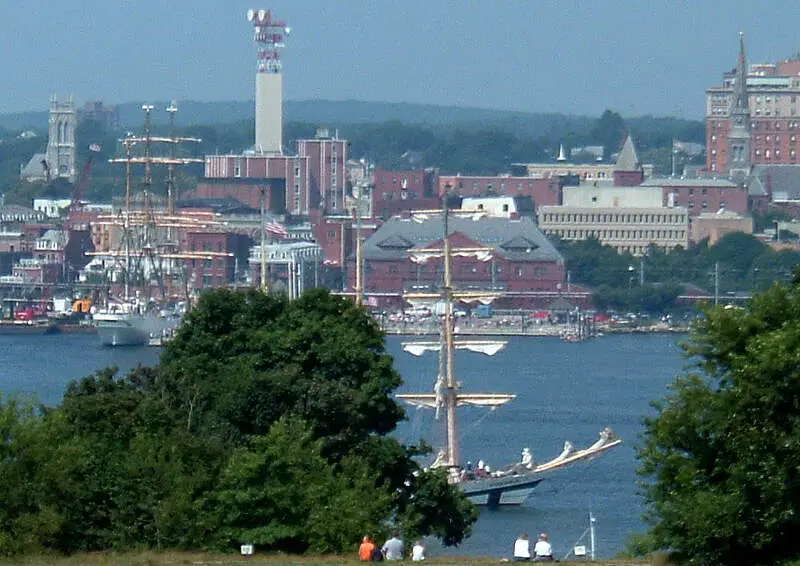
New London is a seaport city and a port of entry on the northeast coast of the United States. It is located at the mouth of the Thames River in New London County, Southeastern Connecticut.
Data | Crime | Cost of living | Movers
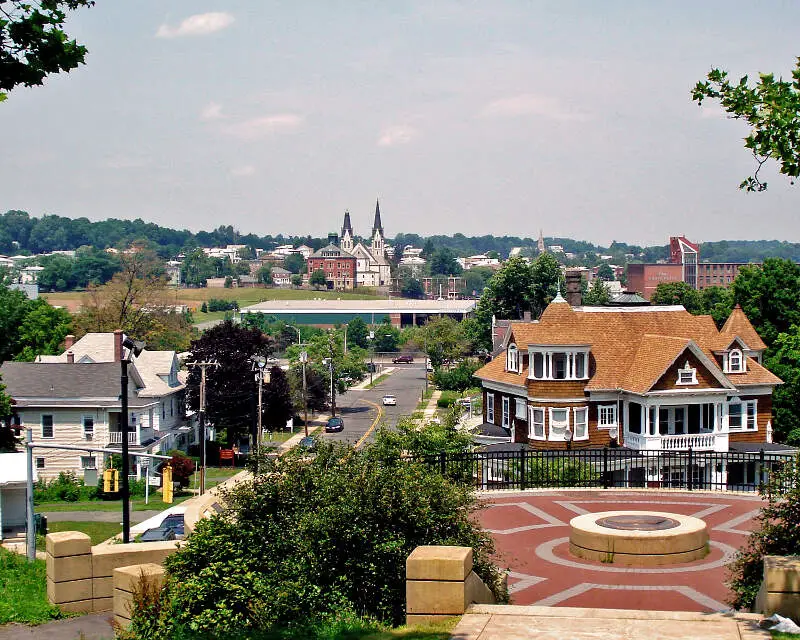
#10 most diverse in Connecticut
New Britain is a city in Hartford County, Connecticut, United States. It is located approximately 9 miles southwest of Hartford. According to 2010 Census, the population of the city is 73,206.
Data | Crime | Cost of living | Movers
The receipts
Compare the top ten
Pick a metric. The bars rescale. The red line is Connecticut’s statewide median.
On the map
Where diversity lives in Connecticut
Saturday Night Science
Methodology: How we determined the most diverse cities in Connecticut for 2026
We still believe in the accuracy of data — especially from the Census — and Saturday Night Science. So that’s where we went to get the race breakdown across Connecticut.
That leads us to the Census’s most recently available data, the 2020-2024 American Community Survey data from the US Census.
Specifically, we looked at table B03002: HISPANIC OR LATINO ORIGIN BY RACE. Here are the category names as defined by the Census:
- White alone*
- Black or African American alone*
- American Indian and Alaska Native alone*
- Asian alone*
- Native Hawaiian and Other Pacific Islander alone*
- Some other race alone*
- Two or more races*
- Hispanic or Latino
We limited our analysis to non-CDPs with a population greater than 9,000 people. That left us with 21 cities.
We then calculated the HHI for each city by finding the racial breakdown of a city in percent terms, squaring them, and then adding the squares together. This left us with scores ranging from 2,677 (New Haven) to 6,547 (Milford).
Finally, we ranked each city based on the HHI, with a lower score being more diverse than a high score. New Haven took the distinction of being the most diverse, while Milford was the least diverse city.
We updated this article for 2026. This report is our eleventh time ranking the most diverse places in Connecticut.
The full plate
Race By City In Connecticut For 2026
Click any column to sort. Search by city name.
| Rank | City | Population | HHI | % White | % Black | % Hispanic | % Asian |
|---|---|---|---|---|---|---|---|
| 1 | New Haven | 134,349 | 2,677 | 30.0% | 27.6% | 31.0% | 5.2% |
| 2 | Danbury | 87,263 | 2,875 | 40.1% | 11.3% | 32.2% | 5.4% |
| 3 | Waterbury | 114,869 | 2,912 | 29.3% | 23.0% | 38.5% | 2.5% |
| 4 | Bridgeport | 149,153 | 3,039 | 24.5% | 19.7% | 44.8% | 4.7% |
| 5 | Stamford | 137,144 | 3,039 | 43.2% | 17.7% | 28.3% | 7.3% |
| 6 | West Haven | 55,351 | 3,067 | 43.5% | 19.7% | 27.4% | 5.3% |
| 7 | Norwalk | 92,187 | 3,166 | 42.7% | 17.0% | 32.0% | 4.3% |
| 8 | Hartford | 121,127 | 3,370 | 15.1% | 33.8% | 44.5% | 2.4% |
| 9 | New London | 27,625 | 3,418 | 44.4% | 12.9% | 35.5% | 2.6% |
| 10 | New Britain | 74,223 | 3,508 | 40.3% | 10.3% | 41.8% | 2.4% |
| 11 | Norwich | 39,973 | 3,676 | 55.0% | 9.6% | 21.9% | 6.9% |
| 12 | Ansonia | 19,033 | 3,729 | 52.6% | 13.1% | 27.7% | 2.0% |
| 13 | Meriden | 60,545 | 3,816 | 47.6% | 7.5% | 38.3% | 2.4% |
| 14 | Derby | 12,487 | 3,974 | 57.6% | 11.3% | 22.4% | 2.5% |
| 15 | Naugatuck | 31,800 | 4,121 | 60.2% | 11.7% | 17.4% | 3.7% |
| 16 | Middletown | 47,958 | 4,329 | 62.7% | 13.3% | 12.6% | 5.9% |
| 17 | Bristol | 61,462 | 4,363 | 61.8% | 7.3% | 21.0% | 4.1% |
| 18 | Shelton | 41,889 | 4,739 | 66.6% | 6.7% | 12.6% | 8.7% |
| 19 | Groton | 9,490 | 4,782 | 67.0% | 8.0% | 12.4% | 6.0% |
| 20 | Torrington | 35,547 | 5,201 | 69.8% | 5.6% | 16.1% | 3.4% |
| 21 | Milford | 51,023 | 6,547 | 80.2% | 3.0% | 9.5% | 3.7% |
Source: U.S. Census ACS 2020-2024. 21 cities with more than 9,000 residents.
Summary
Summary: Diversity Across Connecticut
If you’re looking for a scientific breakdown of diversity across Connecticut, this is an accurate list.
The most diverse cities in Connecticut are New Haven, Danbury, Waterbury, Bridgeport, Stamford, West Haven, Norwalk, Hartford, New London, and New Britain.


