
Racial diversity in North Carolina is a mixed bag.
There are parts of North Carolina where there’s a high level of diversity. But where will you find the most diverse places in North Carolina?
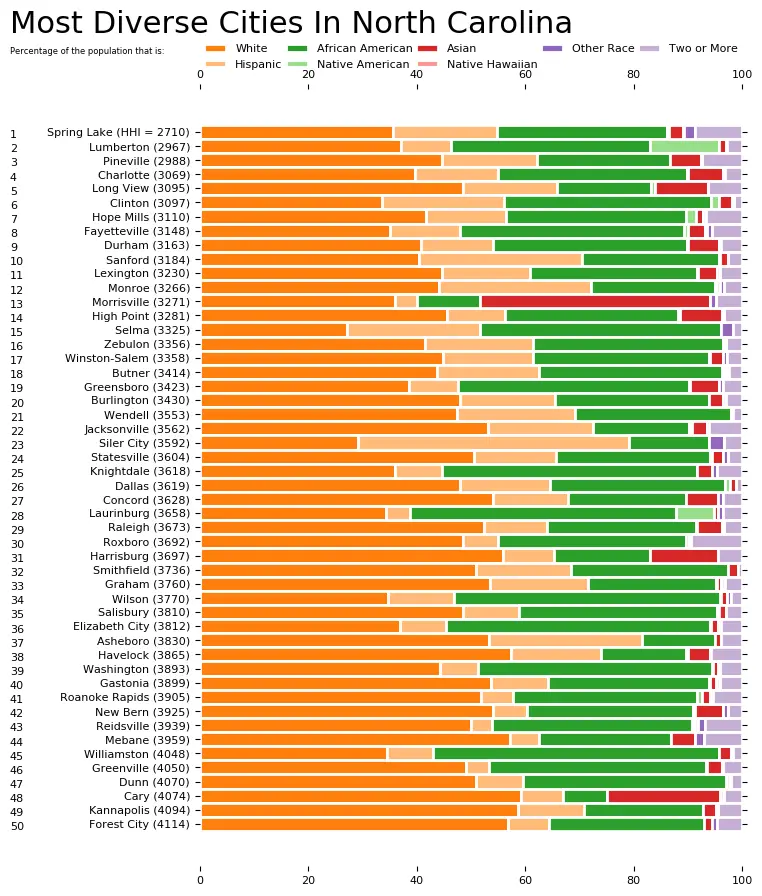
To answer that question, we went to the US Census data. Using Saturday Night Science, we measured the Gini coefficient for all 142 cities in North Carolina to rank them from most to least diverse.
Table Of Contents: Top Ten | Methodology | Summary | Table
Here are the 10 most diverse places in North Carolina for 2026:
So what city is the most diverse in North Carolina? According to the most Census data, Spring Lake took the number one over all spot for diversity in North Carolina.
Read on below to see how we crunched the numbers and how your town ranked. To see where North Carolina ranked as a state, we have a ranking of the most diverse states in Ameria.
For more North Carolina reading:
The 10 Most Diverse Places In North Carolina For 2026

/10
Population: 11,573
HHI: 2,735
% White: 34.0%
% African American: 34.2%
% Hispanic: 17.8%
% Asian: 2.2%
More on Spring Lake: Data | Crime | Cost Of Living | Movers

/10
Population: 18,859
HHI: 2,842
% White: 30.2%
% African American: 40.0%
% Hispanic: 12.6%
% Asian: 1.5%
More on Lumberton: Data | Crime | Cost Of Living | Movers

/10
Population: 11,055
HHI: 2,896
% White: 42.2%
% African American: 16.5%
% Hispanic: 27.6%
% Asian: 4.5%
More on Pineville: Data | Crime | Cost Of Living | Movers

/10
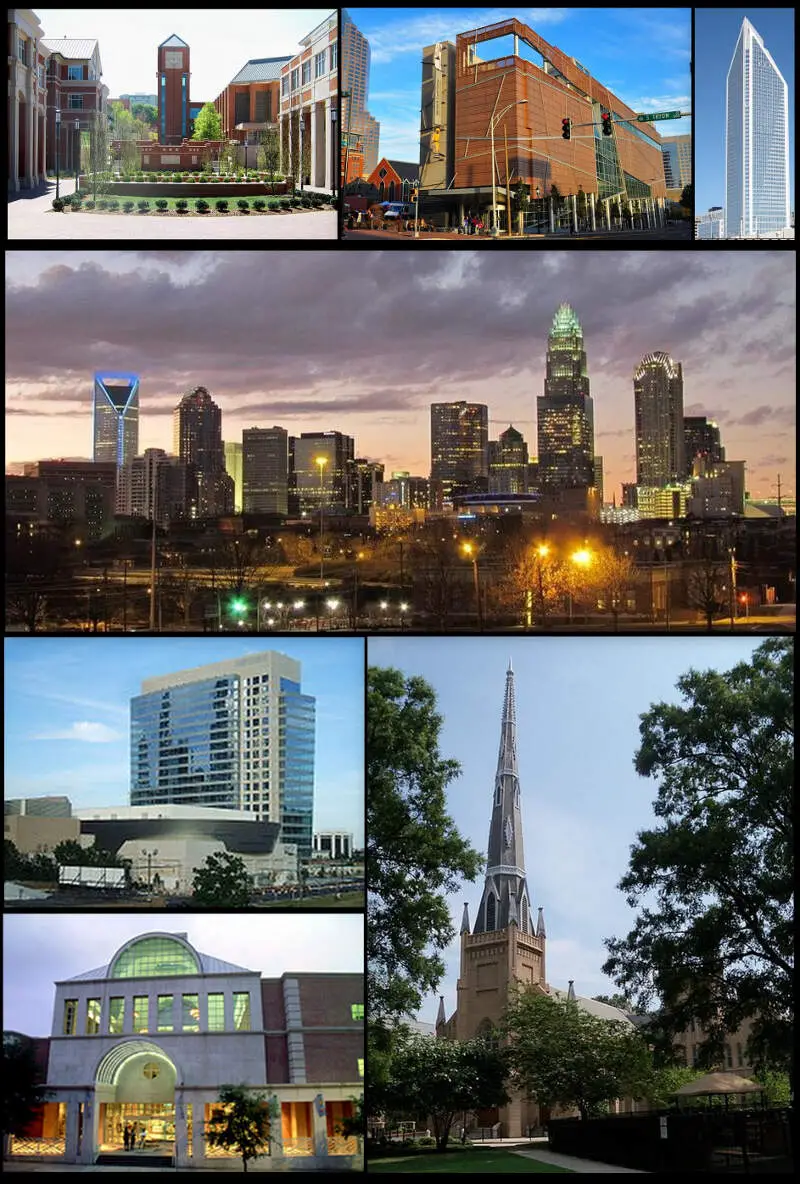
Population: 903,844
HHI: 2,922
% White: 38.1%
% African American: 33.3%
% Hispanic: 17.5%
% Asian: 6.5%
More on Charlotte: Data | Cost Of Living | Movers

/10
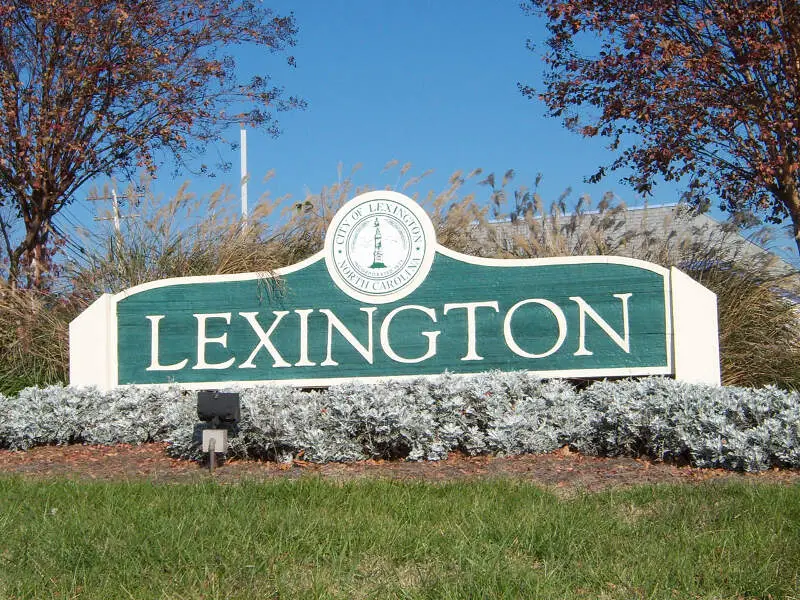
Population: 19,690
HHI: 2,981
% White: 42.7%
% African American: 23.2%
% Hispanic: 24.1%
% Asian: 3.7%
More on Lexington: Data | Crime | Cost Of Living | Movers

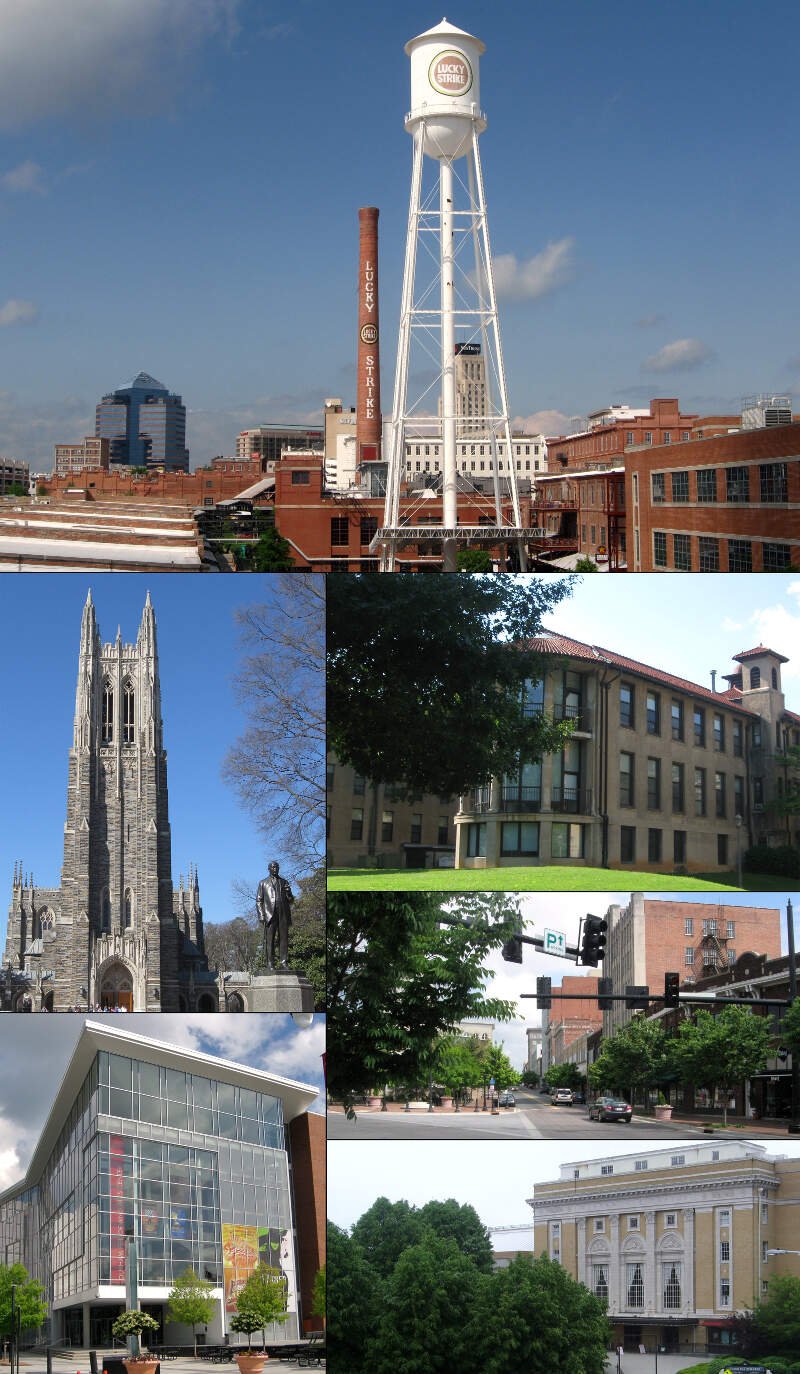
/10
Population: 291,467
HHI: 3,014
% White: 40.3%
% African American: 33.2%
% Hispanic: 15.2%
% Asian: 5.8%
More on Durham: Data | Crime | Cost Of Living | Movers

/10
Population: 116,245
HHI: 3,054
% White: 41.5%
% African American: 32.9%
% Hispanic: 12.9%
% Asian: 8.2%
More on High Point: Data | Crime | Cost Of Living | Movers

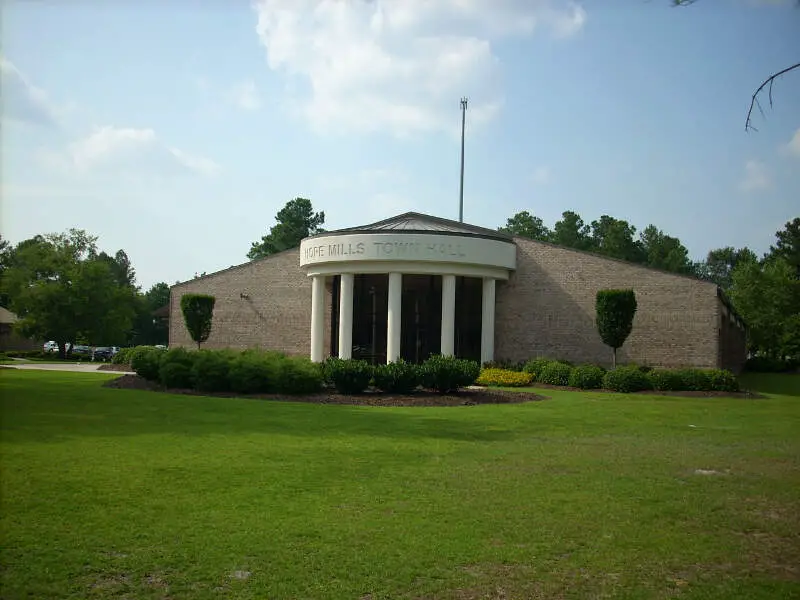
/10
Population: 17,939
HHI: 3,071
% White: 40.9%
% African American: 33.0%
% Hispanic: 16.4%
% Asian: 1.9%
More on Hope Mills: Data | Crime | Cost Of Living | Movers

/10
Population: 210,815
HHI: 3,113
% White: 34.2%
% African American: 41.5%
% Hispanic: 13.1%
% Asian: 3.0%
More on Fayetteville: Data | Crime | Cost Of Living | Movers

/10
Population: 31,422
HHI: 3,142
% White: 35.1%
% African American: 13.6%
% Hispanic: 3.6%
% Asian: 41.0%
More on Morrisville: Data | Crime | Cost Of Living | Movers
Methodology: How we determined the most diverse cities in North Carolina for 2026
We still believe in the accuracy of data — especially from the Census — and Saturday Night Science. So that’s where we went to get the race breakdown across North Carolina.
That leads us to the Census’s most recently available data, the 2020-2024 American Community Survey data from the US Census.
Specifically, we looked at table B03002: HISPANIC OR LATINO ORIGIN BY RACE. Here are the category names as defined by the Census:
- White alone*
- Black or African American alone*
- American Indian and Alaska Native alone*
- Asian alone*
- Native Hawaiian and Other Pacific Islander alone*
- Some other race alone*
- Two or more races*
- Hispanic or Latino
We limited our analysis to non-CDPs with a population greater than 5,000 people. That left us with 142 cities.
We then calculated the HHI for each city by finding the racial breakdown of a city in percent terms, squaring them, and then adding the squares together. This left us with scores ranging from 2,735 (Spring Lake) to 8,923 (Boiling Spring Lakes).
Finally, we ranked each city based on the HHI, with a lower score being more diverse than a high score. Spring Lake took the distinction of being the most diverse, while Boiling Spring Lakes was the least diverse city.
We updated this article for 2026. This report is our eleventh time ranking the most diverse places in North Carolina.
Summary: Diversity Across North Carolina
If you’re looking for a scientific breakdown of diversity across North Carolina, this is an accurate list.
The most diverse cities in North Carolina are Spring Lake, Lumberton, Pineville, Charlotte, Lexington, Durham, High Point, Hope Mills, Fayetteville, and Morrisville.
If you’re curious enough, here are the least diverse places in North Carolina:
- Boiling Spring Lakes
- Carolina Shores
- Oak Island
For more North Carolina reading, check out:
- Best Places To Live In North Carolina
- Cheapest Places To Live In North Carolina
- Most Dangerous Cities In North Carolina
- Best Places To Raise A Family In North Carolina
- Safest Cities in North Carolina
- Worst Places To Live In North Carolina
Race By City In North Carolina For 2026
| Rank | City | Population | HHI | % White | % Black | % Hispanic | % Asian |
|---|---|---|---|---|---|---|---|
| 1 | Spring Lake, NC | 11,573 | 2,735 | 34.0% | 34.2% | 17.8% | 2.2% |
| 2 | Lumberton, NC | 18,859 | 2,842 | 30.2% | 40.0% | 12.6% | 1.5% |
| 3 | Pineville, NC | 11,055 | 2,896 | 42.2% | 16.5% | 27.6% | 4.5% |
| 4 | Charlotte, NC | 903,844 | 2,922 | 38.1% | 33.3% | 17.5% | 6.5% |
| 5 | Lexington, NC | 19,690 | 2,981 | 42.7% | 23.2% | 24.1% | 3.7% |
| 6 | Durham, NC | 291,467 | 3,014 | 40.3% | 33.2% | 15.2% | 5.8% |
| 7 | High Point, NC | 116,245 | 3,054 | 41.5% | 32.9% | 12.9% | 8.2% |
| 8 | Hope Mills, NC | 17,939 | 3,071 | 40.9% | 33.0% | 16.4% | 1.9% |
| 9 | Fayetteville, NC | 210,815 | 3,113 | 34.2% | 41.5% | 13.1% | 3.0% |
| 10 | Morrisville, NC | 31,422 | 3,142 | 35.1% | 13.6% | 3.6% | 41.0% |
| 11 | Clinton, NC | 8,304 | 3,167 | 34.6% | 38.5% | 21.9% | 1.6% |
| 12 | Sanford, NC | 31,478 | 3,201 | 41.8% | 23.1% | 30.0% | 0.9% |
| 13 | Harrisburg, NC | 19,633 | 3,207 | 50.7% | 15.9% | 9.5% | 14.7% |
| 14 | Burlington, NC | 59,610 | 3,218 | 44.3% | 29.3% | 19.5% | 2.8% |
| 15 | Winston-Salem, NC | 252,037 | 3,224 | 43.6% | 31.2% | 18.2% | 2.3% |
| 16 | Concord, NC | 108,719 | 3,262 | 49.4% | 22.3% | 15.8% | 7.7% |
| 17 | Monroe, NC | 36,759 | 3,268 | 43.7% | 19.7% | 30.9% | 1.0% |
| 18 | Selma, NC | 6,817 | 3,274 | 25.8% | 45.3% | 23.3% | 0.6% |
| 19 | Knightdale, NC | 20,214 | 3,288 | 33.8% | 44.5% | 10.9% | 5.0% |
| 20 | Greensboro, NC | 301,198 | 3,292 | 38.1% | 41.0% | 10.5% | 5.2% |
| 21 | Butner, NC | 8,065 | 3,337 | 44.0% | 27.8% | 24.9% | 0.2% |
| 22 | Zebulon, NC | 8,711 | 3,443 | 29.0% | 45.6% | 22.9% | 0.4% |
| 23 | Wendell, NC | 13,064 | 3,466 | 47.6% | 24.5% | 24.4% | 1.0% |
| 24 | Raleigh, NC | 481,031 | 3,496 | 51.1% | 26.0% | 12.6% | 5.2% |
| 25 | Laurinburg, NC | 15,087 | 3,524 | 34.2% | 47.6% | 4.6% | 1.7% |
| 26 | New Bern, NC | 32,734 | 3,534 | 50.7% | 29.3% | 7.0% | 5.9% |
| 27 | Garner, NC | 34,473 | 3,541 | 52.0% | 25.1% | 13.2% | 3.2% |
| 28 | Wilson, NC | 48,370 | 3,590 | 34.9% | 46.9% | 12.5% | 1.7% |
| 29 | Statesville, NC | 29,894 | 3,594 | 51.9% | 25.6% | 14.9% | 1.8% |
| 30 | Dallas, NC | 6,104 | 3,599 | 47.0% | 34.6% | 13.4% | 0.4% |
| 31 | Gastonia, NC | 82,884 | 3,632 | 51.0% | 29.0% | 12.8% | 1.3% |
| 32 | Siler City, NC | 7,995 | 3,634 | 20.8% | 17.8% | 53.3% | 0.0% |
| 33 | Roxboro, NC | 8,182 | 3,641 | 44.8% | 39.0% | 7.8% | 0.5% |
| 34 | Long View, NC | 5,011 | 3,643 | 55.2% | 18.5% | 12.5% | 8.7% |
| 35 | Jacksonville, NC | 71,279 | 3,678 | 54.9% | 14.6% | 19.9% | 2.5% |
| 36 | Mebane, NC | 19,538 | 3,700 | 55.1% | 23.0% | 8.7% | 4.5% |
| 37 | Havelock, NC | 17,691 | 3,728 | 56.1% | 16.1% | 15.9% | 4.1% |
| 38 | Dunn, NC | 8,559 | 3,739 | 50.2% | 32.6% | 11.5% | 0.6% |
| 39 | Graham, NC | 18,048 | 3,739 | 53.9% | 22.0% | 18.2% | 0.7% |
| 40 | Forest City, NC | 7,363 | 3,752 | 55.6% | 21.8% | 10.5% | 1.6% |
| 41 | Asheboro, NC | 27,580 | 3,759 | 52.5% | 15.0% | 27.6% | 1.1% |
| 42 | Salisbury, NC | 35,825 | 3,776 | 49.1% | 35.0% | 11.5% | 1.0% |
| 43 | Kannapolis, NC | 57,890 | 3,778 | 55.5% | 21.9% | 13.4% | 3.2% |
| 44 | Cary, NC | 179,306 | 3,804 | 56.7% | 7.6% | 9.5% | 20.3% |
| 45 | Reidsville, NC | 14,585 | 3,825 | 52.1% | 31.6% | 6.4% | 0.4% |
| 46 | Thomasville, NC | 27,321 | 3,830 | 56.0% | 19.6% | 16.4% | 0.8% |
| 47 | Williamston, NC | 5,112 | 3,877 | 35.9% | 50.2% | 6.8% | 2.2% |
| 48 | Clayton, NC | 29,320 | 3,878 | 54.2% | 27.6% | 13.2% | 0.7% |
| 49 | Elizabeth City, NC | 18,871 | 3,906 | 42.1% | 45.5% | 7.1% | 1.0% |
| 50 | Roanoke Rapids, NC | 14,856 | 3,947 | 50.1% | 37.0% | 6.1% | 1.1% |
| 51 | Shelby, NC | 22,100 | 3,956 | 53.7% | 31.2% | 4.8% | 0.9% |
| 52 | Rockingham, NC | 8,967 | 3,963 | 52.1% | 33.9% | 9.6% | 0.9% |
| 53 | Greenville, NC | 92,857 | 3,964 | 48.5% | 39.5% | 5.5% | 2.7% |
| 54 | Goldsboro, NC | 34,383 | 3,986 | 34.2% | 52.5% | 6.1% | 1.6% |
| 55 | Ayden, NC | 5,150 | 4,007 | 50.6% | 36.2% | 11.9% | 0.0% |
| 56 | Washington, NC | 9,726 | 4,071 | 46.3% | 43.3% | 5.3% | 0.3% |
| 57 | Angier, NC | 6,241 | 4,122 | 59.0% | 18.2% | 17.2% | 0.7% |
| 58 | Morganton, NC | 17,646 | 4,132 | 58.4% | 14.3% | 22.6% | 1.3% |
| 59 | Carrboro, NC | 21,204 | 4,165 | 61.2% | 12.9% | 13.6% | 7.2% |
| 60 | Tarboro, NC | 10,770 | 4,260 | 41.9% | 49.6% | 6.6% | 0.0% |
| 61 | Smithfield, NC | 12,116 | 4,265 | 59.5% | 23.1% | 13.8% | 1.9% |
| 62 | Rolesville, NC | 10,766 | 4,265 | 57.7% | 29.5% | 6.8% | 1.3% |
| 63 | Marion, NC | 7,579 | 4,281 | 61.1% | 11.2% | 19.8% | 4.6% |
| 64 | Apex, NC | 70,630 | 4,302 | 61.7% | 7.3% | 6.2% | 19.5% |
| 65 | Lincolnton, NC | 11,783 | 4,306 | 60.2% | 21.3% | 14.9% | 0.1% |
| 66 | Chapel Hill, NC | 61,607 | 4,319 | 62.8% | 11.3% | 7.6% | 13.4% |
| 67 | Eden, NC | 15,356 | 4,349 | 60.0% | 25.6% | 8.4% | 0.2% |
| 68 | Hickory, NC | 44,258 | 4,355 | 62.6% | 13.0% | 15.2% | 4.8% |
| 69 | Newton, NC | 13,333 | 4,435 | 64.1% | 8.3% | 11.6% | 9.2% |
| 70 | Mint Hill, NC | 27,556 | 4,536 | 64.1% | 15.5% | 12.1% | 5.2% |
| 71 | Albemarle, NC | 16,762 | 4,545 | 62.1% | 25.2% | 6.2% | 3.5% |
| 72 | Henderson, NC | 14,885 | 4,559 | 21.1% | 63.3% | 9.7% | 1.4% |
| 73 | Oxford, NC | 8,914 | 4,562 | 32.8% | 58.8% | 3.9% | 0.6% |
| 74 | Indian Trail, NC | 42,036 | 4,573 | 64.7% | 12.0% | 14.7% | 3.5% |
| 75 | Kernersville, NC | 27,830 | 4,603 | 64.0% | 17.5% | 13.7% | 2.0% |
| 76 | Aberdeen, NC | 9,228 | 4,615 | 64.2% | 20.7% | 5.1% | 3.2% |
| 77 | Rocky Mount, NC | 54,297 | 4,616 | 26.0% | 62.4% | 5.5% | 1.5% |
| 78 | Winterville, NC | 10,725 | 4,631 | 55.8% | 38.9% | 3.0% | 0.9% |
| 79 | Hamlet, NC | 5,961 | 4,635 | 55.5% | 39.2% | 3.3% | 0.0% |
| 80 | Fuquay-Varina, NC | 40,485 | 4,656 | 65.5% | 14.7% | 9.9% | 2.9% |
| 81 | Marvin, NC | 6,692 | 4,660 | 64.8% | 7.2% | 5.0% | 19.1% |
| 82 | Wake Forest, NC | 52,844 | 4,662 | 64.6% | 19.5% | 9.0% | 2.9% |
| 83 | Mount Holly, NC | 18,208 | 4,669 | 65.4% | 16.4% | 9.8% | 3.4% |
| 84 | Waxhaw, NC | 22,275 | 4,832 | 67.5% | 8.1% | 11.8% | 7.4% |
| 85 | Huntersville, NC | 63,969 | 4,838 | 67.3% | 13.3% | 8.3% | 6.4% |
| 86 | Archer Lodge, NC | 5,186 | 4,934 | 66.7% | 11.7% | 18.5% | 0.0% |
| 87 | Kings Mountain, NC | 12,039 | 4,965 | 65.5% | 25.3% | 1.6% | 2.6% |
| 88 | Gibsonville, NC | 9,467 | 4,974 | 63.5% | 30.5% | 2.6% | 0.7% |
| 89 | Nashville, NC | 5,729 | 5,045 | 38.2% | 59.9% | 0.1% | 0.5% |
| 90 | Mooresville, NC | 52,381 | 5,065 | 69.3% | 12.2% | 8.3% | 4.4% |
| 91 | Kinston, NC | 19,505 | 5,105 | 22.7% | 67.5% | 3.2% | 1.5% |
| 92 | Mocksville, NC | 6,068 | 5,111 | 69.1% | 9.4% | 14.5% | 0.0% |
| 93 | Conover, NC | 8,580 | 5,157 | 67.9% | 3.3% | 22.2% | 0.3% |
| 94 | Matthews, NC | 30,577 | 5,169 | 70.0% | 13.0% | 6.0% | 6.4% |
| 95 | Holly Springs, NC | 45,248 | 5,188 | 70.5% | 8.4% | 6.8% | 8.7% |
| 96 | Wilmington, NC | 120,805 | 5,196 | 69.9% | 14.4% | 8.8% | 1.3% |
| 97 | Clemmons, NC | 21,871 | 5,242 | 70.8% | 7.7% | 10.2% | 6.4% |
| 98 | Pleasant Garden, NC | 5,060 | 5,559 | 72.7% | 12.7% | 6.1% | 0.0% |
| 99 | Southern Pines, NC | 16,420 | 5,611 | 73.4% | 10.8% | 7.0% | 1.4% |
| 100 | Wesley Chapel, NC | 9,090 | 5,625 | 73.7% | 7.6% | 10.5% | 4.5% |