Racial diversity in North Carolina is a mixed bag.
There are parts of North Carolina where there’s a high level of diversity. But where will you find the most diverse places in North Carolina?
To answer that question, we went to the US Census data. Using Saturday Night Science, we measured the Gini coefficient for all 142 cities in North Carolina to rank them from most to least diverse.
#1 most diverse in North Carolina
Spring Lake is a town in Cumberland County, North Carolina, United States. The 2010 census recorded the population at 11,964 people, with an estimated population in 2013 of 13,037.
Data | Crime | Cost of living | Movers
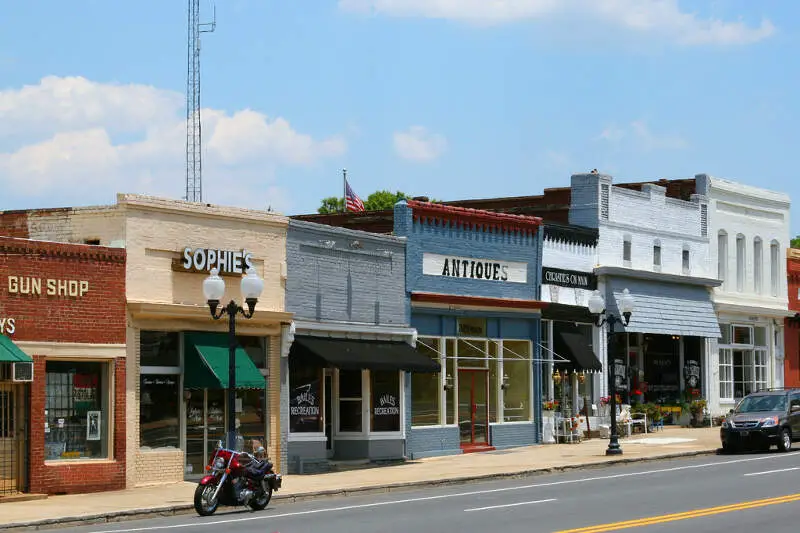
#2 most diverse in North Carolina
Lumberton is a city in Robeson County, North Carolina, United States. The population has grown to 21,542 in the 2010 census from 20,795 in the 2000 census. It is the county seat of Robeson County. Lumberton, located in southern North Carolina’s Inner Banks region, is located on the Lumber River. Founded in 1787 by John Willis, an officer in the American Revolution, Lumberton was originally a shipping point for lumber used by the Navy, which was sent downriver to Georgetown, South Carolina. Most of the town’s growth, however, began shortly after World War II.
Data | Crime | Cost of living | Movers
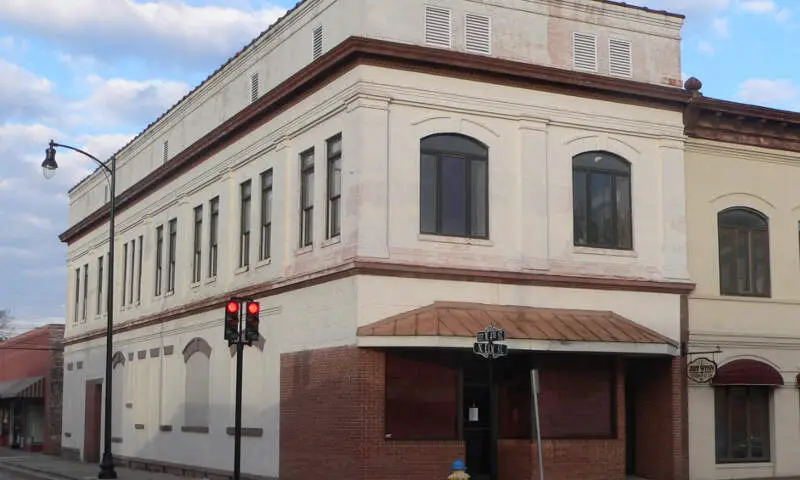
#3 most diverse in North Carolina
Pineville is a suburban town in the southernmost portion of Mecklenburg County, North Carolina situated in the Waxhaws district between Charlotte, North Carolina and Fort Mill, South Carolina.
Data | Crime | Cost of living | Movers
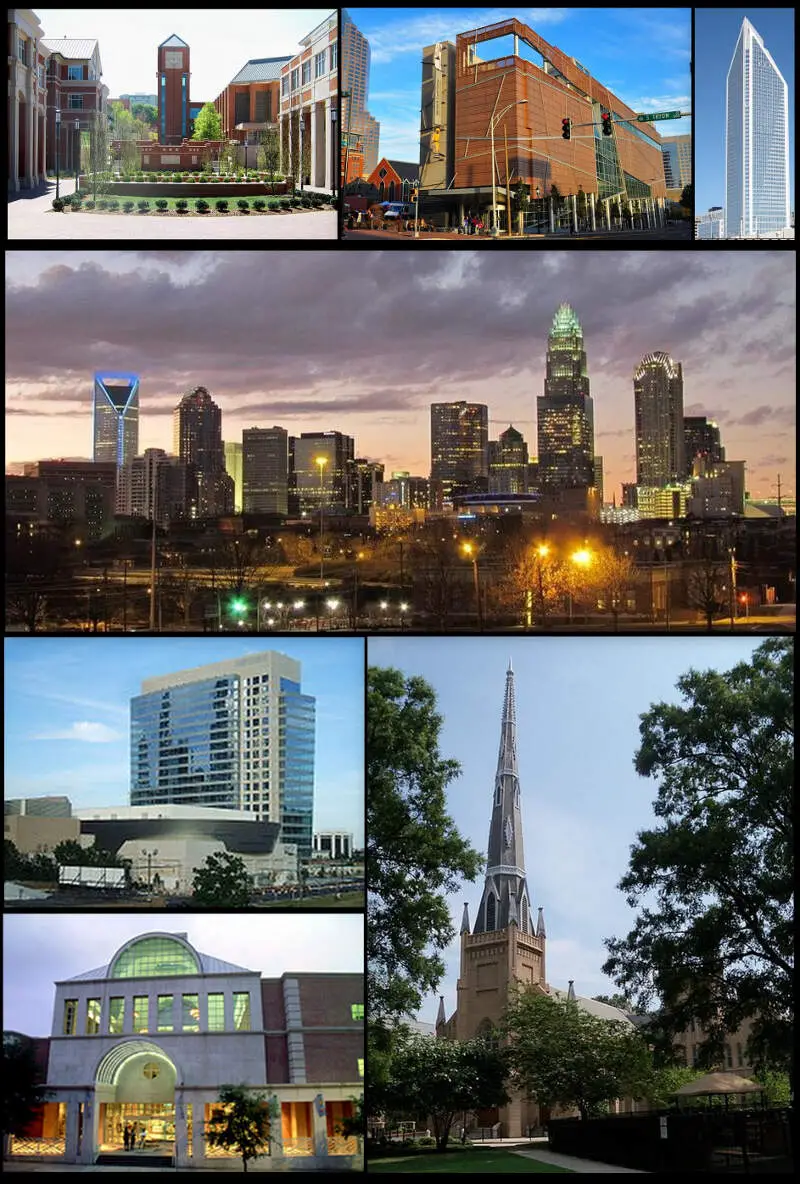
#4 most diverse in North Carolina
Charlotte is the most populous city in the U.S. state of North Carolina. It is the county seat of Mecklenburg County. In 2016, the U.S.Census Bureau estimated the population was 842,051, making it the 17th-most populous city in the United States. The Charlotte metropolitan area ranks 22nd-largest in the U.S., and had a 2016 population of 2,474,314. The Charlotte metropolitan area is part of a sixteen-county market region or combined statistical area with a 2016 U.S.Census population estimate of 2,632,249. Between 2004 and 2014, Charlotte was ranked as the country’s fastest growing metro area, with 888,000 new residents. Based on U.S. Census data from 2005 to 2015, it also tops the 50 largest U.S. cities as the millennial hub. It is the second-largest city in the southeastern United States, just behind Jacksonville, Florida. It is the third-fastest growing major city in the United States. It is listed as a “gamma-minus” global city by the Globalization and World Cities Research Network. Residents are referred to as “Charlotteans”.
Data | Crime | Cost of living | Movers
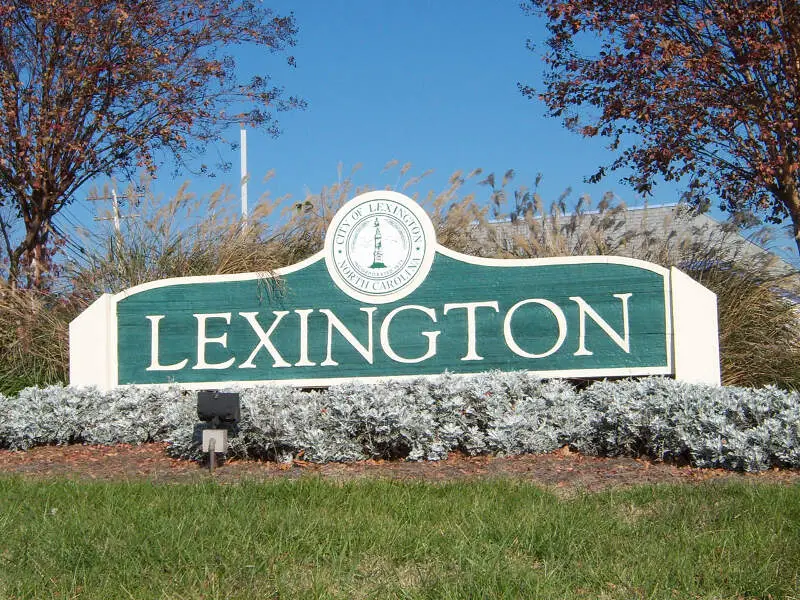
#5 most diverse in North Carolina
Lexington is the county seat of Davidson County, North Carolina, United States. As of the 2010 census, the city had a population of 18,931. It is located in central North Carolina, 20 miles south of Winston-Salem. Major highways include I-85, I-85B, U.S. Route 29, U.S. Route 70, U.S. Route 52 and U.S. Route 64. Lexington is part of the Piedmont Triad region of the state.
Data | Crime | Cost of living | Movers
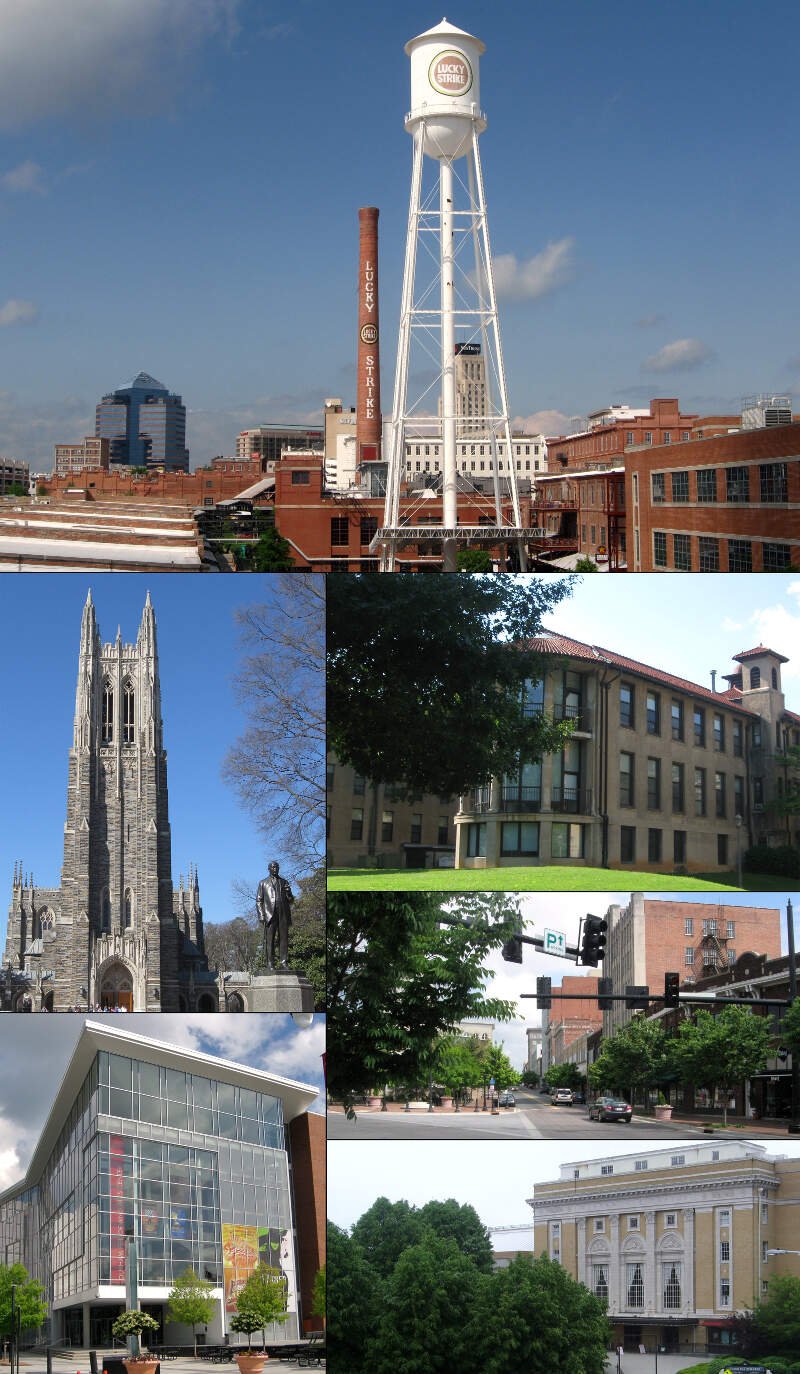
#6 most diverse in North Carolina
Durham is a city in the U.S. state of North Carolina. It is the county seat of Durham County. The U.S. Census Bureau estimated the city’s population to be 251,893 as of July 1, 2014, making it the 4th-most populous city in North Carolina, and the 78th-most populous city in the United States. Durham is the core of the four-county Durham-Chapel Hill Metropolitan Area, which has a population of 542,710 as of U.S. Census 2014 Population Estimates. The US Office of Management and Budget also includes Durham as a part of the Raleigh-Durham-Chapel Hill Combined Statistical Area, which has a population of 2,037,430 as of U.S. Census 2014 Population Estimates.
Data | Crime | Cost of living | Movers | Compare
#7 most diverse in North Carolina
High Point is a city located in the Piedmont Triad region of the State of North Carolina. As of the 2010 census the city had a total population of 104,371, with an estimated population of 108,629 in 2014. High Point is currently the ninth-largest municipality in North Carolina.
Data | Crime | Cost of living | Movers
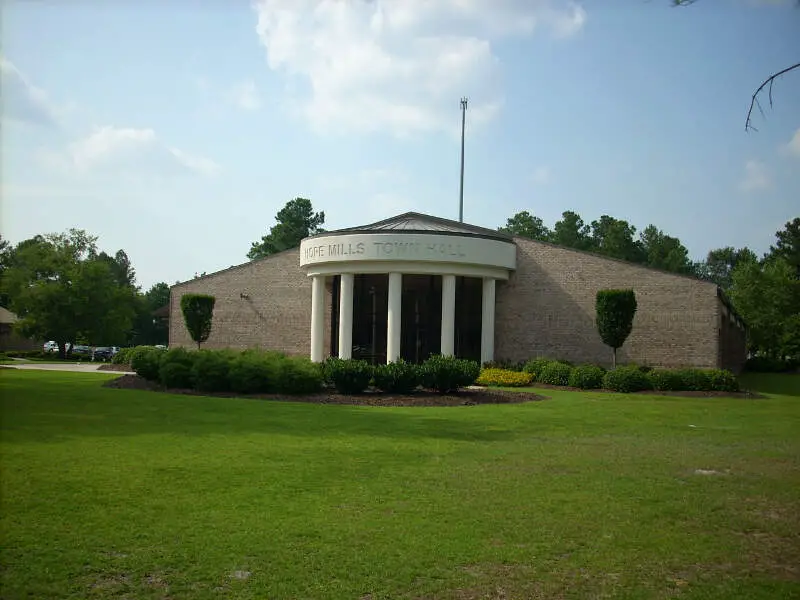
#8 most diverse in North Carolina
Hope Mills is a town in Cumberland County, North Carolina, United States. The population was 15,176 at the 2010 census.
Data | Crime | Cost of living | Movers
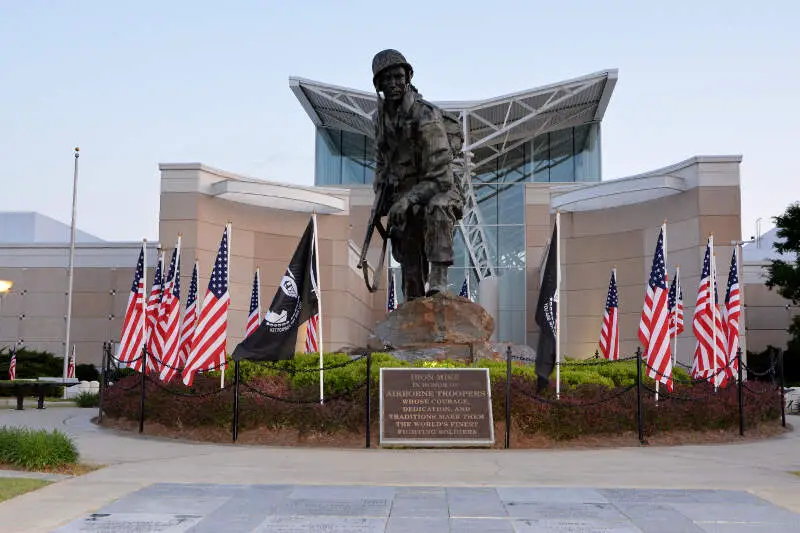
#9 most diverse in North Carolina
Fayetteville is a city in Cumberland County, North Carolina, United States. It is the county seat of Cumberland County, and is best known as the home of Fort Bragg, a major U.S. Army installation northwest of the city.
Data | Crime | Cost of living | Movers
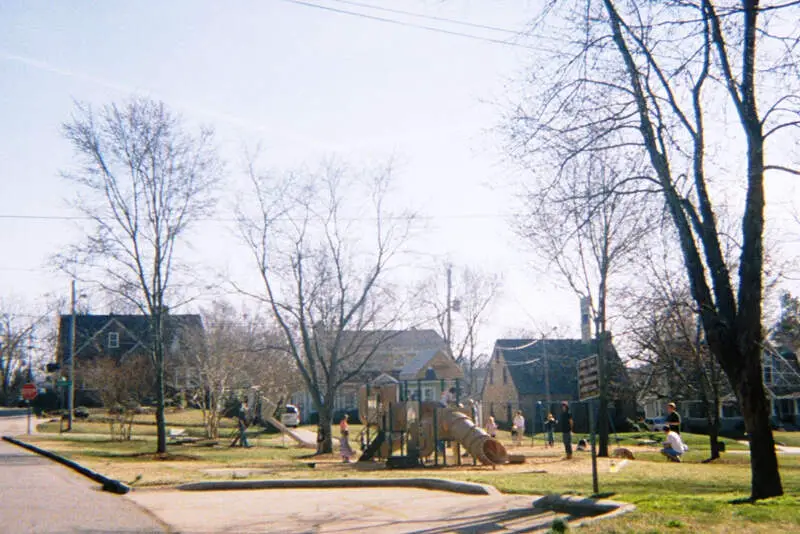
#10 most diverse in North Carolina
Morrisville is a town located in both Wake and Durham counties of the U.S. state of North Carolina. The population was 18,576 at the 2010 census. The U.S. Census Bureau estimates the town’s population to be 21,932 as of July 1, 2013. Morrisville is part of the Research Triangle metropolitan region. The regional name originated after the 1959 creation of the Research Triangle Park, located midway between the cities of Raleigh and Durham. The Research Triangle region encompasses the U.S. Census Bureau’s Combined Statistical Area of Raleigh-Durham-Cary. The estimated population of the Raleigh-Durham-Cary CSA was 1,565,223 as of July 1, 2006, with the Raleigh-Cary Metropolitan Statistical Area portion estimated at 994,551 residents. The U.S. headquarters of Chinese multinational Lenovo are located in the municipal limits.
Data | Crime | Cost of living | Movers
The receipts
Compare the top ten
Pick a metric. The bars rescale. The red line is North Carolina’s statewide median.
On the map
Where diversity lives in North Carolina
Saturday Night Science
Methodology: How we determined the most diverse cities in North Carolina for 2026
We still believe in the accuracy of data — especially from the Census — and Saturday Night Science. So that’s where we went to get the race breakdown across North Carolina.
That leads us to the Census’s most recently available data, the 2020-2024 American Community Survey data from the US Census.
Specifically, we looked at table B03002: HISPANIC OR LATINO ORIGIN BY RACE. Here are the category names as defined by the Census:
- White alone*
- Black or African American alone*
- American Indian and Alaska Native alone*
- Asian alone*
- Native Hawaiian and Other Pacific Islander alone*
- Some other race alone*
- Two or more races*
- Hispanic or Latino
We limited our analysis to non-CDPs with a population greater than 5,000 people. That left us with 142 cities.
We then calculated the HHI for each city by finding the racial breakdown of a city in percent terms, squaring them, and then adding the squares together. This left us with scores ranging from 2,735 (Spring Lake) to 8,924 (Boiling Spring Lakes).
Finally, we ranked each city based on the HHI, with a lower score being more diverse than a high score. Spring Lake took the distinction of being the most diverse, while Boiling Spring Lakes was the least diverse city.
We updated this article for 2026. This report is our eleventh time ranking the most diverse places in North Carolina.
The full plate
Race By City In North Carolina For 2026
Click any column to sort. Search by city name.
| Rank | City | Population | HHI | % White | % Black | % Hispanic | % Asian |
|---|---|---|---|---|---|---|---|
| 1 | Spring Lake | 11,573 | 2,735 | 34.0% | 34.2% | 17.8% | 2.2% |
| 2 | Lumberton | 18,859 | 2,843 | 30.2% | 40.0% | 12.6% | 1.5% |
| 3 | Pineville | 11,055 | 2,896 | 42.2% | 16.5% | 27.6% | 4.5% |
| 4 | Charlotte | 903,844 | 2,923 | 38.1% | 33.3% | 17.5% | 6.5% |
| 5 | Lexington | 19,690 | 2,982 | 42.7% | 23.2% | 24.1% | 3.7% |
| 6 | Durham | 291,467 | 3,015 | 40.3% | 33.2% | 15.2% | 5.8% |
| 7 | High Point | 116,245 | 3,055 | 41.5% | 32.9% | 12.9% | 8.2% |
| 8 | Hope Mills | 17,939 | 3,072 | 40.9% | 33.0% | 16.4% | 1.9% |
| 9 | Fayetteville | 210,815 | 3,114 | 34.2% | 41.5% | 13.1% | 3.0% |
| 10 | Morrisville | 31,422 | 3,142 | 35.1% | 13.6% | 3.6% | 41.0% |
| 11 | Clinton | 8,304 | 3,168 | 34.6% | 38.5% | 21.9% | 1.6% |
| 12 | Sanford | 31,478 | 3,202 | 41.8% | 23.1% | 30.0% | 0.9% |
| 13 | Harrisburg | 19,633 | 3,207 | 50.7% | 15.9% | 9.5% | 14.7% |
| 14 | Burlington | 59,610 | 3,219 | 44.3% | 29.3% | 19.5% | 2.8% |
| 15 | Winston-Salem | 252,037 | 3,225 | 43.6% | 31.2% | 18.2% | 2.3% |
| 16 | Concord | 108,719 | 3,262 | 49.4% | 22.3% | 15.8% | 7.7% |
| 17 | Monroe | 36,759 | 3,269 | 43.7% | 19.7% | 30.9% | 1.0% |
| 18 | Selma | 6,817 | 3,274 | 25.8% | 45.3% | 23.3% | 0.6% |
| 19 | Knightdale | 20,214 | 3,289 | 33.8% | 44.5% | 10.9% | 5.0% |
| 20 | Greensboro | 301,198 | 3,292 | 38.1% | 41.0% | 10.5% | 5.2% |
| 21 | Butner | 8,065 | 3,337 | 44.0% | 27.8% | 24.9% | 0.2% |
| 22 | Zebulon | 8,711 | 3,444 | 29.0% | 45.6% | 22.9% | 0.4% |
| 23 | Wendell | 13,064 | 3,466 | 47.6% | 24.5% | 24.4% | 1.0% |
| 24 | Raleigh | 481,031 | 3,497 | 51.1% | 26.0% | 12.6% | 5.2% |
| 25 | Laurinburg | 15,087 | 3,525 | 34.2% | 47.6% | 4.6% | 1.7% |
| 26 | New Bern | 32,734 | 3,535 | 50.7% | 29.3% | 7.0% | 5.9% |
| 27 | Garner | 34,473 | 3,541 | 52.0% | 25.1% | 13.2% | 3.2% |
| 28 | Wilson | 48,370 | 3,591 | 34.9% | 46.9% | 12.5% | 1.7% |
| 29 | Statesville | 29,894 | 3,594 | 51.9% | 25.6% | 14.9% | 1.8% |
| 30 | Dallas | 6,104 | 3,600 | 47.0% | 34.6% | 13.4% | 0.4% |
| 31 | Gastonia | 82,884 | 3,632 | 51.0% | 29.0% | 12.8% | 1.3% |
| 32 | Siler City | 7,995 | 3,634 | 20.8% | 17.8% | 53.3% | 0.0% |
| 33 | Roxboro | 8,182 | 3,642 | 44.8% | 39.0% | 7.8% | 0.5% |
| 34 | Long View | 5,011 | 3,644 | 55.2% | 18.5% | 12.5% | 8.7% |
| 35 | Jacksonville | 71,279 | 3,679 | 54.9% | 14.6% | 19.9% | 2.5% |
| 36 | Mebane | 19,538 | 3,701 | 55.1% | 23.0% | 8.7% | 4.5% |
| 37 | Havelock | 17,691 | 3,728 | 56.1% | 16.1% | 15.9% | 4.1% |
| 38 | Dunn | 8,559 | 3,739 | 50.2% | 32.6% | 11.5% | 0.6% |
| 38 | Graham | 18,048 | 3,740 | 53.9% | 22.0% | 18.2% | 0.7% |
| 40 | Forest City | 7,363 | 3,753 | 55.6% | 21.8% | 10.5% | 1.6% |
| 41 | Asheboro | 27,580 | 3,759 | 52.5% | 15.0% | 27.6% | 1.1% |
| 42 | Salisbury | 35,825 | 3,776 | 49.1% | 35.0% | 11.5% | 1.0% |
| 43 | Kannapolis | 57,890 | 3,778 | 55.5% | 21.9% | 13.4% | 3.2% |
| 44 | Cary | 179,306 | 3,805 | 56.7% | 7.6% | 9.5% | 20.3% |
| 45 | Reidsville | 14,585 | 3,825 | 52.1% | 31.6% | 6.4% | 0.4% |
| 46 | Thomasville | 27,321 | 3,830 | 56.0% | 19.6% | 16.4% | 0.8% |
| 47 | Williamston | 5,112 | 3,878 | 35.9% | 50.2% | 6.8% | 2.2% |
| 48 | Clayton | 29,320 | 3,878 | 54.2% | 27.6% | 13.2% | 0.7% |
| 49 | Elizabeth City | 18,871 | 3,907 | 42.1% | 45.5% | 7.1% | 1.0% |
| 50 | Roanoke Rapids | 14,856 | 3,948 | 50.1% | 37.0% | 6.1% | 1.1% |
| 51 | Shelby | 22,100 | 3,957 | 53.7% | 31.2% | 4.8% | 0.9% |
| 52 | Rockingham | 8,967 | 3,963 | 52.1% | 33.9% | 9.6% | 0.9% |
| 53 | Greenville | 92,857 | 3,965 | 48.5% | 39.5% | 5.5% | 2.7% |
| 54 | Goldsboro | 34,383 | 3,987 | 34.2% | 52.5% | 6.1% | 1.6% |
| 55 | Ayden | 5,150 | 4,007 | 50.6% | 36.2% | 11.9% | 0.0% |
| 56 | Washington | 9,726 | 4,072 | 46.3% | 43.3% | 5.3% | 0.3% |
| 57 | Angier | 6,241 | 4,123 | 59.0% | 18.2% | 17.2% | 0.7% |
| 58 | Morganton | 17,646 | 4,133 | 58.4% | 14.3% | 22.6% | 1.3% |
| 59 | Carrboro | 21,204 | 4,165 | 61.2% | 12.9% | 13.6% | 7.2% |
| 60 | Tarboro | 10,770 | 4,261 | 41.9% | 49.6% | 6.6% | 0.0% |
| 61 | Rolesville | 10,766 | 4,266 | 57.7% | 29.5% | 6.8% | 1.3% |
| 61 | Smithfield | 12,116 | 4,265 | 59.5% | 23.1% | 13.8% | 1.9% |
| 63 | Marion | 7,579 | 4,282 | 61.1% | 11.2% | 19.8% | 4.6% |
| 64 | Apex | 70,630 | 4,303 | 61.7% | 7.3% | 6.2% | 19.5% |
| 65 | Lincolnton | 11,783 | 4,306 | 60.2% | 21.3% | 14.9% | 0.1% |
| 66 | Chapel Hill | 61,607 | 4,319 | 62.8% | 11.3% | 7.6% | 13.4% |
| 67 | Eden | 15,356 | 4,350 | 60.0% | 25.6% | 8.4% | 0.2% |
| 68 | Hickory | 44,258 | 4,356 | 62.6% | 13.0% | 15.2% | 4.8% |
| 69 | Newton | 13,333 | 4,435 | 64.1% | 8.3% | 11.6% | 9.2% |
| 70 | Mint Hill | 27,556 | 4,536 | 64.1% | 15.5% | 12.1% | 5.2% |
| 71 | Albemarle | 16,762 | 4,546 | 62.1% | 25.2% | 6.2% | 3.5% |
| 72 | Henderson | 14,885 | 4,560 | 21.1% | 63.3% | 9.7% | 1.4% |
| 73 | Oxford | 8,914 | 4,563 | 32.8% | 58.8% | 3.9% | 0.6% |
| 74 | Indian Trail | 42,036 | 4,573 | 64.7% | 12.0% | 14.7% | 3.5% |
| 75 | Kernersville | 27,830 | 4,604 | 64.0% | 17.5% | 13.7% | 2.0% |
| 76 | Aberdeen | 9,228 | 4,615 | 64.2% | 20.7% | 5.1% | 3.2% |
| 77 | Rocky Mount | 54,297 | 4,616 | 26.0% | 62.4% | 5.5% | 1.5% |
| 78 | Winterville | 10,725 | 4,631 | 55.8% | 38.9% | 3.0% | 0.9% |
| 79 | Hamlet | 5,961 | 4,635 | 55.5% | 39.2% | 3.3% | 0.0% |
| 80 | Fuquay-Varina | 40,485 | 4,657 | 65.5% | 14.7% | 9.9% | 2.9% |
| 81 | Marvin | 6,692 | 4,661 | 64.8% | 7.2% | 5.0% | 19.1% |
| 82 | Wake Forest | 52,844 | 4,662 | 64.6% | 19.5% | 9.0% | 2.9% |
| 83 | Mount Holly | 18,208 | 4,670 | 65.4% | 16.4% | 9.8% | 3.4% |
| 84 | Waxhaw | 22,275 | 4,833 | 67.5% | 8.1% | 11.8% | 7.4% |
| 85 | Huntersville | 63,969 | 4,839 | 67.3% | 13.3% | 8.3% | 6.4% |
| 86 | Archer Lodge | 5,186 | 4,935 | 66.7% | 11.7% | 18.5% | 0.0% |
| 87 | Kings Mountain | 12,039 | 4,966 | 65.5% | 25.3% | 1.6% | 2.6% |
| 88 | Gibsonville | 9,467 | 4,975 | 63.5% | 30.5% | 2.6% | 0.7% |
| 89 | Nashville | 5,729 | 5,045 | 38.2% | 59.9% | 0.1% | 0.5% |
| 90 | Mooresville | 52,381 | 5,066 | 69.3% | 12.2% | 8.3% | 4.4% |
| 91 | Kinston | 19,505 | 5,105 | 22.7% | 67.5% | 3.2% | 1.5% |
| 92 | Mocksville | 6,068 | 5,111 | 69.1% | 9.4% | 14.5% | 0.0% |
| 93 | Conover | 8,580 | 5,157 | 67.9% | 3.3% | 22.2% | 0.3% |
| 94 | Matthews | 30,577 | 5,169 | 70.0% | 13.0% | 6.0% | 6.4% |
| 95 | Holly Springs | 45,248 | 5,188 | 70.5% | 8.4% | 6.8% | 8.7% |
| 96 | Wilmington | 120,805 | 5,196 | 69.9% | 14.4% | 8.8% | 1.3% |
| 97 | Clemmons | 21,871 | 5,242 | 70.8% | 7.7% | 10.2% | 6.4% |
| 98 | Pleasant Garden | 5,060 | 5,560 | 72.7% | 12.7% | 6.1% | 0.0% |
| 99 | Southern Pines | 16,420 | 5,611 | 73.4% | 10.8% | 7.0% | 1.4% |
| 100 | Wesley Chapel | 9,090 | 5,626 | 73.7% | 7.6% | 10.5% | 4.5% |
Source: U.S. Census ACS 2020-2024. 142 cities with more than 5,000 residents.
Summary
Summary: Diversity Across North Carolina
If you’re looking for a scientific breakdown of diversity across North Carolina, this is an accurate list.
The most diverse cities in North Carolina are Spring Lake, Lumberton, Pineville, Charlotte, Lexington, Durham, High Point, Hope Mills, Fayetteville, and Morrisville. Not sold on North Carolina? Take the two-minute Find Your Place quiz and see which state actually fits you.
Questions and answers
Most Diverse Cities In North Carolina FAQs
What is the most diverse city in North Carolina?
Spring Lake is the most diverse city in North Carolina for 2026, posting the lowest diversity index (2,735) of the 142 places we measured. Lumberton and Pineville are next.
What are the 10 most diverse cities in North Carolina?
The ten most diverse cities in North Carolina are Spring Lake, Lumberton, Pineville, Charlotte, Lexington, Durham, High Point, Hope Mills, Fayetteville, and Morrisville. We ranked all 142 places with more than 5,000 residents by their racial-diversity HHI.
How do you measure diversity?
We use a Herfindahl-Hirschman Index (HHI) across each city’s White, Black, Hispanic, and Asian population shares from the Census American Community Survey. A lower score means the mix is more even, so the lowest HHI wins.
What is the least diverse city in North Carolina?
Boiling Spring Lakes is the least diverse city in North Carolina, with a diversity index of 8,924. That means one group makes up most of its population.
Where does this data come from?
All population shares come from the Census Bureau’s American Community Survey (2020-2024). Diversity scores in North Carolina range from 2,735 in Spring Lake to 8,924 in Boiling Spring Lakes.


