
Racial diversity in Utah is a mixed bag.
There are parts of Utah where there’s a high level of diversity. But where will you find the most diverse places in Utah?
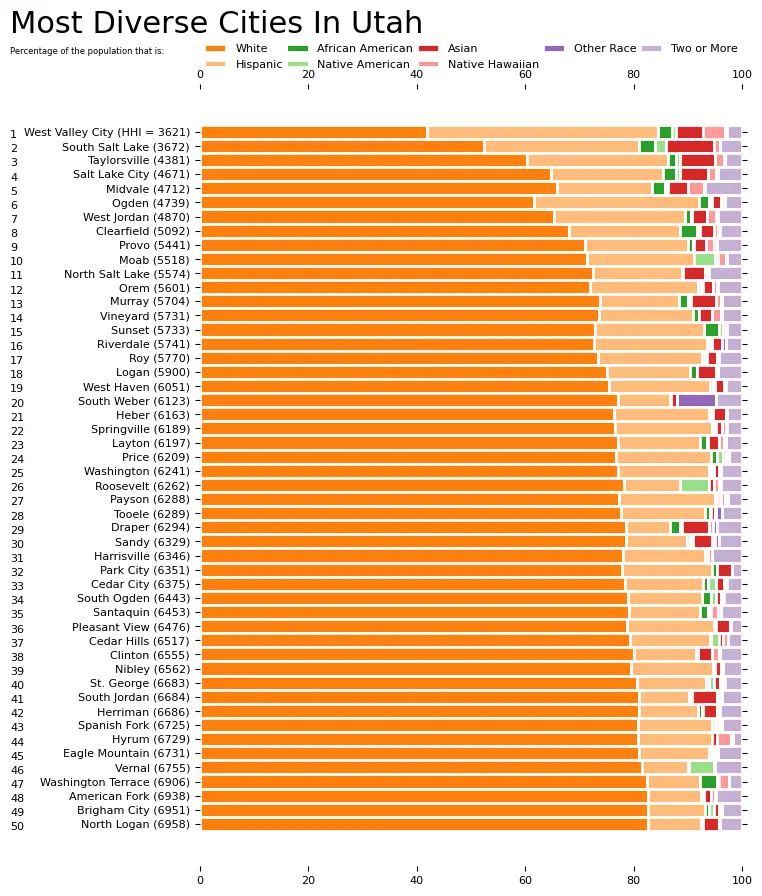
To answer that question, we went to the US Census data. Using Saturday Night Science, we measured the Gini coefficient for all 89 cities in Utah to rank them from most to least diverse.
Table Of Contents: Top Ten | Methodology | Summary | Table
Here are the 10 most diverse places in Utah for 2025:
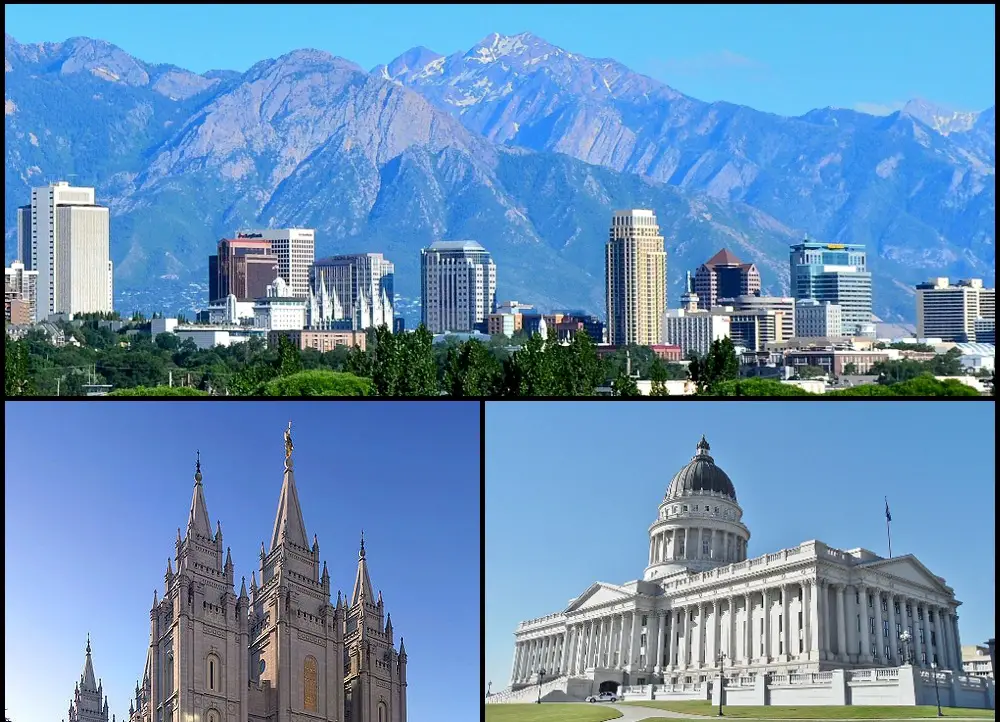
So what city is the most diverse in Utah? According to the most Census data, West Valley City took the number one over all spot for diversity in Utah.
Read on below to see how we crunched the numbers and how your town ranked. To see where Utah ranked as a state, we have a ranking of the most diverse states in Ameria.
For more Utah reading:
The 10 Most Diverse Places In Utah For 2025

/10
Population: 137,955
HHI: 3,621
% White: 42.0%
% African American: 2.6%
% Hispanic: 42.5%
% Asian: 4.9%
More on West Valley City: Data

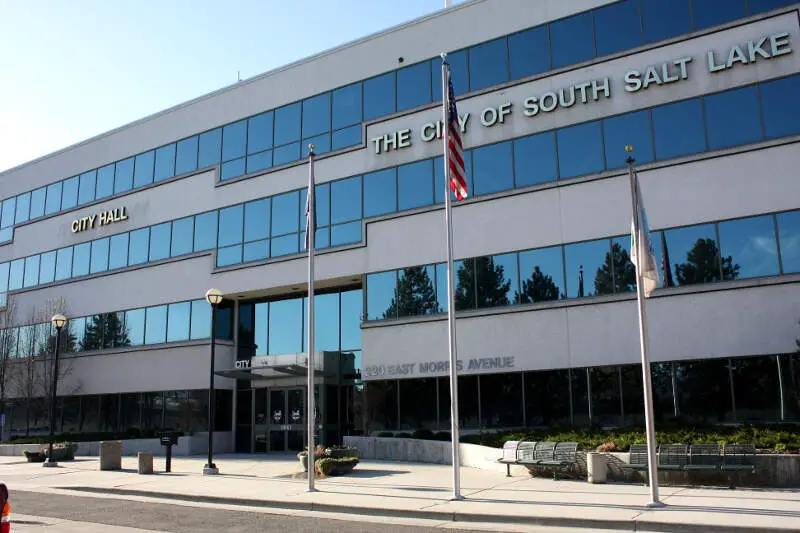
/10
Population: 26,277
HHI: 3,672
% White: 52.4%
% African American: 3.0%
% Hispanic: 28.6%
% Asian: 8.8%
More on South Salt Lake: Data

/10
Population: 59,010
HHI: 4,381
% White: 60.4%
% African American: 1.4%
% Hispanic: 26.0%
% Asian: 6.6%
More on Taylorsville: Data

/10
Population: 203,888
HHI: 4,671
% White: 64.7%
% African American: 2.4%
% Hispanic: 20.8%
% Asian: 5.3%
More on Salt Lake City: Data

/10
Population: 35,736
HHI: 4,712
% White: 65.8%
% African American: 2.5%
% Hispanic: 17.5%
% Asian: 3.6%
More on Midvale: Data

/10
Population: 86,973
HHI: 4,739
% White: 61.6%
% African American: 1.8%
% Hispanic: 30.5%
% Asian: 1.6%
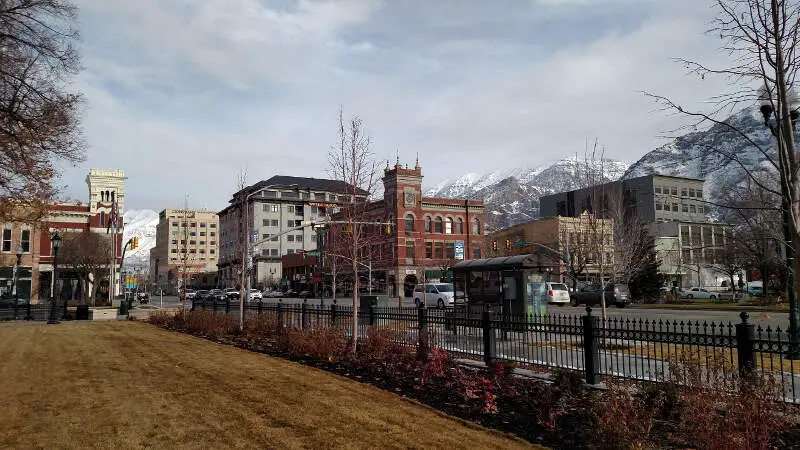
More on Ogden: Data

/10
Population: 116,277
HHI: 4,870
% White: 65.2%
% African American: 1.2%
% Hispanic: 24.1%
% Asian: 2.7%
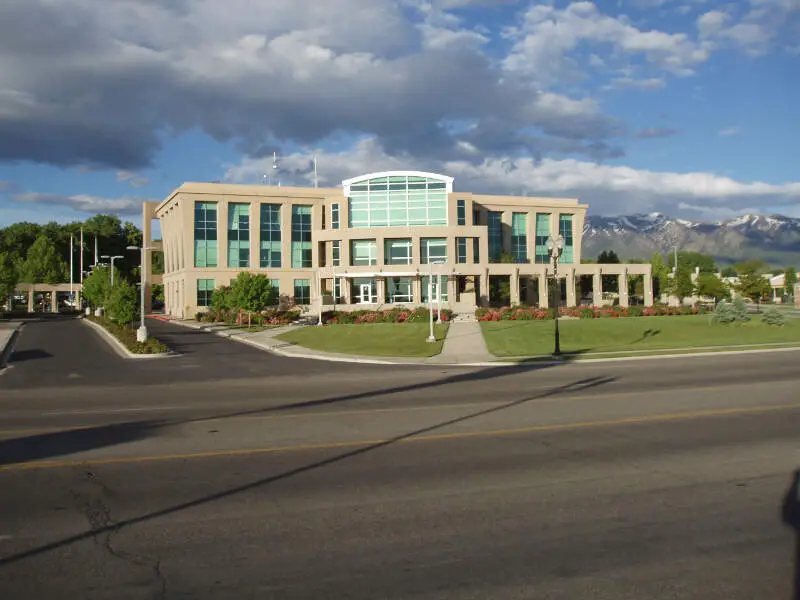
More on West Jordan: Data

/10
Population: 32,895
HHI: 5,092
% White: 68.2%
% African American: 3.1%
% Hispanic: 20.3%
% Asian: 2.5%
More on Clearfield: Data

/10
Population: 114,303
HHI: 5,441
% White: 71.1%
% African American: 0.9%
% Hispanic: 18.9%
% Asian: 2.2%
More on Provo: Data
/10
Population: 5,316
HHI: 5,518
% White: 71.5%
% African American: 0.0%
% Hispanic: 19.7%
% Asian: 0.6%
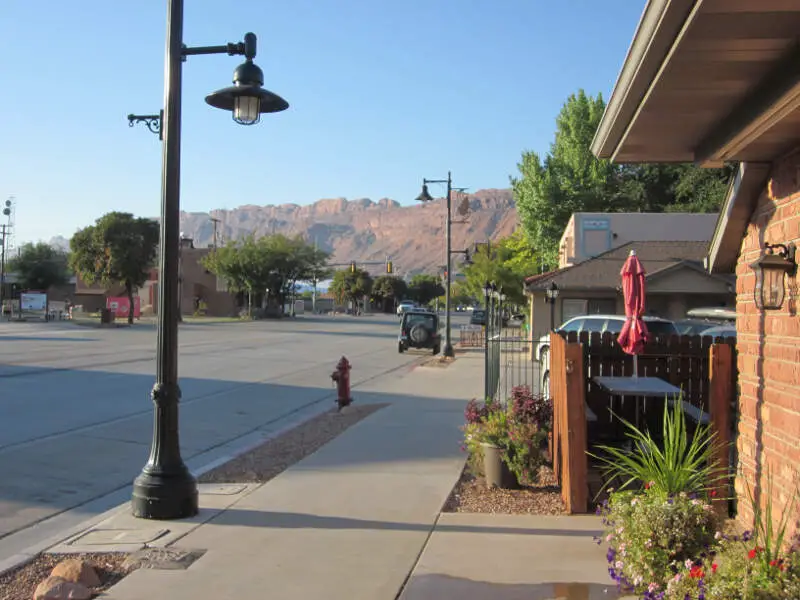
More on Moab: Data
Methodology: How we determined the most diverse cities in Utah for 2025
We still believe in the accuracy of data — especially from the Census — and Saturday Night Science. So that’s where we went to get the race breakdown across Utah.
That leads us to the Census’s most recently available data, the 2019-2023 American Community Survey data from the US Census.
Specifically, we looked at table B03002: HISPANIC OR LATINO ORIGIN BY RACE. Here are the category names as defined by the Census:
- White alone*
- Black or African American alone*
- American Indian and Alaska Native alone*
- Asian alone*
- Native Hawaiian and Other Pacific Islander alone*
- Some other race alone*
- Two or more races*
- Hispanic or Latino
We limited our analysis to non-CDPs with a population greater than 5,000 people. That left us with 89 cities.
We then calculated the HHI for each city by finding the racial breakdown of a city in percent terms, squaring them, and then adding the squares together. This left us with scores ranging from 3,621 (West Valley City) to 9,358 (Midway).
Finally, we ranked each city based on the HHI, with a lower score being more diverse than a high score. West Valley City took the distinction of being the most diverse, while Midway was the least diverse city.
We updated this article for 2025. This report is our tenth time ranking the most diverse places in Utah.
Summary: Diversity Across Utah
If you’re looking for a scientific breakdown of diversity across Utah, this is an accurate list.
The most diverse cities in Utah are West Valley City, South Salt Lake, Taylorsville, Salt Lake City, Midvale, Ogden, West Jordan, Clearfield, Provo, and Moab.
If you’re curious enough, here are the least diverse places in Utah:
- Midway
- Fruit Heights
- Enoch
For more Utah reading, check out:
- Best Places To Live In Utah
- Cheapest Places To Live In Utah
- Most Dangerous Cities In Utah
- Best Places To Raise A Family In Utah
- Safest Places In Utah
- Worst Places To Live In Utah
Race By City In Utah For 2025
| Rank | City | Population | HHI | % White | % Black | % Hispanic | % Asian |
|---|---|---|---|---|---|---|---|
| 1 | West Valley City, UT | 137,955 | 3,621 | 42.0% | 2.6% | 42.5% | 4.9% |
| 2 | South Salt Lake, UT | 26,277 | 3,672 | 52.4% | 3.0% | 28.6% | 8.8% |
| 3 | Taylorsville, UT | 59,010 | 4,381 | 60.4% | 1.4% | 26.0% | 6.6% |
| 4 | Salt Lake City, UT | 203,888 | 4,671 | 64.7% | 2.4% | 20.8% | 5.3% |
| 5 | Midvale, UT | 35,736 | 4,712 | 65.8% | 2.5% | 17.5% | 3.6% |
| 6 | Ogden, UT | 86,973 | 4,739 | 61.6% | 1.8% | 30.5% | 1.6% |
| 7 | West Jordan, UT | 116,277 | 4,870 | 65.2% | 1.2% | 24.1% | 2.7% |
| 8 | Clearfield, UT | 32,895 | 5,092 | 68.2% | 3.1% | 20.3% | 2.5% |
| 9 | Provo, UT | 114,303 | 5,441 | 71.1% | 0.9% | 18.9% | 2.2% |
| 10 | Moab, UT | 5,316 | 5,518 | 71.5% | 0.0% | 19.7% | 0.6% |
| 11 | North Salt Lake, UT | 23,239 | 5,574 | 72.5% | 0.2% | 16.4% | 4.2% |
| 12 | Orem, UT | 97,048 | 5,601 | 72.0% | 0.7% | 19.8% | 1.8% |
| 13 | Murray, UT | 49,904 | 5,704 | 73.8% | 1.7% | 14.6% | 4.7% |
| 14 | Vineyard, UT | 13,510 | 5,731 | 73.5% | 1.1% | 17.4% | 2.3% |
| 15 | Sunset, UT | 5,567 | 5,733 | 72.9% | 2.7% | 20.1% | 0.5% |
| 16 | Riverdale, UT | 9,294 | 5,741 | 72.8% | 0.3% | 20.8% | 2.0% |
| 17 | Roy, UT | 39,021 | 5,770 | 73.3% | 0.6% | 19.3% | 1.8% |
| 18 | Logan, UT | 53,923 | 5,900 | 75.1% | 1.4% | 15.3% | 3.4% |
| 19 | West Haven, UT | 19,977 | 6,051 | 75.4% | 0.6% | 18.6% | 1.7% |
| 20 | South Weber, UT | 8,037 | 6,123 | 77.2% | 0.1% | 9.5% | 1.1% |
| 21 | Heber, UT | 17,438 | 6,163 | 76.4% | 0.1% | 17.5% | 2.4% |
| 22 | Springville, UT | 35,474 | 6,189 | 76.5% | 0.3% | 17.9% | 1.1% |
| 23 | Layton, UT | 82,512 | 6,197 | 77.2% | 1.3% | 15.0% | 2.0% |
| 24 | Price, UT | 8,216 | 6,209 | 76.8% | 1.0% | 17.6% | 0.5% |
| 25 | Washington, UT | 30,686 | 6,241 | 77.1% | 0.4% | 16.7% | 1.0% |
| 26 | Roosevelt, UT | 6,960 | 6,262 | 78.1% | 0.0% | 10.5% | 0.8% |
| 27 | Payson, UT | 22,205 | 6,288 | 77.2% | 0.1% | 17.9% | 0.5% |
| 28 | Tooele, UT | 37,265 | 6,289 | 77.7% | 0.9% | 15.5% | 0.7% |
| 29 | Draper, UT | 50,159 | 6,294 | 78.6% | 1.9% | 8.1% | 5.1% |
| 30 | Sandy, UT | 94,723 | 6,329 | 78.6% | 0.6% | 11.3% | 3.5% |
| 31 | Harrisville, UT | 6,919 | 6,346 | 78.0% | 0.5% | 15.1% | 0.2% |
| 32 | Park City, UT | 8,365 | 6,351 | 77.9% | 0.9% | 16.5% | 2.7% |
| 33 | Cedar City, UT | 37,202 | 6,375 | 78.5% | 1.0% | 14.3% | 1.4% |
| 34 | South Ogden, UT | 17,563 | 6,443 | 79.0% | 1.7% | 13.6% | 1.0% |
| 35 | Santaquin, UT | 15,391 | 6,453 | 79.1% | 1.6% | 13.1% | 0.1% |
| 36 | Pleasant View, UT | 11,104 | 6,476 | 78.8% | 0.3% | 15.9% | 2.5% |
| 37 | Cedar Hills, UT | 9,945 | 6,517 | 79.3% | 0.2% | 14.7% | 0.8% |
| 38 | Clinton, UT | 23,492 | 6,555 | 80.0% | 0.3% | 11.4% | 2.6% |
| 39 | Nibley, UT | 7,651 | 6,562 | 79.5% | 0.2% | 15.2% | 1.1% |
| 40 | St. George, UT | 99,184 | 6,683 | 80.7% | 0.5% | 12.7% | 1.1% |
| 41 | South Jordan, UT | 80,331 | 6,684 | 81.0% | 0.3% | 9.2% | 4.6% |
| 42 | Herriman, UT | 57,336 | 6,686 | 80.9% | 0.7% | 10.9% | 2.5% |
| 43 | Spanish Fork, UT | 43,632 | 6,725 | 80.8% | 0.6% | 13.7% | 0.3% |
| 44 | Hyrum, UT | 10,022 | 6,729 | 80.8% | 0.0% | 13.6% | 1.0% |
| 45 | Eagle Mountain, UT | 49,514 | 6,731 | 80.9% | 0.6% | 12.9% | 0.3% |
| 46 | Vernal, UT | 10,254 | 6,755 | 81.5% | 0.2% | 8.6% | 0.0% |
| 47 | Washington Terrace, UT | 9,196 | 6,906 | 82.4% | 3.0% | 9.9% | 0.3% |
| 48 | American Fork, UT | 35,312 | 6,938 | 82.6% | 0.3% | 9.8% | 1.4% |
| 49 | Brigham City, UT | 19,796 | 6,951 | 82.6% | 0.8% | 10.6% | 0.9% |
| 50 | North Logan, UT | 11,228 | 6,958 | 82.7% | 0.0% | 9.8% | 2.9% |
| 51 | Bountiful, UT | 45,093 | 6,977 | 83.0% | 1.3% | 8.2% | 1.0% |
| 52 | Providence, UT | 8,675 | 6,980 | 82.3% | 0.1% | 14.1% | 0.5% |
| 53 | Pleasant Grove, UT | 37,544 | 6,992 | 82.9% | 0.5% | 10.4% | 2.0% |
| 54 | Saratoga Springs, UT | 44,070 | 6,992 | 82.7% | 0.1% | 11.7% | 1.4% |
| 55 | Lindon, UT | 11,594 | 7,017 | 83.3% | 0.7% | 7.6% | 2.9% |
| 56 | Santa Clara, UT | 7,891 | 7,056 | 83.3% | 0.5% | 10.1% | 2.5% |
| 57 | West Point, UT | 11,559 | 7,079 | 83.7% | 0.2% | 7.4% | 2.5% |
| 58 | Lehi, UT | 81,039 | 7,098 | 83.6% | 0.5% | 9.2% | 2.1% |
| 59 | Riverton, UT | 44,944 | 7,146 | 83.9% | 0.4% | 9.7% | 2.1% |
| 60 | Cottonwood Heights, UT | 32,984 | 7,248 | 84.7% | 0.7% | 5.6% | 4.2% |
| 61 | Hurricane, UT | 21,677 | 7,269 | 84.7% | 0.7% | 9.6% | 0.8% |
| 62 | Tremonton, UT | 10,886 | 7,323 | 84.4% | 0.0% | 14.3% | 0.5% |
| 63 | Syracuse, UT | 34,009 | 7,395 | 85.5% | 0.8% | 8.5% | 1.8% |
| 64 | Holladay, UT | 31,236 | 7,421 | 85.8% | 0.8% | 7.0% | 2.1% |
| 65 | Centerville, UT | 16,692 | 7,528 | 86.4% | 1.4% | 7.1% | 1.6% |
| 66 | Farmington, UT | 24,934 | 7,555 | 86.6% | 0.8% | 7.0% | 2.0% |
| 67 | West Bountiful, UT | 5,920 | 7,557 | 86.3% | 0.1% | 9.7% | 0.1% |
| 68 | Farr West, UT | 7,881 | 7,581 | 86.5% | 0.2% | 9.4% | 1.5% |
| 69 | Woods Cross, UT | 11,490 | 7,616 | 87.0% | 0.9% | 5.9% | 0.8% |
| 70 | Grantsville, UT | 13,637 | 7,650 | 86.9% | 0.1% | 10.1% | 1.0% |
| 71 | Bluffdale, UT | 18,168 | 7,656 | 87.2% | 0.0% | 6.3% | 1.0% |
| 72 | North Ogden, UT | 21,473 | 7,692 | 87.3% | 0.4% | 8.3% | 1.2% |
| 73 | Kaysville, UT | 32,861 | 7,804 | 88.1% | 0.5% | 5.3% | 1.4% |
| 74 | Smithfield, UT | 14,033 | 7,893 | 88.6% | 0.5% | 6.1% | 0.3% |
| 75 | Salem, UT | 9,893 | 7,914 | 88.6% | 0.3% | 6.4% | 0.2% |
| 76 | Highland, UT | 19,625 | 7,919 | 88.8% | 1.6% | 3.6% | 1.3% |
| 77 | Hooper, UT | 9,220 | 7,922 | 88.6% | 0.1% | 8.1% | 0.2% |
| 78 | Ephraim, UT | 5,805 | 8,057 | 89.6% | 2.2% | 4.5% | 1.0% |
| 79 | Ivins, UT | 9,524 | 8,080 | 89.6% | 0.2% | 6.0% | 0.8% |
| 80 | Plain City, UT | 8,101 | 8,183 | 90.3% | 0.0% | 2.8% | 0.7% |
| 81 | Alpine, UT | 10,272 | 8,259 | 90.7% | 0.2% | 4.2% | 0.8% |
| 82 | Nephi, UT | 6,700 | 8,259 | 90.7% | 1.2% | 5.4% | 0.0% |
| 83 | Perry, UT | 5,708 | 8,307 | 90.9% | 0.0% | 7.2% | 0.0% |
| 84 | Richfield, UT | 8,173 | 8,442 | 91.7% | 0.1% | 5.5% | 0.2% |
| 85 | Hyde Park, UT | 5,410 | 8,442 | 91.6% | 0.1% | 6.5% | 1.0% |
| 86 | Mapleton, UT | 12,340 | 8,665 | 93.0% | 0.6% | 3.1% | 0.0% |
| 87 | Enoch, UT | 7,856 | 8,834 | 93.9% | 0.0% | 3.4% | 0.2% |
| 88 | Fruit Heights, UT | 6,036 | 8,963 | 94.6% | 0.4% | 3.7% | 0.0% |
| 89 | Midway, UT | 6,110 | 9,358 | 96.7% | 0.0% | 1.4% | 0.0% |