Racial diversity in Utah is a mixed bag.
There are parts of Utah where there’s a high level of diversity. But where will you find the most diverse places in Utah?
To answer that question, we went to the US Census data. Using Saturday Night Science, we measured the Gini coefficient for all 90 cities in Utah to rank them from most to least diverse.
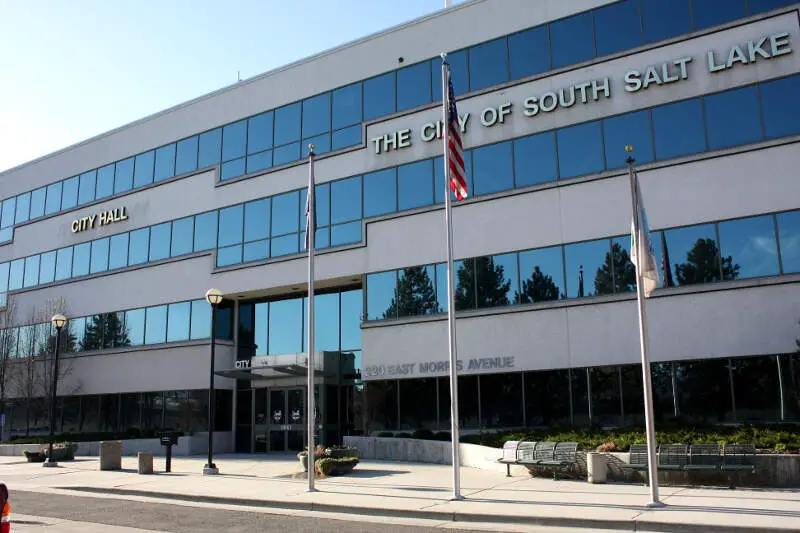
#1 most diverse in Utah
South Salt Lake is a city in Salt Lake County, Utah, United States and is part of the Salt Lake City Metropolitan Statistical Area. The population was 23,617 at the 2010 census.
Data | Crime | Cost of living | Movers
#2 most diverse in Utah
West Valley City is a city in Salt Lake County and a suburb of Salt Lake City in the U.S. state of Utah. The population was 129,480 at the 2010 census, making it the second-largest city in Utah. The city incorporated in 1980 from a large, quickly growing unincorporated area, which was variously known as Granger, Hunter, Chesterfield, and Redwood. It is home to the Maverik Center and USANA Amphitheatre.
Data | Crime | Cost of living | Movers
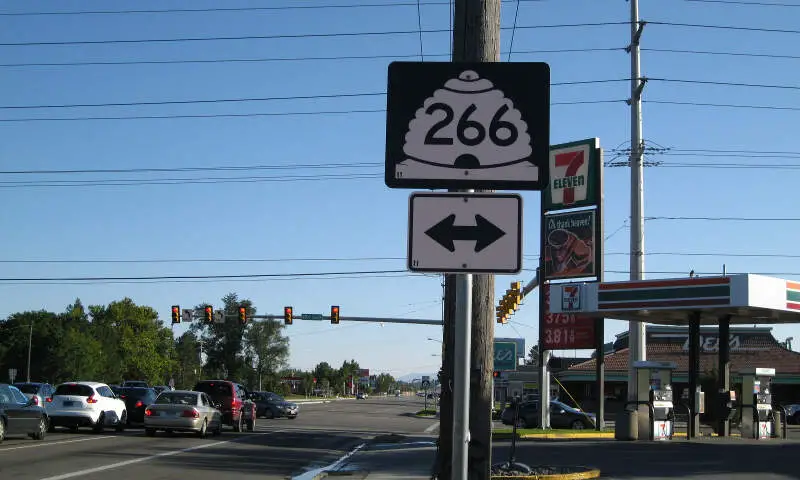
#3 most diverse in Utah
Taylorsville is a city in Salt Lake County, Utah, United States. It is part of the Salt Lake City, Utah Metropolitan Statistical Area. The population was 58,657 at the 2010 census. Taylorsville was incorporated from the Taylorsville-Bennion CDP and portions of the Kearns CDP on April 24, 1996. The city is located adjacent to interstate 215 and Bangerter Highway. It is centrally located in the middle of the Salt Lake Valley.
Data | Crime | Cost of living | Movers
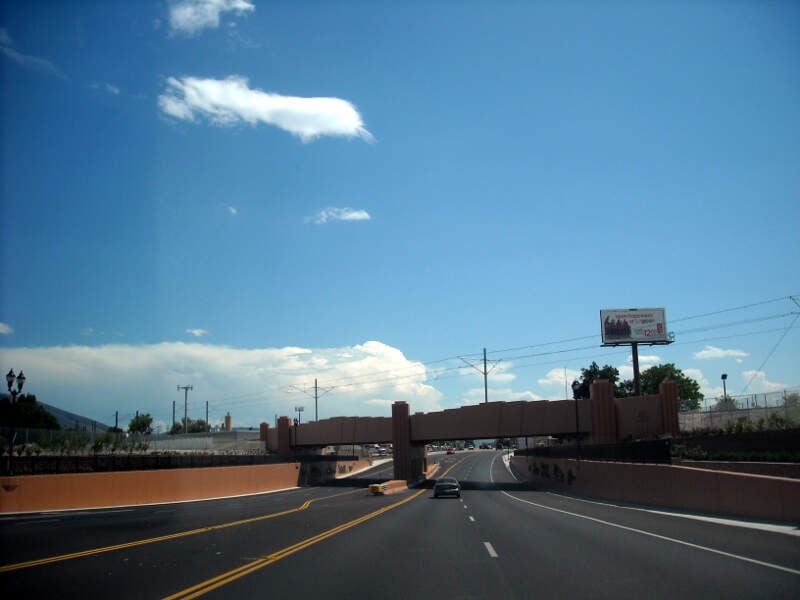
#4 most diverse in Utah
Midvale is a city in Salt Lake County, Utah, United States. It is part of the Salt Lake City, Utah Metropolitan Statistical Area. The population was 30,764 at the 2010 census.
Data | Crime | Cost of living | Movers
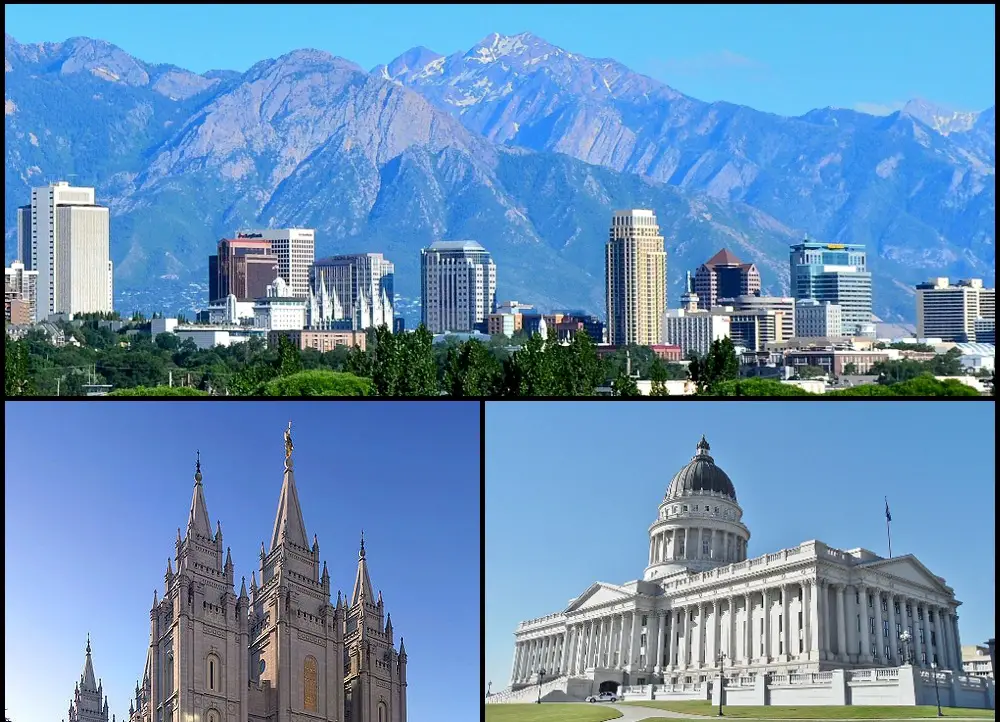
#5 most diverse in Utah
Salt Lake City is the capital and the most populous municipality of the U.S. state of Utah. With an estimated population of 190,884 in 2014, the city is the core of the Salt Lake City metropolitan area, which has a population of 1,153,340. Salt Lake City is further situated within a larger metropolis known as the Salt Lake City-Ogden-Provo Combined Statistical Area. This region is a corridor of contiguous urban and suburban development stretched along an approximately 120-mile segment of the Wasatch Front, comprising a population of 2,423,912 as of 2014. It is one of only two major urban areas in the Great Basin.
Data | Crime | Cost of living | Movers
#6 most diverse in Utah
West Jordan is a city in Salt Lake County, Utah, United States. West Jordan is a rapidly growing suburb of Salt Lake City and has a mixed economy. According to the 2010 Census, the city had a population of 103,712, placing it as the fourth most populous in the state. The city occupies the southwest end of the Salt Lake Valley at an elevation of 4,330 feet. Named after the nearby Jordan River, the limits of the city begin on the river’s western bank and end in the eastern foothills of the Oquirrh Mountains, where Kennecott Copper Mine, the world’s largest man-made excavation is located.
Data | Crime | Cost of living | Movers
#7 most diverse in Utah
Ogden is a city and the county seat of Weber County, Utah, United States, approximately 10 miles east of the Great Salt Lake and 40 miles north of Salt Lake City. The population was 84,316 in 2014, according to the US Census Bureau, making it Utah’s 7th largest city. The city served as a major railway hub through much of its history, and still handles a great deal of freight rail traffic which makes it a convenient location for manufacturing and commerce. Ogden is also known for its many historic buildings, proximity to the Wasatch Mountains, and as the location of Weber State University.
Data | Crime | Cost of living | Movers
#8 most diverse in Utah
Clearfield is a city in Davis County, Utah, United States. The population was 30,112 at the 2010 census. The city grew drastically during the 1940s, with the formation of Hill Air Force Base, and in the 1950s with the nationwide increase in suburb and “bedroom” community populations and has been steadily growing since then.
Data | Crime | Cost of living | Movers
#9 most diverse in Utah
Data | Crime | Cost of living | Movers
#10 most diverse in Utah
Riverdale is a city in Weber County, Utah, United States. The population was 7,656 at the 2000 census. It is part of the Ogden-Clearfield, Utah Metropolitan Statistical Area.
Data | Crime | Cost of living | Movers
The receipts
Compare the top ten
Pick a metric. The bars rescale. The red line is Utah’s statewide median.
On the map
Where diversity lives in Utah
Saturday Night Science
Methodology: How we determined the most diverse cities in Utah for 2026
We still believe in the accuracy of data — especially from the Census — and Saturday Night Science. So that’s where we went to get the race breakdown across Utah.
That leads us to the Census’s most recently available data, the 2020-2024 American Community Survey data from the US Census.
Specifically, we looked at table B03002: HISPANIC OR LATINO ORIGIN BY RACE. Here are the category names as defined by the Census:
- White alone*
- Black or African American alone*
- American Indian and Alaska Native alone*
- Asian alone*
- Native Hawaiian and Other Pacific Islander alone*
- Some other race alone*
- Two or more races*
- Hispanic or Latino
We limited our analysis to non-CDPs with a population greater than 5,000 people. That left us with 90 cities.
We then calculated the HHI for each city by finding the racial breakdown of a city in percent terms, squaring them, and then adding the squares together. This left us with scores ranging from 3,490 (South Salt Lake) to 9,029 (Fruit Heights).
Finally, we ranked each city based on the HHI, with a lower score being more diverse than a high score. South Salt Lake took the distinction of being the most diverse, while Fruit Heights was the least diverse city.
We updated this article for 2026. This report is our eleventh time ranking the most diverse places in Utah.
The full plate
Race By City In Utah For 2026
Click any column to sort. Search by city name.
| Rank | City | Population | HHI | % White | % Black | % Hispanic | % Asian |
|---|---|---|---|---|---|---|---|
| 1 | South Salt Lake | 26,352 | 3,490 | 50.5% | 3.2% | 27.8% | 11.7% |
| 2 | West Valley City | 138,437 | 3,571 | 40.3% | 2.3% | 43.3% | 5.3% |
| 3 | Taylorsville | 58,678 | 4,380 | 60.4% | 2.3% | 26.1% | 5.1% |
| 4 | Midvale | 35,989 | 4,608 | 64.5% | 1.6% | 19.4% | 4.5% |
| 5 | Salt Lake City | 208,007 | 4,637 | 64.4% | 2.3% | 20.8% | 4.9% |
| 6 | West Jordan | 116,692 | 4,678 | 63.2% | 1.2% | 25.4% | 3.4% |
| 7 | Ogden | 87,413 | 4,726 | 61.2% | 1.8% | 31.1% | 1.4% |
| 8 | Clearfield | 33,523 | 4,974 | 67.1% | 2.5% | 20.8% | 2.8% |
| 9 | North Salt Lake | 23,474 | 5,208 | 69.4% | 0.4% | 18.2% | 4.8% |
| 10 | Riverdale | 9,279 | 5,406 | 68.9% | 0.2% | 25.4% | 1.8% |
| 11 | Provo | 114,766 | 5,417 | 70.8% | 1.1% | 19.2% | 2.2% |
| 12 | Moab | 5,312 | 5,436 | 71.1% | 0.0% | 18.6% | 1.7% |
| 13 | Murray | 50,188 | 5,501 | 72.3% | 1.8% | 14.9% | 5.0% |
| 14 | Orem | 97,182 | 5,542 | 71.7% | 0.7% | 19.4% | 2.0% |
| 15 | Vineyard | 14,446 | 5,631 | 72.7% | 0.5% | 18.0% | 1.6% |
| 16 | Sunset | 5,587 | 5,658 | 72.4% | 2.9% | 20.0% | 0.1% |
| 17 | Springville | 35,849 | 5,671 | 71.8% | 0.5% | 22.5% | 1.1% |
| 18 | Logan | 54,907 | 5,784 | 74.2% | 1.6% | 15.4% | 3.2% |
| 19 | Roy | 38,993 | 5,822 | 73.6% | 0.6% | 19.5% | 1.8% |
| 20 | West Haven | 21,563 | 6,070 | 75.7% | 1.1% | 18.2% | 2.0% |
| 21 | Draper | 50,278 | 6,070 | 77.0% | 1.8% | 8.1% | 6.2% |
| 22 | Tooele | 38,405 | 6,103 | 76.1% | 1.1% | 17.1% | 0.5% |
| 23 | Layton | 83,286 | 6,109 | 76.5% | 1.2% | 15.5% | 1.9% |
| 24 | Price | 8,248 | 6,196 | 76.8% | 1.1% | 16.8% | 0.4% |
| 25 | Clinton | 23,612 | 6,211 | 77.6% | 0.2% | 12.0% | 3.2% |
| 26 | Harrisville | 6,935 | 6,213 | 77.0% | 0.6% | 15.3% | 0.2% |
| 26 | Park City | 8,362 | 6,213 | 77.2% | 0.8% | 14.8% | 2.3% |
| 28 | Sandy | 94,291 | 6,228 | 77.9% | 0.5% | 11.4% | 3.6% |
| 29 | Payson | 23,039 | 6,231 | 76.8% | 1.1% | 17.9% | 0.2% |
| 30 | Cedar City | 38,524 | 6,249 | 77.7% | 1.1% | 14.3% | 1.8% |
| 31 | Pleasant View | 11,217 | 6,291 | 77.9% | 0.6% | 14.2% | 4.3% |
| 32 | Heber | 18,015 | 6,292 | 77.1% | 0.3% | 18.3% | 1.3% |
| 33 | South Jordan | 82,686 | 6,295 | 78.4% | 1.1% | 9.9% | 4.9% |
| 34 | Roosevelt | 7,078 | 6,303 | 78.4% | 0.1% | 10.9% | 0.8% |
| 35 | Vernal | 10,392 | 6,326 | 78.5% | 0.2% | 10.7% | 0.1% |
| 36 | Nibley | 7,952 | 6,408 | 78.8% | 0.3% | 12.4% | 1.3% |
| 37 | Washington Terrace | 9,182 | 6,445 | 79.3% | 3.6% | 11.5% | 0.5% |
| 37 | St. George | 101,995 | 6,445 | 78.9% | 0.5% | 14.1% | 1.3% |
| 39 | Saratoga Springs | 48,425 | 6,497 | 79.2% | 0.2% | 14.2% | 1.5% |
| 40 | Herriman | 59,346 | 6,507 | 79.6% | 0.8% | 12.2% | 2.0% |
| 41 | South Ogden | 17,650 | 6,548 | 79.7% | 1.3% | 13.2% | 0.7% |
| 42 | Brigham City | 19,992 | 6,575 | 79.9% | 0.7% | 12.8% | 0.4% |
| 43 | Pleasant Grove | 37,852 | 6,608 | 80.1% | 0.4% | 13.1% | 2.2% |
| 44 | Spanish Fork | 44,946 | 6,628 | 80.0% | 0.7% | 14.4% | 0.4% |
| 45 | Lehi | 85,173 | 6,635 | 80.7% | 0.6% | 9.4% | 2.5% |
| 46 | Eagle Mountain | 53,290 | 6,672 | 80.5% | 0.5% | 12.9% | 0.3% |
| 47 | Santaquin | 16,436 | 6,718 | 80.8% | 1.5% | 13.2% | 0.2% |
| 48 | Washington | 32,348 | 6,720 | 80.8% | 0.4% | 13.5% | 0.7% |
| 49 | American Fork | 37,109 | 6,728 | 81.2% | 0.3% | 10.7% | 1.6% |
| 50 | Cedar Hills | 9,950 | 6,733 | 81.1% | 0.2% | 11.4% | 1.1% |
| 51 | Lindon | 11,765 | 6,798 | 81.6% | 0.7% | 10.9% | 2.5% |
| 52 | North Logan | 11,460 | 6,801 | 81.6% | 0.1% | 11.2% | 2.5% |
| 53 | South Weber | 8,115 | 6,834 | 82.1% | 0.1% | 6.7% | 1.6% |
| 54 | Hyrum | 10,401 | 6,839 | 81.4% | 0.0% | 14.2% | 0.1% |
| 55 | Woods Cross | 11,531 | 6,866 | 82.2% | 1.1% | 9.7% | 0.8% |
| 56 | Riverton | 45,457 | 6,868 | 82.1% | 0.3% | 10.5% | 2.0% |
| 57 | Bountiful | 45,023 | 6,956 | 82.8% | 1.2% | 8.3% | 0.8% |
| 58 | Bluffdale | 18,797 | 6,966 | 82.8% | 0.6% | 9.1% | 0.7% |
| 59 | Hurricane | 22,771 | 7,031 | 83.1% | 0.4% | 10.2% | 1.2% |
| 60 | West Point | 11,929 | 7,067 | 83.6% | 0.3% | 6.8% | 1.7% |
| 61 | Holladay | 31,099 | 7,167 | 84.2% | 0.7% | 8.0% | 3.2% |
| 62 | Santa Clara | 8,152 | 7,189 | 84.1% | 0.2% | 10.1% | 2.5% |
| 63 | Grantsville | 14,341 | 7,235 | 84.3% | 0.2% | 11.2% | 1.1% |
| 64 | Ephraim | 5,949 | 7,246 | 84.5% | 2.3% | 9.6% | 1.1% |
| 65 | Syracuse | 35,488 | 7,286 | 84.9% | 1.2% | 8.5% | 1.9% |
| 66 | Cottonwood Heights | 32,828 | 7,388 | 85.6% | 0.7% | 5.8% | 3.6% |
| 67 | Providence | 8,947 | 7,397 | 85.1% | 0.0% | 12.1% | 0.1% |
| 68 | Highland | 20,119 | 7,409 | 85.8% | 1.5% | 4.1% | 1.7% |
| 69 | Tremonton | 11,477 | 7,495 | 85.5% | 0.0% | 13.3% | 0.5% |
| 70 | Farmington | 25,389 | 7,524 | 86.3% | 0.5% | 7.9% | 1.4% |
| 71 | Centerville | 16,679 | 7,547 | 86.6% | 1.7% | 6.6% | 1.5% |
| 72 | Kaysville | 33,053 | 7,557 | 86.6% | 0.8% | 6.3% | 1.5% |
| 73 | North Ogden | 21,947 | 7,609 | 86.8% | 0.6% | 8.5% | 1.4% |
| 74 | Hooper | 9,338 | 7,622 | 86.8% | 0.3% | 8.9% | 0.2% |
| 75 | Smithfield | 14,408 | 7,705 | 87.3% | 0.4% | 8.2% | 0.4% |
| 76 | Hyde Park | 5,540 | 7,733 | 87.5% | 0.1% | 8.5% | 1.8% |
| 77 | Alpine | 10,392 | 7,769 | 87.8% | 0.5% | 5.9% | 1.4% |
| 78 | Farr West | 7,952 | 7,783 | 87.8% | 0.1% | 7.9% | 1.8% |
| 79 | Ivins | 9,998 | 7,887 | 88.5% | 0.1% | 7.0% | 0.9% |
| 80 | Plain City | 8,396 | 7,893 | 88.6% | 0.0% | 3.9% | 1.0% |
| 81 | Salem | 10,324 | 7,949 | 88.8% | 0.3% | 6.7% | 0.1% |
| 82 | Nephi | 6,885 | 8,058 | 89.5% | 1.3% | 5.9% | 0.0% |
| 83 | Kanab | 5,081 | 8,252 | 90.6% | 0.3% | 5.7% | 0.0% |
| 84 | Mapleton | 13,114 | 8,282 | 90.9% | 1.1% | 3.1% | 0.7% |
| 85 | Richfield | 8,224 | 8,452 | 91.8% | 0.2% | 4.9% | 0.3% |
| 86 | Perry | 5,843 | 8,542 | 92.3% | 0.3% | 4.6% | 0.1% |
| 87 | Midway | 6,171 | 8,559 | 92.4% | 0.0% | 3.5% | 0.3% |
| 88 | West Bountiful | 5,915 | 8,566 | 92.3% | 0.1% | 6.1% | 0.1% |
| 89 | Enoch | 8,144 | 8,677 | 93.0% | 0.0% | 5.2% | 0.0% |
| 90 | Fruit Heights | 6,023 | 9,029 | 95.0% | 0.4% | 3.0% | 0.6% |
Source: U.S. Census ACS 2020-2024. 90 cities with more than 5,000 residents.
Summary
Summary: Diversity Across Utah
If you’re looking for a scientific breakdown of diversity across Utah, this is an accurate list.
The most diverse cities in Utah are South Salt Lake, West Valley City, Taylorsville, Midvale, Salt Lake City, West Jordan, Ogden, Clearfield, North Salt Lake, and Riverdale.


