

Before you decide to relocate to Missouri, it’s important to research the exact cost of living around the state. And that’s what we’re going to help you do.
These are the places in Missouri that cost a pretty penny — the most expensive cities in the state.
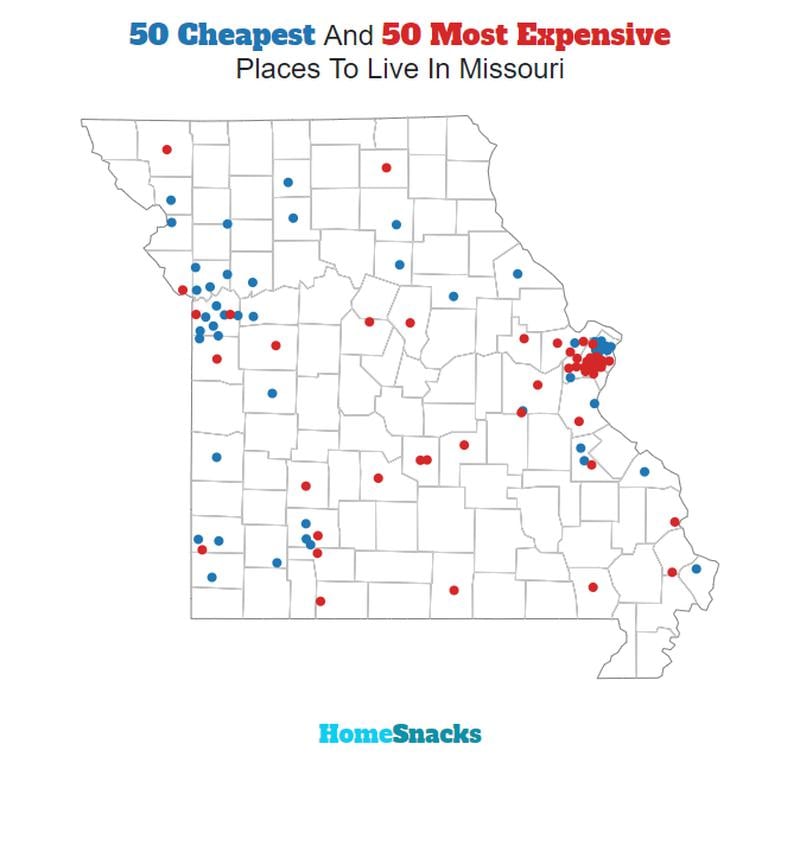
We used Saturday Night Science to compare the 2019-2023 American Community Survey on cost of living for the 127 places in Missouri with more than 5,000 people.
After we saved up for months and could finally afford it, we landed on this list of the ten most expensive cities in Missouri for 2025.
Table Of Contents: Top Ten | Methodology | Summary | Table
The 10 Most Expensive Places To Live In Missouri For 2025
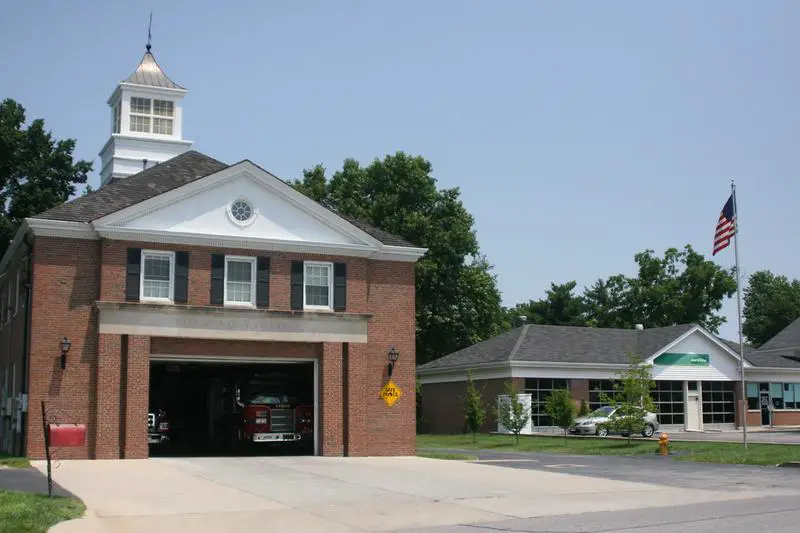
What’s the most expensive place to live in Missouri? Well, HomeSnacks crunched the numbers and discovered that Ladue is the most expensive place to live in Missouri.
Park Hills (the cheapest place to live in Missouri) can show these guys how to live on a budget in the coming years. Read on for how these places had costs rise faster than inflation.
And if you already knew these places were expensive, check out some more reading about Missouri and the most expensive cities in the country:
The 10 Most Expensive Places To Live In Missouri For 2025

/10
Population: 8,948
Cost Of Living Index: 169
Median Income: $250,001
Average Home Price: $1,027,000
Home Price To Income Ratio: 4.1x
More on Ladue: Data
The overall cost of living in Ladue is 169. The median income in Ladue comes in at $250,001 and the average home value is $1,027,000 for 2025.

/10
Population: 11,605
Cost Of Living Index: 147
Median Income: $237,083
Average Home Price: $895,000
Home Price To Income Ratio: 3.8x
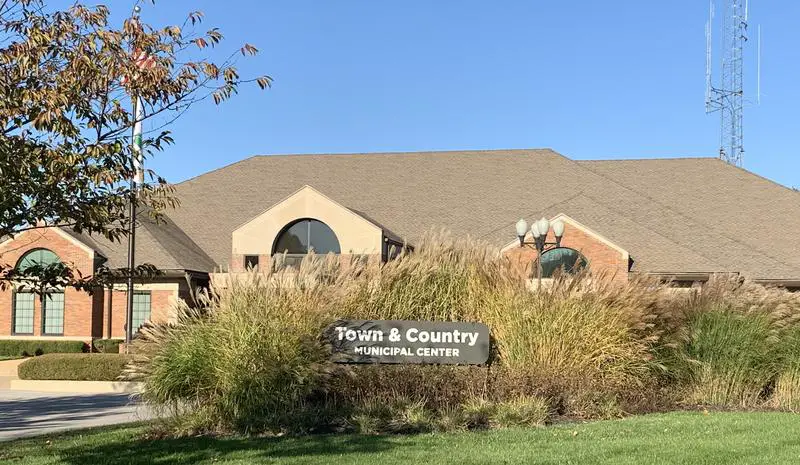
More on Town And Country: Data
The overall cost of living in Town And Country is 147. The median income in Town And Country comes in at $237,083 and the average home value is $895,000 for 2025.

/10
Population: 17,282
Cost Of Living Index: 142
Median Income: $128,898
Average Home Price: $799,200
Home Price To Income Ratio: 6.2x
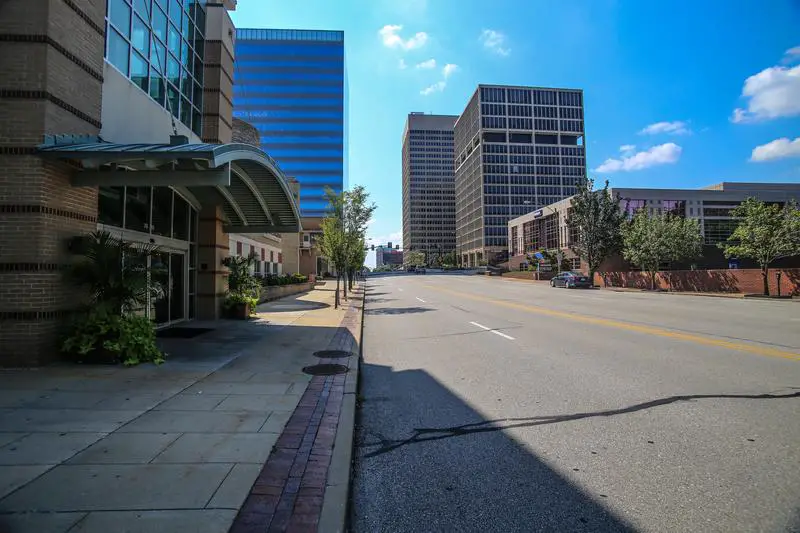
More on Clayton: Data
The overall cost of living in Clayton is 142. The median income in Clayton comes in at $128,898 and the average home value is $799,200 for 2025.

/10
Population: 9,145
Cost Of Living Index: 125
Median Income: $214,167
Average Home Price: $591,800
Home Price To Income Ratio: 2.8x
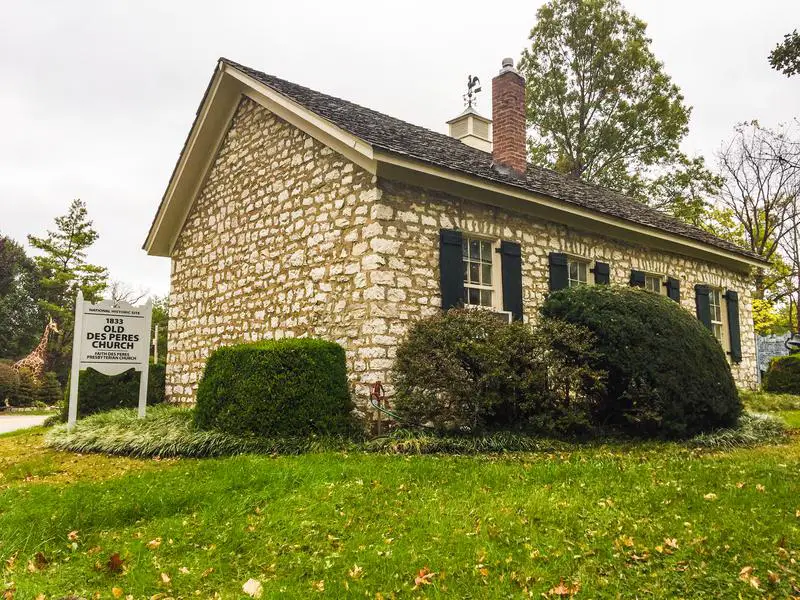
More on Des Peres: Data
The overall cost of living in Des Peres is 125. The median income in Des Peres comes in at $214,167 and the average home value is $591,800 for 2025.

/10
Population: 9,113
Cost Of Living Index: 120
Median Income: $133,895
Average Home Price: $522,300
Home Price To Income Ratio: 3.9x
More on Sunset Hills: Data
The overall cost of living in Sunset Hills is 120. The median income in Sunset Hills comes in at $133,895 and the average home value is $522,300 for 2025.

/10
Population: 5,291
Cost Of Living Index: 117
Median Income: $155,081
Average Home Price: $523,300
Home Price To Income Ratio: 3.4x
More on Weldon Spring: Data
The overall cost of living in Weldon Spring is 117. The median income in Weldon Spring comes in at $155,081 and the average home value is $523,300 for 2025.

/10
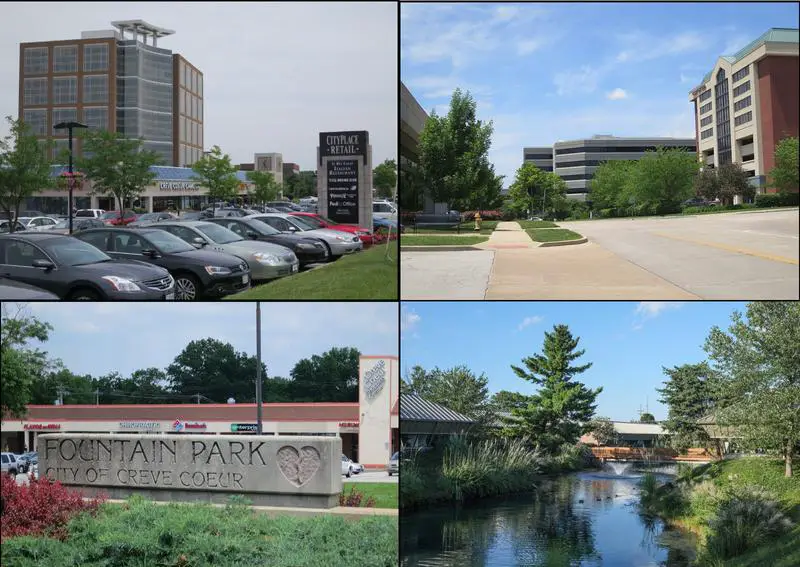
Population: 18,643
Cost Of Living Index: 116
Median Income: $119,454
Average Home Price: $566,100
Home Price To Income Ratio: 4.7x
More on Creve Coeur: Data
The overall cost of living in Creve Coeur is 116. The median income in Creve Coeur comes in at $119,454 and the average home value is $566,100 for 2025.

/10
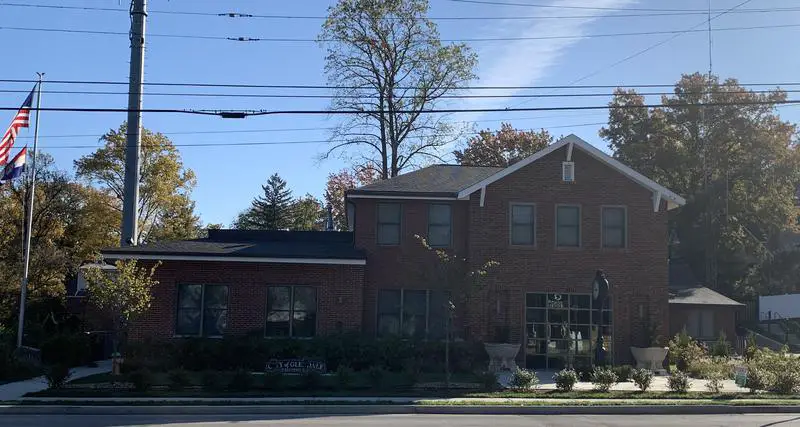
Population: 6,111
Cost Of Living Index: 116
Median Income: $168,750
Average Home Price: $510,100
Home Price To Income Ratio: 3.0x
More on Glendale: Data
The overall cost of living in Glendale is 116. The median income in Glendale comes in at $168,750 and the average home value is $510,100 for 2025.

/10
Population: 35,168
Cost Of Living Index: 115
Median Income: $157,750
Average Home Price: $472,800
Home Price To Income Ratio: 3.0x
More on Wildwood: Data
The overall cost of living in Wildwood is 115. The median income in Wildwood comes in at $157,750 and the average home value is $472,800 for 2025.


/10
Population: 49,591
Cost Of Living Index: 114
Median Income: $133,380
Average Home Price: $458,000
Home Price To Income Ratio: 3.4x
More on Chesterfield: Data
The overall cost of living in Chesterfield is 114. The median income in Chesterfield comes in at $133,380 and the average home value is $458,000 for 2025.
Methodology: How We Determined The Most Expensive Places To Live In The Show Me State For 2025
The two most important things to think about when it comes to being able to afford a city in Missouri are:
- How much money do I make?
- How much do I have to spend to live there?
You need to understand your costs in the context of how much money you make.
For example, if the median household earns $100,000 and spends $40,000 on housing, it’s actually cheaper to live there than a place with a median income of $50,000 and housing costs of $21,000. You might spend more on housing, but you have more money overall to play with.
With that example in mind, we derived several statistics from the latest Census American Community Survey 2019-2023 around incomes and costs. They are:
- Overall Cost Of Living Index
- Median Home Price / Median Income (lower is better)
- Median Income / Median Rent (Higher is better)
- Median Home Price
You can then compare these metrics in each of the places in Missouri to figure out which is the most expensive.
You are left with a “Cost of Living Index” by taking the average rank of each of these metrics for each city.
So we used that cost of living index to rank all of the 127 places in Missouri that have more than 5,000 people.
The place with the highest cost of living in Missouri according to the data is Ladue. We updated this article for 2025. This article is our tenth time ranking the most expensive places to live in Missouri.
Summary: Taking A Chunk Out Of Your Paycheck In Missouri For 2025
Well, there you have it, the places in Missouri that have the highest cost of living, with Ladue ranking as the most expensive city in the Show Me State.
The most expensive cities in Missouri are Ladue, Town and Country, Clayton, Des Peres, Sunset Hills, Weldon Spring, Creve Coeur, Glendale, Wildwood, and Chesterfield.
Here’s a look at the most affordable cities in Missouri according to the data:
- Park Hills
- Jennings
- St. Ann
For more Missouri reading, check out:
- Best Places To Live In Missouri
- Cheapest Places To Live In Missouri
- Most Dangerous Cities in Missouri
- Best Places To Raise A Family In Missouri
- Safest Places In Missouri
- Worst Places To Live In Missouri
Most Expensive Cities In Missouri
| Rank | City | Cost Of Living | Population | Median Income | Average Home Price | Home/Income Ratio |
|---|---|---|---|---|---|---|
| 1 | Ladue | 169 | 8,948 | $250,001 | $1,027,000 | 4.1x |
| 2 | Town and Country | 147 | 11,605 | $237,083 | $895,000 | 3.8x |
| 3 | Clayton | 142 | 17,282 | $128,898 | $799,200 | 6.2x |
| 4 | Des Peres | 125 | 9,145 | $214,167 | $591,800 | 2.8x |
| 5 | Sunset Hills | 120 | 9,113 | $133,895 | $522,300 | 3.9x |
| 6 | Weldon Spring | 117 | 5,291 | $155,081 | $523,300 | 3.4x |
| 7 | Creve Coeur | 116 | 18,643 | $119,454 | $566,100 | 4.7x |
| 8 | Glendale | 116 | 6,111 | $168,750 | $510,100 | 3.0x |
| 9 | Wildwood | 115 | 35,168 | $157,750 | $472,800 | 3.0x |
| 10 | Chesterfield | 114 | 49,591 | $133,380 | $458,000 | 3.4x |
| 11 | Dardenne Prairie | 113 | 13,137 | $155,585 | $392,300 | 2.5x |
| 12 | Parkville | 110 | 8,022 | $170,794 | $557,100 | 3.3x |
| 13 | Olivette | 106 | 8,539 | $105,898 | $450,100 | 4.3x |
| 14 | Cottleville | 105 | 5,750 | $114,420 | $381,900 | 3.3x |
| 15 | Kirkwood | 104 | 29,302 | $117,439 | $421,500 | 3.6x |
| 16 | Webster Groves | 104 | 23,771 | $110,716 | $371,400 | 3.4x |
| 17 | Lake St. Louis | 102 | 17,538 | $123,427 | $375,300 | 3.0x |
| 18 | University City | 101 | 34,655 | $76,466 | $285,100 | 3.7x |
| 19 | Richmond Heights | 101 | 9,179 | $90,670 | $345,400 | 3.8x |
| 20 | Ellisville | 100 | 9,908 | $105,276 | $347,300 | 3.3x |
| 21 | Columbia | 99 | 127,200 | $64,488 | $268,300 | 4.2x |
| 22 | Ballwin | 99 | 30,835 | $121,170 | $353,400 | 2.9x |
| 23 | Eureka | 99 | 12,371 | $108,947 | $352,200 | 3.2x |
| 24 | Brentwood | 99 | 8,151 | $86,641 | $276,100 | 3.2x |
| 25 | O’Fallon | 97 | 92,697 | $107,203 | $305,100 | 2.8x |
| 26 | Manchester | 97 | 18,189 | $92,839 | $298,400 | 3.2x |
| 27 | Wentzville | 96 | 45,734 | $111,409 | $302,700 | 2.7x |
| 28 | Raymore | 96 | 23,849 | $103,158 | $318,000 | 3.1x |
| 29 | Jackson | 96 | 15,532 | $80,435 | $227,600 | 2.8x |
| 30 | Lee’s Summit | 95 | 102,583 | $104,989 | $313,200 | 3.0x |
| 31 | St. Charles | 93 | 71,048 | $85,522 | $280,800 | 3.3x |
| 32 | Liberty | 93 | 30,446 | $95,425 | $267,900 | 2.8x |
| 33 | Crestwood | 93 | 12,298 | $115,512 | $291,400 | 2.5x |
| 34 | Kearney | 93 | 10,696 | $102,523 | $275,200 | 2.7x |
| 35 | Smithville | 93 | 10,552 | $99,925 | $272,500 | 2.7x |
| 36 | Shrewsbury | 93 | 6,328 | $84,942 | $266,600 | 3.1x |
| 37 | St. Robert | 93 | 5,327 | $60,219 | $225,100 | 3.7x |
| 38 | Jefferson City | 92 | 42,565 | $67,205 | $208,000 | 3.1x |
| 39 | Grain Valley | 92 | 15,967 | $87,266 | $269,800 | 3.1x |
| 40 | Valley Park | 92 | 6,817 | $64,470 | $232,900 | 3.6x |
| 41 | Blue Springs | 91 | 59,416 | $84,075 | $241,500 | 2.9x |
| 42 | St. Peters | 91 | 58,200 | $89,827 | $252,800 | 2.8x |
| 43 | Cape Girardeau | 91 | 40,047 | $54,870 | $186,100 | 3.4x |
| 44 | Greenwood | 91 | 6,000 | $104,638 | $263,300 | 2.5x |
| 45 | Kansas City | 90 | 508,233 | $67,449 | $227,000 | 3.4x |
| 46 | Maryland Heights | 90 | 27,981 | $86,485 | $215,300 | 2.5x |
| 47 | Rolla | 90 | 20,144 | $42,518 | $177,400 | 4.2x |
| 48 | Bridgeton | 90 | 11,372 | $73,320 | $234,100 | 3.2x |
| 49 | Maryville | 90 | 10,556 | $48,099 | $178,900 | 3.7x |
| 50 | Perryville | 90 | 8,530 | $53,958 | $184,700 | 3.4x |
| 51 | Gladstone | 89 | 27,069 | $72,134 | $217,900 | 3.0x |
| 52 | Ozark | 89 | 21,953 | $69,372 | $230,600 | 3.3x |
| 53 | Warrensburg | 89 | 19,437 | $57,232 | $216,900 | 3.8x |
| 54 | Washington | 89 | 14,948 | $78,510 | $217,500 | 2.8x |
| 55 | Pleasant Hill | 89 | 8,853 | $94,840 | $245,400 | 2.6x |
| 56 | Maplewood | 89 | 8,154 | $65,510 | $231,500 | 3.5x |
| 57 | Battlefield | 89 | 6,095 | $87,414 | $207,100 | 2.4x |
| 58 | Arnold | 88 | 20,884 | $75,194 | $209,700 | 2.8x |
| 59 | Republic | 88 | 19,233 | $64,364 | $190,300 | 3.0x |
| 60 | Troy | 88 | 13,467 | $75,777 | $212,100 | 2.8x |
| 61 | Branson | 88 | 12,760 | $54,961 | $237,900 | 4.3x |
| 62 | Harrisonville | 88 | 10,002 | $60,727 | $190,300 | 3.1x |
| 63 | Carl Junction | 88 | 8,257 | $77,855 | $206,400 | 2.7x |
| 64 | Waynesville | 88 | 5,422 | $75,179 | $204,100 | 2.7x |
| 65 | Belton | 87 | 24,618 | $70,525 | $185,400 | 2.6x |
| 66 | Sikeston | 87 | 16,231 | $53,203 | $158,100 | 3.0x |
| 67 | Oak Grove | 87 | 8,477 | $73,237 | $190,800 | 2.6x |
| 68 | Dexter | 87 | 7,906 | $47,647 | $132,700 | 2.8x |
| 69 | Boonville | 87 | 7,682 | $51,321 | $173,400 | 3.4x |
| 70 | Pacific | 87 | 7,299 | $57,119 | $244,000 | 4.3x |
| 71 | Peculiar | 87 | 5,815 | $96,250 | $252,400 | 2.6x |
| 72 | Marshall | 86 | 13,699 | $54,815 | $145,900 | 2.7x |
| 73 | Festus | 86 | 12,965 | $70,085 | $206,200 | 2.9x |
| 74 | Fulton | 86 | 12,611 | $55,015 | $144,500 | 2.6x |
| 75 | Willard | 86 | 6,418 | $87,204 | $204,300 | 2.3x |
| 76 | Raytown | 85 | 29,593 | $67,227 | $162,000 | 2.4x |
| 77 | Nixa | 85 | 24,131 | $80,491 | $238,300 | 3.0x |
| 78 | Kirksville | 85 | 17,493 | $48,063 | $145,300 | 3.0x |
| 79 | Hannibal | 85 | 16,825 | $54,071 | $126,300 | 2.3x |
| 80 | Poplar Bluff | 85 | 16,243 | $42,035 | $109,700 | 2.6x |
| 81 | Moberly | 85 | 13,634 | $43,231 | $140,000 | 3.2x |
| 82 | Bolivar | 85 | 10,996 | $44,603 | $188,700 | 4.2x |
| 83 | Cameron | 85 | 8,721 | $56,090 | $178,300 | 3.2x |
| 84 | Pevely | 85 | 6,037 | $64,660 | $203,700 | 3.2x |
| 85 | St. Louis | 84 | 293,109 | $55,279 | $185,100 | 3.3x |
| 86 | Springfield | 84 | 169,432 | $45,984 | $165,200 | 3.6x |
| 87 | Independence | 84 | 121,944 | $59,480 | $166,400 | 2.8x |
| 88 | Florissant | 84 | 51,915 | $66,344 | $136,200 | 2.1x |
| 89 | Grandview | 84 | 25,821 | $53,431 | $171,200 | 3.2x |
| 90 | Hazelwood | 84 | 25,214 | $55,930 | $154,900 | 2.8x |
| 91 | Odessa | 84 | 5,589 | $85,592 | $209,600 | 2.4x |
| 92 | Macon | 84 | 5,457 | $51,103 | $133,800 | 2.6x |
| 93 | Union | 83 | 12,560 | $71,760 | $199,100 | 2.8x |
| 94 | Mexico | 83 | 11,487 | $48,873 | $117,600 | 2.4x |
| 95 | Excelsior Springs | 83 | 10,502 | $74,056 | $174,000 | 2.3x |
| 96 | Clinton | 83 | 9,047 | $50,852 | $147,700 | 2.9x |
| 97 | Warrenton | 83 | 8,870 | $64,400 | $193,100 | 3.0x |
| 98 | Marshfield | 83 | 7,599 | $67,134 | $201,300 | 3.0x |
| 99 | Black Jack | 83 | 6,606 | $65,920 | $187,600 | 2.8x |
| 100 | St. Joseph | 82 | 71,542 | $55,578 | $144,200 | 2.6x |