Before you decide to relocate to Utah, it’s important to research the exact cost of living around the state. And that’s what we’re going to help you do.
These are the places in Utah that cost a pretty penny — the most expensive cities in the state.
We used Saturday Night Science to compare the 2020-2024 American Community Survey on cost of living for the 90 places in Utah with more than 5,000 people.
After we saved up for months and could finally afford it, we landed on this list of the ten most expensive cities in Utah for 2026.
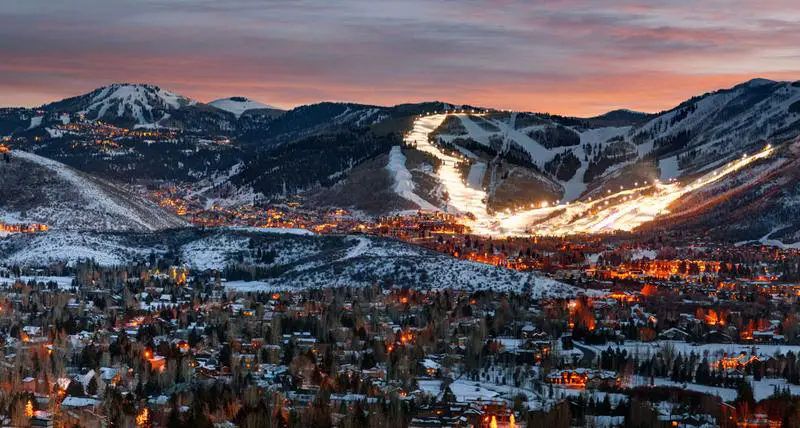
$133,558 median income · $1,588,140 median home · #1 home prices in Utah
Park City is a city in Summit County, Utah, United States. It is considered to be part of the Wasatch Back. The city is 32 miles southeast of downtown Salt Lake City and 20 miles from Salt Lake City’s east edge of Sugar House along Interstate 80. The population was 7,558 at the 2010 census. On average, the tourist population greatly exceeds the number of permanent residents.
Data | Crime | Cost of living | Movers
$168,929 median income · $1,172,442 median home · #2 home prices in Utah
Data | Crime | Cost of living | Movers
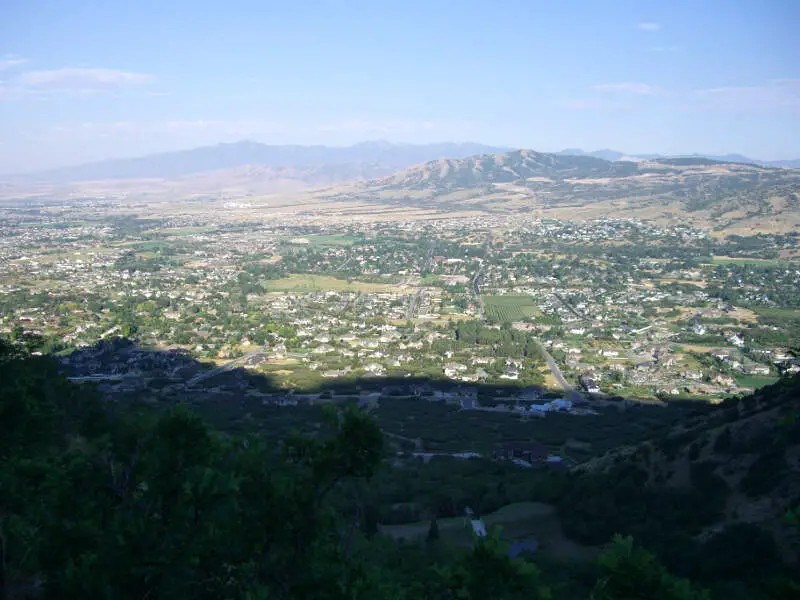
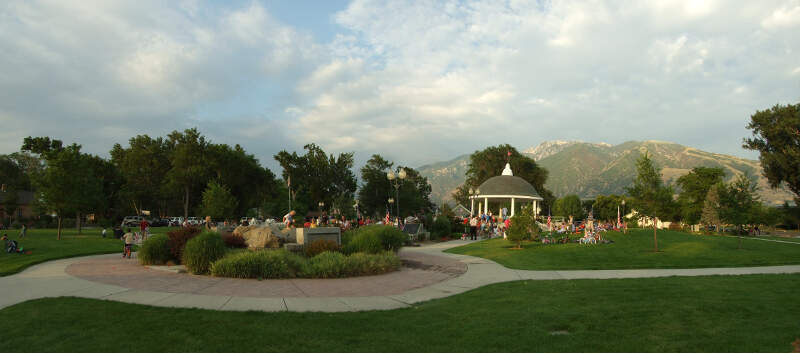
$186,075 median income · $971,050 median home · #3 home prices in Utah
Highland is a city in Utah County, Utah, United States. It is approximately 30 miles south of Salt Lake City and is part of the Provo-Orem Metropolitan Statistical Area. According to the 2010 census the population was 15,523, a 90.0% increase over the 2000 figure of 8,172.
Data | Crime | Cost of living | Movers
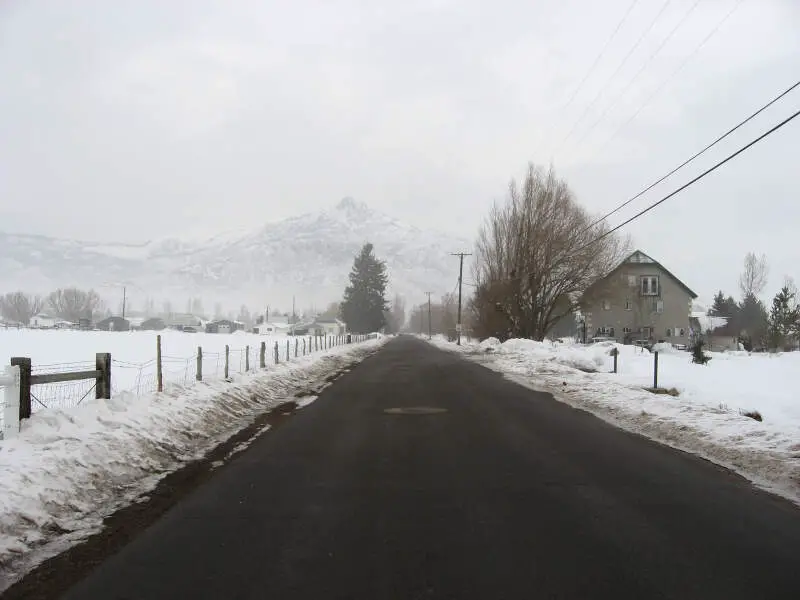
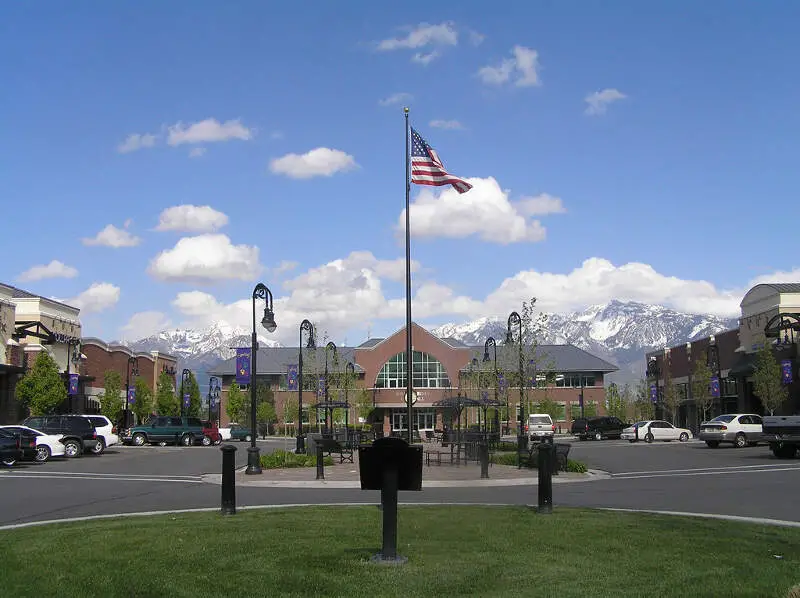
$157,065 median income · $934,920 median home · #4 home prices in Utah
Data | Crime | Cost of living | Movers
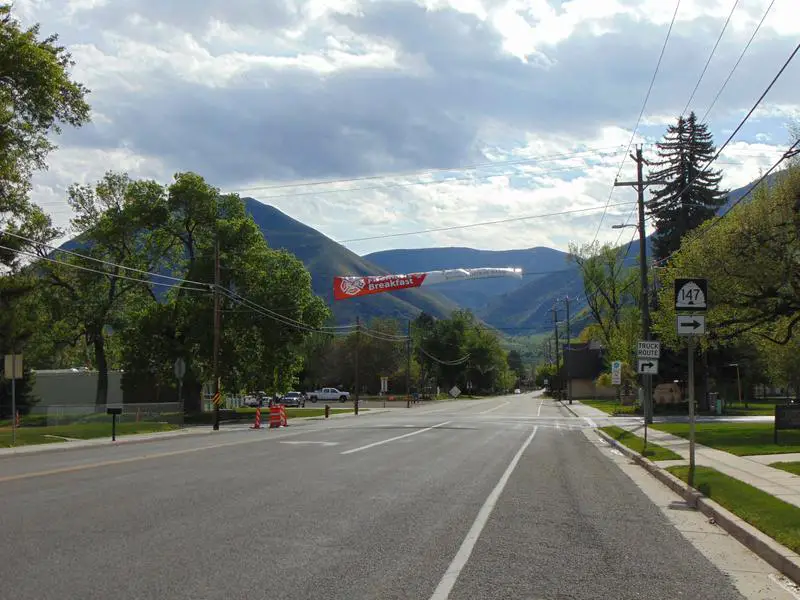
$128,910 median income · $806,898 median home · #6 home prices in Utah
Draper is a city in Salt Lake and Utah counties in the U.S. state of Utah, located about 20 miles south of Salt Lake City along the Wasatch Front. As of the 2010 census, it had a population of 42,274, having grown from 7,143 in 1990.
Data | Crime | Cost of living | Movers
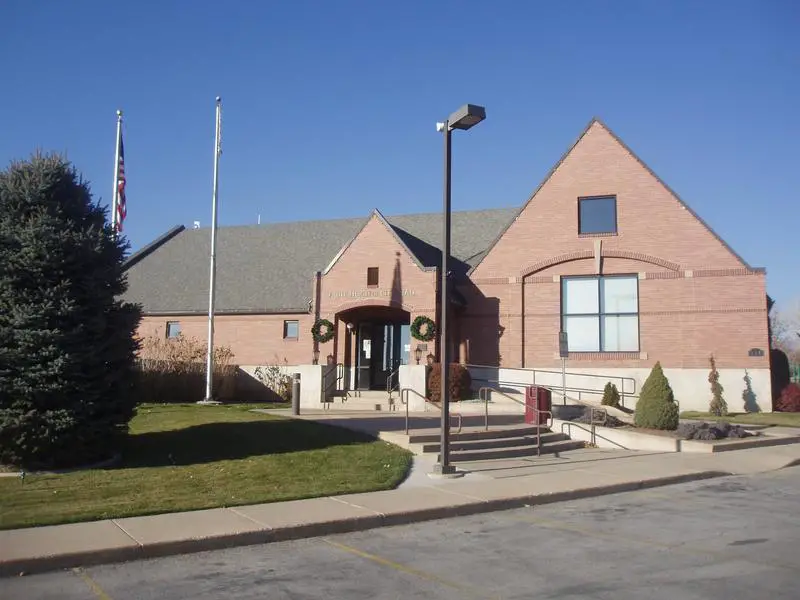
$129,531 median income · $612,682 median home · #23 home prices in Utah
Bluffdale is a city in Salt Lake County in the U.S. state of Utah, located about 20 miles south of Salt Lake City. As of the 2010 census, the city population was 7,598.
Data | Crime | Cost of living | Movers
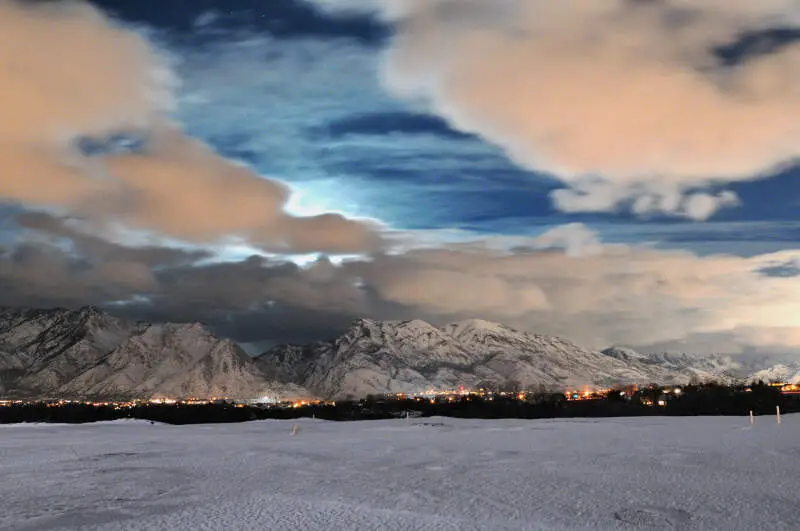
$117,043 median income · $832,130 median home · #5 home prices in Utah
Holladay is a city in Salt Lake County, Utah, United States. It is part of the Salt Lake City, Utah Metropolitan Statistical Area. The population was 26,472 at the 2010 census, a significant increase from 14,561 in 2000. The city was incorporated on November 29, 1999 as Holladay-Cottonwood, and the name was shortened to Holladay on December 14 of that year. It was reported in the 1990 census as the Holladay-Cottonwood CDP.
Data | Crime | Cost of living | Movers
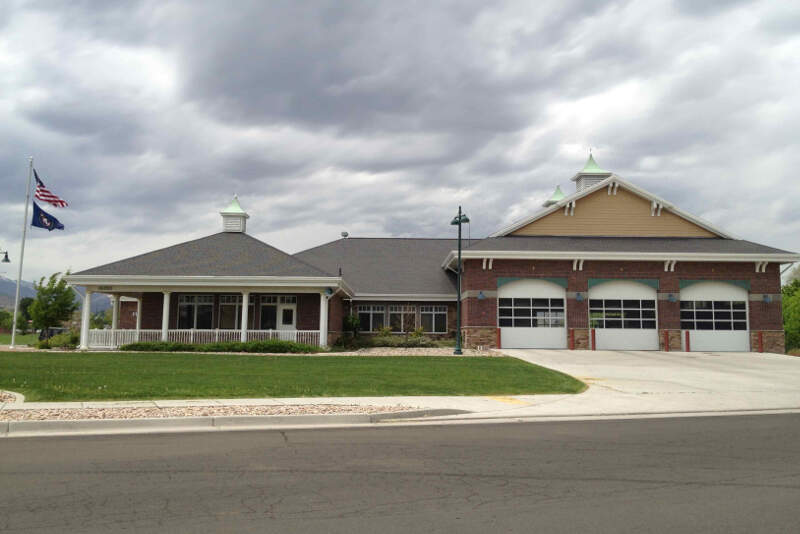
$140,679 median income · $758,826 median home · #8 home prices in Utah
Data | Crime | Cost of living | Movers
$134,047 median income · $665,928 median home · #15 home prices in Utah
South Jordan is a city in south central Salt Lake County, Utah, United States. The city lies in the Salt Lake Valley between the 9,000-foot peaks of the Oquirrh Mountains and the 12,000-foot peaks of the Wasatch Mountains and is part of the Salt Lake City metropolitan area. The Jordan River flows through the middle of the valley and the city has a 3.5-mile section of the Jordan River Parkway that contains fishing ponds, trails, parks and natural habitat. Salt Lake County fair grounds and equestrian park, 67-acre Oquirrh Lake and 27 other parks are located inside the city. As of the 2010 Census, its population was 50,418.
Data | Crime | Cost of living | Movers
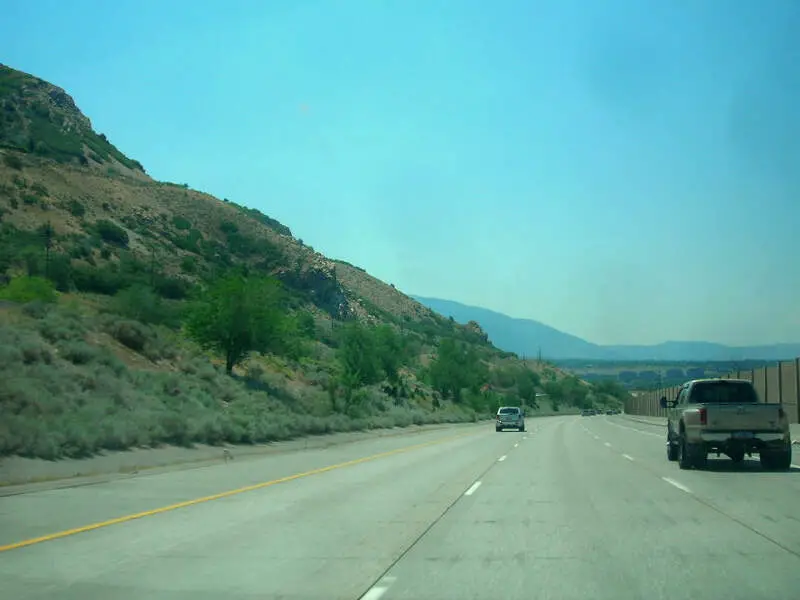
$133,142 median income · $730,777 median home · #9 home prices in Utah
Mapleton is a city in Utah County, Utah, United States. It is part of the Provo-Orem Metropolitan Statistical Area. The population was 7,979 at the 2010 census.
Data | Crime | Cost of living | Movers
The receipts
Compare the top ten
Pick a metric. The bars rescale. The red line is Utah’s statewide median.
Utah statewide median: $537,810
Utah statewide median: $95,166
On the map
Mapping the most expensive places in Utah
Saturday Night Science
Methodology: How We Determined The Most Expensive Places To Live In The Beehive State For 2026
The two most important things to think about when it comes to being able to afford a city in Utah are how much money you make and how much you have to spend to live there.
You need to understand your costs in the context of how much money you make.
For example, if the median household earns $100,000 and spends $40,000 on housing, it’s actually cheaper to live there than a place with a median income of $50,000 and housing costs of $21,000. You might spend more on housing, but you have more money overall to play with.
With that example in mind, we derived several statistics from the latest Census American Community Survey 2020-2024 around incomes and costs. They are:
- Overall Cost Of Living Index
- Median Home Price / Median Income (lower is better)
- Median Income / Median Rent (Higher is better)
- Median Home Price
You can then compare these metrics in each of the places in Utah to figure out which is the most expensive.
You are left with a “Cost of Living Index” by taking the average rank of each of these metrics for each city.
So we used that cost of living index to rank all of the 90 places in Utah that have more than 5,000 people.
The place with the highest cost of living in Utah according to the data is Park City. We updated this article for 2026. This article is our eleventh time ranking the most expensive places to live in Utah. The median Utah home is 32 years old — old enough that it pays to compare home warranty plans before something expensive breaks.
The full plate
Most Expensive Cities In Utah
Click any column to sort. Search by city name.
| Rank | City | Cost Of Living | Population | Median Income | Average Home Price | Home/Income Ratio |
|---|---|---|---|---|---|---|
| 1 | Park City | 213 | 8,362 | $133,558 | $1,588,140 | 11.9x |
| 2 | Alpine | 171 | 10,392 | $168,929 | $1,172,442 | 6.9x |
| 3 | Highland | 160 | 20,119 | $186,075 | $971,050 | 5.2x |
| 4 | Midway | 155 | 6,171 | $157,065 | $934,920 | 6.0x |
| 5 | Draper | 146 | 50,278 | $128,910 | $806,898 | 6.3x |
| 6 | Bluffdale | 143 | 18,797 | $129,531 | $612,682 | 4.7x |
| 7 | Holladay | 139 | 31,099 | $117,043 | $832,130 | 7.1x |
| 8 | Fruit Heights | 138 | 6,023 | $140,679 | $758,826 | 5.4x |
| 9 | South Jordan | 137 | 82,686 | $134,047 | $665,928 | 5.0x |
| 10 | Mapleton | 136 | 13,114 | $133,142 | $730,777 | 5.5x |
| 11 | Herriman | 134 | 59,346 | $122,650 | $607,545 | 5.0x |
| 12 | Vineyard | 134 | 14,446 | $103,380 | $525,876 | 5.1x |
| 13 | Lindon | 133 | 11,765 | $120,956 | $726,560 | 6.0x |
| 14 | Cedar Hills | 133 | 9,950 | $139,008 | $665,411 | 4.8x |
| 15 | Farmington | 132 | 25,389 | $127,338 | $692,138 | 5.4x |
| 16 | Lehi | 129 | 85,173 | $131,299 | $568,596 | 4.3x |
| 17 | Riverton | 129 | 45,457 | $126,910 | $625,364 | 4.9x |
| 18 | Cottonwood Heights | 129 | 32,828 | $119,422 | $777,468 | 6.5x |
| 19 | Sandy | 128 | 94,291 | $112,176 | $665,522 | 5.9x |
| 20 | Saratoga Springs | 128 | 48,425 | $128,802 | $560,223 | 4.3x |
| 21 | Syracuse | 127 | 35,488 | $133,443 | $584,934 | 4.4x |
| 22 | West Bountiful | 127 | 5,915 | $135,179 | $602,324 | 4.5x |
| 23 | Heber | 126 | 18,015 | $110,339 | $718,911 | 6.5x |
| 24 | South Weber | 126 | 8,115 | $138,600 | $603,380 | 4.4x |
| 25 | Kaysville | 125 | 33,053 | $133,026 | $682,325 | 5.1x |
| 26 | Centerville | 125 | 16,679 | $123,130 | $588,129 | 4.8x |
| 27 | Salt Lake City | 124 | 208,007 | $75,090 | $573,181 | 7.6x |
| 28 | Ivins | 124 | 9,998 | $78,089 | $617,241 | 7.9x |
| 29 | North Salt Lake | 123 | 23,474 | $101,447 | $575,886 | 5.7x |
| 30 | Santa Clara | 123 | 8,152 | $96,475 | $536,259 | 5.6x |
| 31 | Eagle Mountain | 122 | 53,290 | $113,648 | $510,057 | 4.5x |
| 32 | Salem | 122 | 10,324 | $111,117 | $611,418 | 5.5x |
| 33 | Hooper | 122 | 9,338 | $113,333 | $644,646 | 5.7x |
| 34 | American Fork | 121 | 37,109 | $98,878 | $525,231 | 5.3x |
| 35 | Washington | 121 | 32,348 | $91,853 | $544,670 | 5.9x |
| 36 | West Haven | 121 | 21,563 | $101,012 | $528,107 | 5.2x |
| 37 | Providence | 121 | 8,947 | $118,072 | $527,895 | 4.5x |
| 38 | West Jordan | 119 | 116,692 | $108,153 | $561,836 | 5.2x |
| 39 | Spanish Fork | 119 | 44,946 | $104,844 | $514,916 | 4.9x |
| 40 | Pleasant Grove | 119 | 37,852 | $101,073 | $555,047 | 5.5x |
| 41 | West Point | 119 | 11,929 | $120,687 | $554,465 | 4.6x |
| 42 | Pleasant View | 119 | 11,217 | $129,462 | $671,687 | 5.2x |
| 43 | Murray | 118 | 50,188 | $90,746 | $551,624 | 6.1x |
| 44 | Bountiful | 118 | 45,023 | $104,785 | $578,284 | 5.5x |
| 45 | Plain City | 118 | 8,396 | $132,766 | $636,932 | 4.8x |
| 46 | Farr West | 118 | 7,952 | $127,574 | $635,263 | 5.0x |
| 47 | Nibley | 117 | 7,952 | $108,072 | $484,028 | 4.5x |
| 48 | Orem | 116 | 97,182 | $83,342 | $504,054 | 6.0x |
| 49 | Clinton | 116 | 23,612 | $116,194 | $497,696 | 4.3x |
| 50 | North Logan | 116 | 11,460 | $89,891 | $545,675 | 6.1x |
| 51 | Provo | 115 | 114,766 | $64,171 | $484,203 | 7.5x |
| 52 | Midvale | 115 | 35,989 | $75,084 | $492,783 | 6.6x |
| 53 | North Ogden | 115 | 21,947 | $113,722 | $531,734 | 4.7x |
| 54 | St. George | 114 | 101,995 | $76,508 | $519,370 | 6.8x |
| 55 | Springville | 114 | 35,849 | $89,816 | $509,192 | 5.7x |
| 56 | Perry | 114 | 5,843 | $112,639 | $533,898 | 4.7x |
| 57 | Hyde Park | 114 | 5,540 | $113,102 | $570,837 | 5.0x |
| 58 | Kanab | 114 | 5,081 | $85,486 | $432,201 | 5.1x |
| 59 | Payson | 113 | 23,039 | $89,905 | $468,628 | 5.2x |
| 60 | Santaquin | 113 | 16,436 | $99,837 | $494,553 | 5.0x |
| 61 | Grantsville | 113 | 14,341 | $101,349 | $528,197 | 5.2x |
| 62 | Woods Cross | 113 | 11,531 | $120,543 | $531,313 | 4.4x |
| 63 | West Valley City | 112 | 138,437 | $92,209 | $471,862 | 5.1x |
| 64 | Layton | 112 | 83,286 | $102,480 | $527,623 | 5.1x |
| 65 | Hurricane | 112 | 22,771 | $75,016 | $504,102 | 6.7x |
| 66 | Harrisville | 111 | 6,935 | $88,750 | $451,088 | 5.1x |
| 67 | Taylorsville | 110 | 58,678 | $86,413 | $497,266 | 5.8x |
| 68 | South Salt Lake | 110 | 26,352 | $72,152 | $440,875 | 6.1x |
| 69 | Smithfield | 110 | 14,408 | $97,537 | $464,323 | 4.8x |
| 70 | Nephi | 110 | 6,885 | $106,108 | $452,334 | 4.3x |
| 71 | Moab | 110 | 5,312 | $61,667 | $543,317 | 8.8x |
| 72 | Roy | 109 | 38,993 | $91,282 | $436,793 | 4.8x |
| 73 | Clearfield | 109 | 33,523 | $75,495 | $424,500 | 5.6x |
| 74 | Tooele | 108 | 38,405 | $96,221 | $432,504 | 4.5x |
| 75 | South Ogden | 108 | 17,650 | $80,130 | $431,143 | 5.4x |
| 76 | Enoch | 107 | 8,144 | $80,750 | $454,954 | 5.6x |
| 77 | Ephraim | 107 | 5,949 | $66,541 | $465,611 | 7.0x |
| 78 | Cedar City | 106 | 38,524 | $63,589 | $403,487 | 6.3x |
| 79 | Riverdale | 106 | 9,279 | $67,323 | $461,455 | 6.9x |
| 80 | Washington Terrace | 104 | 9,182 | $80,119 | $396,702 | 5.0x |
| 81 | Ogden | 103 | 87,413 | $72,575 | $400,514 | 5.5x |
| 82 | Hyrum | 103 | 10,401 | $88,725 | $445,966 | 5.0x |
| 83 | Logan | 102 | 54,907 | $60,687 | $391,019 | 6.4x |
| 84 | Tremonton | 102 | 11,477 | $74,741 | $431,066 | 5.8x |
| 85 | Roosevelt | 101 | 7,078 | $76,456 | $350,393 | 4.6x |
| 86 | Brigham City | 100 | 19,992 | $71,308 | $413,632 | 5.8x |
| 87 | Vernal | 100 | 10,392 | $64,457 | $290,521 | 4.5x |
| 88 | Richfield | 99 | 8,224 | $74,756 | $329,292 | 4.4x |
| 89 | Sunset | 99 | 5,587 | $76,364 | $377,637 | 4.9x |
| 90 | Price | 95 | 8,248 | $53,203 | $310,716 | 5.8x |
Source: U.S. Census ACS 2020-2024, Zillow research. 90 places with more than 5,000 residents.
Summary
Summary: Taking A Chunk Out Of Your Paycheck In Utah For 2026
Well, there you have it, the places in Utah that have the highest cost of living, with Park City ranking as the most expensive city in the Beehive State.
The most expensive cities in Utah are Park City, Alpine, Highland, Midway, Draper, Bluffdale, Holladay, Fruit Heights, South Jordan, and Mapleton. Not sold on Utah? Take the two-minute Find Your Place quiz and see which state actually fits you.
Questions and answers
Most Expensive Places In Utah FAQs
What is the most expensive place to live in Utah?
Park City is the most expensive place to live in Utah for 2026. The median home there runs $1,588,140, and it posts the highest cost of living of the 90 places we scored.
What are the 10 most expensive cities in Utah?
The ten most expensive cities in Utah are Park City, Alpine, Highland, Midway, Draper, Bluffdale, Holladay, Fruit Heights, South Jordan, and Mapleton. We ranked all 90 places with more than 5,000 residents on home prices, incomes, and an overall cost of living index.
How expensive are homes in Park City?
The median home value in Park City is $1,588,140, versus $537,810 across Utah as a whole. Across the ten most expensive cities, the median home runs $819,514.
What salary do you need to live in the most expensive parts of Utah?
The median household income in the ten most expensive Utah cities starts at $117,043, and in Park City it is $133,558. If your paycheck is closer to the statewide median of $95,166, these places will squeeze your budget.
What is the cheapest place to live in Utah?
Price is the cheapest of the 90 Utah places we ranked on cost of living. It sits at the very bottom of the same index that put Park City on top.


