
Most Hispanic/Latino cities in Florida research summary. We used Saturday Night Science to analyze Florida’s most recent Census data to determine the most Hispanic/Latino cities based on the percentage of Hispanic/Latino residents. Here are the results of our analysis:
-
The most Hispanic/Latino city in Florida is Hialeah Gardens, based on the most recent Census data.
-
Hialeah Gardens is 96.45% Hispanic/Latino.
-
The least Hispanic/Latino city in Florida is Sanibel.
-
Sanibel is 1.98% Hispanic/Latino.
-
Florida is 27.4% Hispanic/Latino.
-
Florida is the 6th most Hispanic/Latino state in the United States.
Table Of Contents: Top Ten | Methodology | Summary | Table
The 10 Cities In Florida With The Largest Hispanic Population For 2026
What’s the city in Florida with the largest Hispanic/Latino population? Hialeah Gardens took the number one overall spot for the largest Hispanic population in Florida for 2026.
Continue below to see how we crunched the numbers and how your town ranked.
To see where Florida ranked as a state on diversity, we have a ranking of the most diverse states in America.
And if you already knew these places were Hispanic, check out the best places to live in Florida or the safest places in Florida.

/10
Population: 22,915
# Of Hispanic/Latino Residents: 22,101
% Hispanic/Latino: 96.45%
More on Hialeah Gardens: Data | Crime | Cost Of Living | Movers

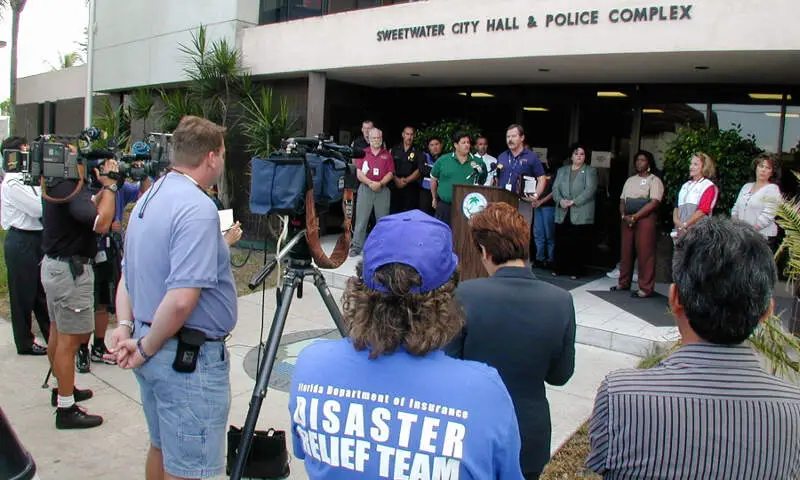
/10
Population: 20,085
# Of Hispanic/Latino Residents: 19,206
% Hispanic/Latino: 95.62%
More on Sweetwater: Data | Crime | Cost Of Living | Movers

/10
Population: 226,165
# Of Hispanic/Latino Residents: 215,133
% Hispanic/Latino: 95.12%
More on Hialeah: Data | Crime | Cost Of Living | Movers

/10
Population: 31,553
# Of Hispanic/Latino Residents: 28,092
% Hispanic/Latino: 89.03%
More on Miami Lakes: Data | Crime | Cost Of Living | Movers

/10
Population: 7,162
# Of Hispanic/Latino Residents: 6,162
% Hispanic/Latino: 86.04%
More on West Miami: Data | Crime | Cost Of Living | Movers

/10
Population: 79,216
# Of Hispanic/Latino Residents: 67,753
% Hispanic/Latino: 85.53%
More on Doral: Data | Crime | Cost Of Living | Movers

/10
Population: 13,726
# Of Hispanic/Latino Residents: 10,968
% Hispanic/Latino: 79.91%
More on Miami Springs: Data | Crime | Cost Of Living | Movers

/10
Population: 459,745
# Of Hispanic/Latino Residents: 328,679
% Hispanic/Latino: 71.49%
More on Miami: Data | Crime | Cost Of Living | Movers

/10
Population: 14,791
# Of Hispanic/Latino Residents: 10,398
% Hispanic/Latino: 70.3%
More on Key Biscayne: Data | Crime | Cost Of Living | Movers

/10
Population: 81,479
# Of Hispanic/Latino Residents: 56,026
% Hispanic/Latino: 68.76%
More on Kissimmee: Data | Crime | Cost Of Living | Movers
Methodology: How We Determined The Cities In Florida With The Largest Hispanic Population For 2026
We used Saturday Night Science to compare data on race from the US Census for every city in Florida.
Florida’s most recently available data comes from the 2020-2024 American Community Survey.
Specifically, we looked at table B03002: Hispanic OR LATINO ORIGIN BY RACE. Here are the category names as defined by the Census:
- Hispanic or Latino
- White alone*
- Black or African American alone*
- American Indian and Alaska Native alone*
- Asian alone*
- Native Hawaiian and Other Pacific Islander alone*
- Some other race alone*
- Two or more races*
Our particular column of interest here was the number of people who identified as Hispanic or Latino.
We limited our analysis to places in Florida with a population greater than 5,000 people. That left us with 208 cities.
We then calculated the percentage of Hispanic or Latino residents in each Florida city. The percentages ranked from 96.4% to 2.0%.
Finally, we ranked each city based on the percentage of the Hispanic or Latino population, with a higher score being more Hispanic or Latino than a lower score. Hialeah Gardens was the most Hispanic or Latino, while Sanibel was the least Hispanic or Latino city.
We updated this article for 2026. This article represents our eleventh time ranking the cities in Florida with the largest Hispanic/Latino population.
Read on for more information on how the cities in Florida ranked by population of Hispanic or Latino residents or, for a more general take on diversity in America, head over to our ranking of the most diverse cities in America.
Summary: Hispanic or Latino Populations Across Florida
According to the most recent data, this is an accurate list if you’re looking for a breakdown of Latino populations for each place across Florida.
The most Hispanic/Latino cities in Florida are Hialeah Gardens, Sweetwater, Hialeah, Miami Lakes, West Miami, Doral, Miami Springs, Miami, Key Biscayne, and Kissimmee.
If you’re curious enough, here are the least Hispanic or Latino places in Florida:
- Sanibel
- Punta Gorda
- Starke
For more Florida reading, check out:
- Best Counties To Live In Florida
- Best Places To Retire In Florida
- Best Places To Raise A Family In Florida
Most Hispanic Cities In Florida
| Rank | City | Population | Hispanic Pop. | % Hispanic |
|---|---|---|---|---|
| 1 | Hialeah Gardens | 22,915 | 22,101 | 96.45% |
| 2 | Sweetwater | 20,085 | 19,206 | 95.62% |
| 3 | Hialeah | 226,165 | 215,133 | 95.12% |
| 4 | Miami Lakes | 31,553 | 28,092 | 89.03% |
| 5 | West Miami | 7,162 | 6,162 | 86.04% |
| 6 | Doral | 79,216 | 67,753 | 85.53% |
| 7 | Miami Springs | 13,726 | 10,968 | 79.91% |
| 8 | Miami | 459,745 | 328,679 | 71.49% |
| 9 | Key Biscayne | 14,791 | 10,398 | 70.3% |
| 10 | Kissimmee | 81,479 | 56,026 | 68.76% |
| 11 | Homestead | 82,807 | 55,837 | 67.43% |
| 12 | Cutler Bay | 45,070 | 28,844 | 64.0% |
| 13 | Palm Springs | 27,356 | 16,983 | 62.08% |
| 14 | North Bay Village | 8,118 | 4,873 | 60.03% |
| 15 | Weston | 68,837 | 39,111 | 56.82% |
| 16 | Coral Gables | 49,802 | 28,212 | 56.65% |
| 17 | Florida City | 12,943 | 7,287 | 56.3% |
| 18 | Bay Harbor Islands | 5,847 | 3,282 | 56.13% |
| 19 | Opa-Locka | 16,282 | 8,810 | 54.11% |
| 20 | South Miami | 12,277 | 6,602 | 53.78% |
| 21 | Miami Beach | 82,031 | 43,043 | 52.47% |
| 22 | St. Cloud | 65,130 | 33,852 | 51.98% |
| 23 | Palmetto Bay | 24,639 | 12,594 | 51.11% |
| 24 | Clewiston | 7,348 | 3,737 | 50.86% |
| 25 | Pembroke Pines | 173,194 | 86,567 | 49.98% |
| 26 | Haines City | 34,234 | 17,055 | 49.82% |
| 27 | Pinecrest | 18,462 | 8,989 | 48.69% |
| 28 | Aventura | 39,885 | 18,194 | 45.62% |
| 29 | Greenacres | 44,373 | 19,866 | 44.77% |
| 30 | West Park | 15,249 | 6,628 | 43.47% |
| 31 | Hollywood | 155,082 | 67,004 | 43.21% |
| 32 | Sunny Isles Beach | 22,437 | 9,680 | 43.14% |
| 33 | Davie | 108,346 | 45,862 | 42.33% |
| 34 | Pahokee | 5,609 | 2,323 | 41.42% |
| 35 | Arcadia | 7,707 | 3,168 | 41.11% |
| 36 | Deltona | 97,334 | 39,793 | 40.88% |
| 37 | Hallandale Beach | 41,854 | 16,960 | 40.52% |
| 38 | North Miami Beach | 43,898 | 17,548 | 39.97% |
| 39 | Southwest Ranches | 7,656 | 3,059 | 39.96% |
| 40 | Miramar | 138,600 | 54,498 | 39.32% |
| 41 | Miami Shores | 11,752 | 4,377 | 37.24% |
| 42 | Miami Gardens | 113,177 | 41,131 | 36.34% |
| 43 | Sunrise | 97,918 | 35,267 | 36.02% |
| 44 | Pembroke Park | 6,360 | 2,268 | 35.66% |
| 45 | Orlando | 319,758 | 113,128 | 35.38% |
| 46 | Dania Beach | 32,180 | 11,117 | 34.55% |
| 47 | Marathon | 9,914 | 3,395 | 34.24% |
| 48 | Okeechobee | 5,479 | 1,862 | 33.98% |
| 49 | North Miami | 60,344 | 20,464 | 33.91% |
| 50 | Plant City | 40,887 | 13,850 | 33.87% |
| 51 | Avon Park | 10,057 | 3,372 | 33.53% |
| 52 | Oakland Park | 44,682 | 14,785 | 33.09% |
| 53 | Fort Meade | 5,225 | 1,704 | 32.61% |
| 54 | Tamarac | 73,019 | 23,009 | 31.51% |
| 55 | Coral Springs | 136,103 | 42,452 | 31.19% |
| 56 | Belle Glade | 16,972 | 5,288 | 31.16% |
| 57 | Minneola | 16,598 | 5,159 | 31.08% |
| 58 | Lake Wales | 16,785 | 5,178 | 30.85% |
| 59 | Cooper City | 34,660 | 10,639 | 30.7% |
| 60 | Royal Palm Beach | 40,344 | 12,380 | 30.69% |
| 61 | Plantation | 96,293 | 29,426 | 30.56% |
| 62 | Groveland | 22,012 | 6,713 | 30.5% |
| 63 | Altamonte Springs | 46,116 | 13,966 | 30.28% |
| 64 | Apopka | 58,232 | 17,336 | 29.77% |
| 65 | Sebring | 11,382 | 3,308 | 29.06% |
| 66 | Longwood | 16,337 | 4,738 | 29.0% |
| 67 | Surfside | 5,631 | 1,630 | 28.95% |
| 68 | Wellington | 62,146 | 17,704 | 28.49% |
| 69 | Sanford | 63,730 | 18,138 | 28.46% |
| 70 | Coconut Creek | 58,330 | 16,460 | 28.22% |
| 71 | Ocoee | 49,033 | 13,715 | 27.97% |
| 72 | Casselberry | 30,135 | 8,427 | 27.96% |
| 73 | North Lauderdale | 45,234 | 12,109 | 26.77% |
| 74 | Margate | 59,198 | 15,790 | 26.67% |
| 75 | Cape Coral | 215,536 | 56,967 | 26.43% |
| 76 | Tampa | 401,618 | 105,270 | 26.21% |
| 77 | Lake Park | 9,081 | 2,299 | 25.32% |
| 78 | Deland | 41,611 | 10,482 | 25.19% |
| 79 | Pompano Beach | 114,147 | 28,402 | 24.88% |
| 80 | Fort Myers | 95,051 | 23,546 | 24.77% |
| 81 | West Palm Beach | 122,290 | 30,096 | 24.61% |
| 82 | Winter Haven | 55,200 | 13,474 | 24.41% |
| 83 | Clermont | 46,853 | 11,428 | 24.39% |
| 84 | Port St. Lucie | 232,491 | 55,870 | 24.03% |
| 85 | Mount Dora | 17,278 | 4,097 | 23.71% |
| 86 | Palmetto | 13,588 | 3,222 | 23.71% |
| 87 | Oviedo | 40,599 | 9,510 | 23.42% |
| 88 | Deerfield Beach | 88,093 | 20,631 | 23.42% |
| 89 | Auburndale | 18,530 | 4,243 | 22.9% |
| 90 | Winter Garden | 47,872 | 10,858 | 22.68% |
| 91 | Temple Terrace | 27,275 | 6,178 | 22.65% |
| 92 | Maitland | 19,469 | 4,396 | 22.58% |
| 93 | Key West | 25,720 | 5,780 | 22.47% |
| 94 | Quincy | 7,942 | 1,781 | 22.43% |
| 95 | Lauderdale-By-The-Sea | 6,232 | 1,337 | 21.45% |
| 96 | Winter Springs | 38,951 | 8,332 | 21.39% |
| 97 | Stuart | 18,520 | 3,953 | 21.34% |
| 98 | Leesburg | 30,807 | 6,522 | 21.17% |
| 99 | Bradenton | 57,014 | 11,940 | 20.94% |
| 100 | Cocoa | 19,554 | 4,089 | 20.91% |