Most Hispanic/Latino cities in Missouri research summary. We used Saturday Night Science to analyze Missouri’s most recent Census data to determine the most Hispanic/Latino cities based on the percentage of Hispanic/Latino residents.
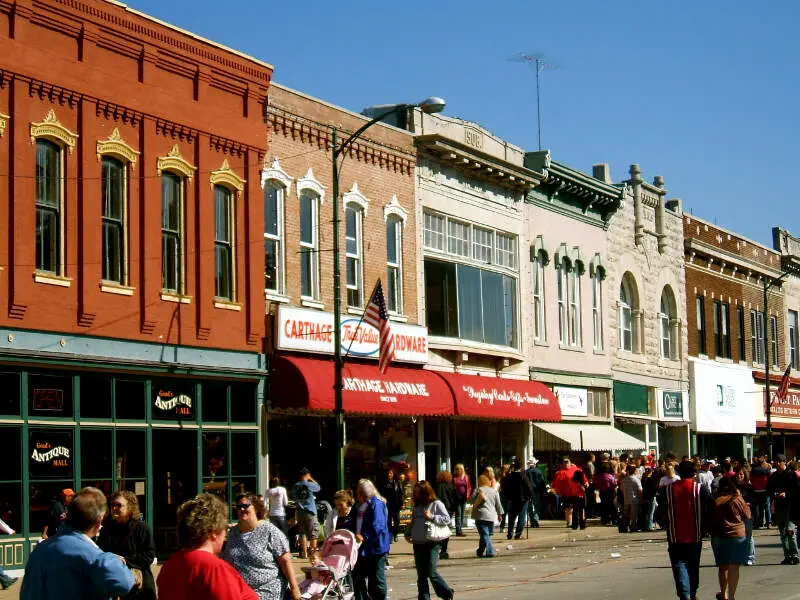
34.5% Hispanic · #1 most Hispanic in Missouri
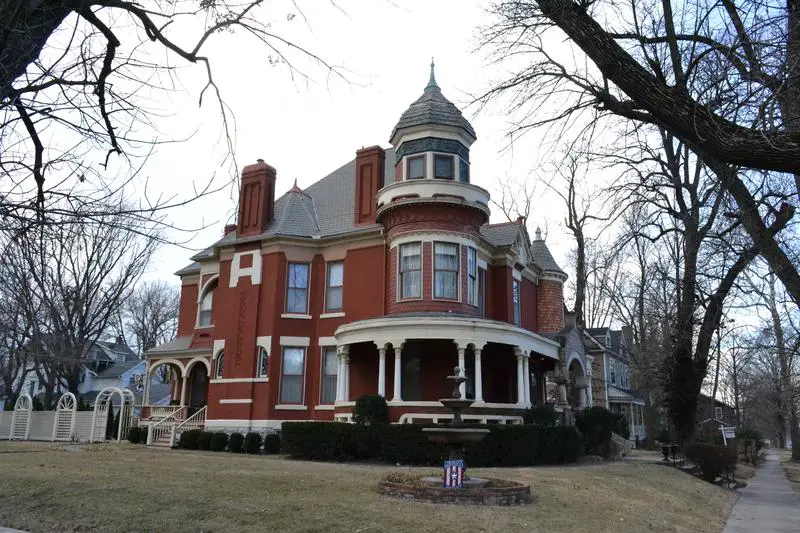
Carthage is a city in Jasper County, Missouri, United States. The population was 14,378 at the 2010 census. It is the county seat of Jasper County and is nicknamed “America’s Maple Leaf City.”
Data | Crime | Cost of living | Movers
27.5% Hispanic · #2 most Hispanic in Missouri
Monett is a city in Monett Township in Barry County and Pierce Township in Lawrence County, Missouri, United States. The population was 8,873 at the 2010 census.
Data | Crime | Cost of living | Movers
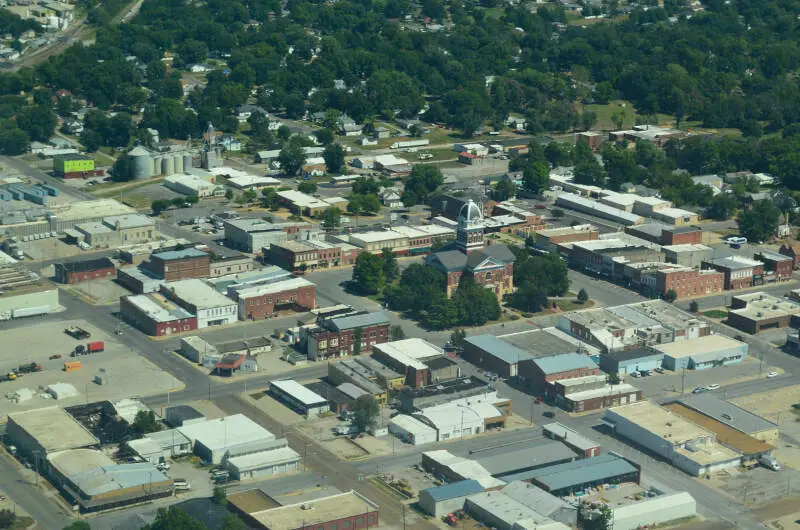
19.2% Hispanic · #3 most Hispanic in Missouri
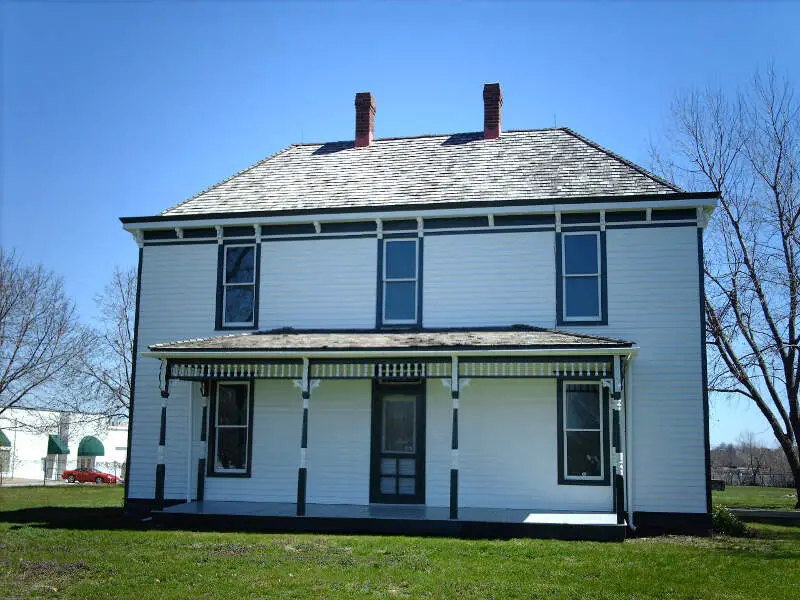
Marshall is a city in Saline County, Missouri, United States. The population was 13,065 at the 2010 census. It is the county seat of Saline County. The Marshall Micropolitan Statistical Area consists of Saline County. It is home to Missouri Valley College.
Data | Crime | Cost of living | Movers
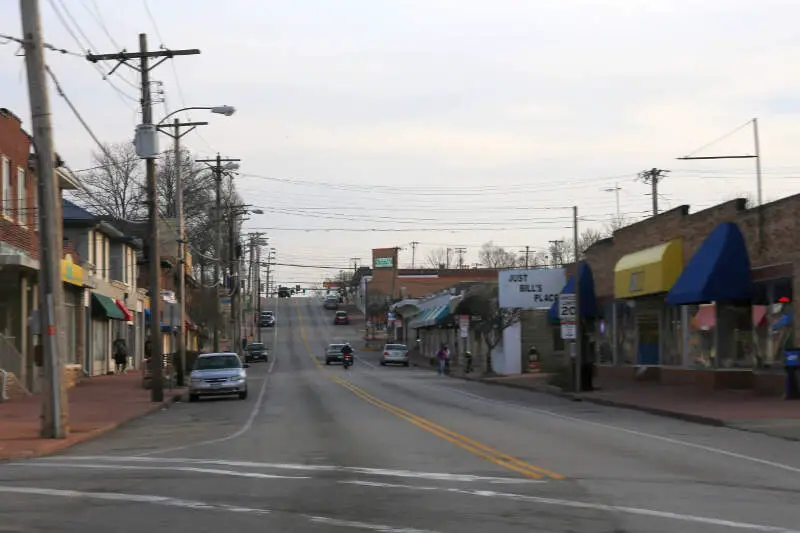
15.3% Hispanic · #4 most Hispanic in Missouri
Overland is a city in St. Louis County, Missouri, United States. The population was 16,062 at the 2010 census.
Data | Crime | Cost of living | Movers
15.1% Hispanic · #5 most Hispanic in Missouri
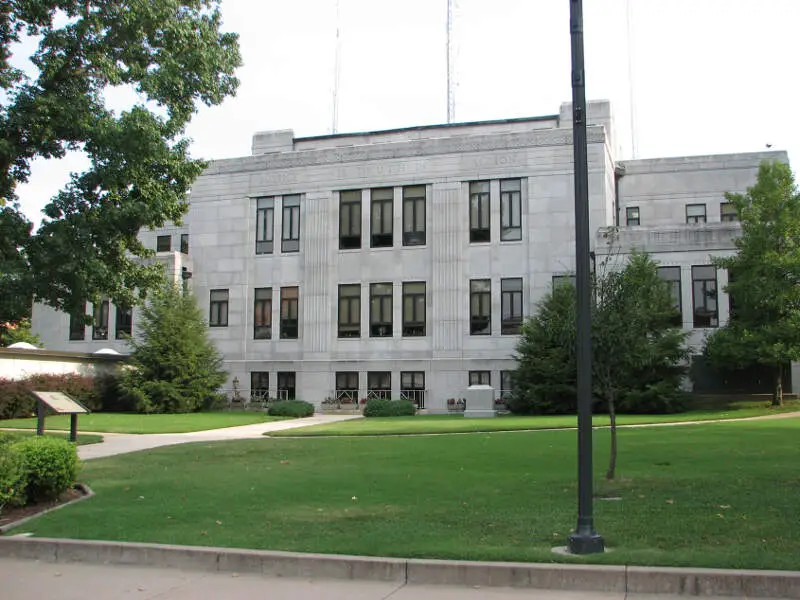
Sedalia, Missouri is a city located about 30 miles south of the Missouri River in Pettis County. As of the 2010 census, the city had a total population of 21,387. As the county seat of Pettis County, it is the principal city of the Sedalia Micropolitan Statistical Area, which consists of Pettis County. Sedalia is also the location of the Missouri State Fair and the Scott Joplin Ragtime Festival. U.S. Routes 50 and 65 intersect in the city.
Data | Crime | Cost of living | Movers
14.3% Hispanic · #6 most Hispanic in Missouri
Grandview is a city in Jackson County, Missouri, United States. The population was 24,475 at the 2010 census.
Data | Crime | Cost of living | Movers
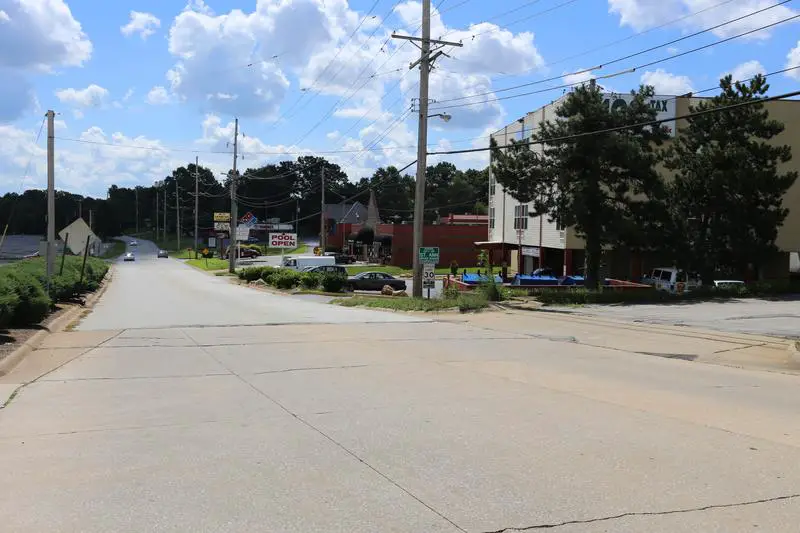
13.9% Hispanic · #7 most Hispanic in Missouri
Neosho residents. Neosho lies on the western edge of the Ozarks.
Data | Crime | Cost of living | Movers
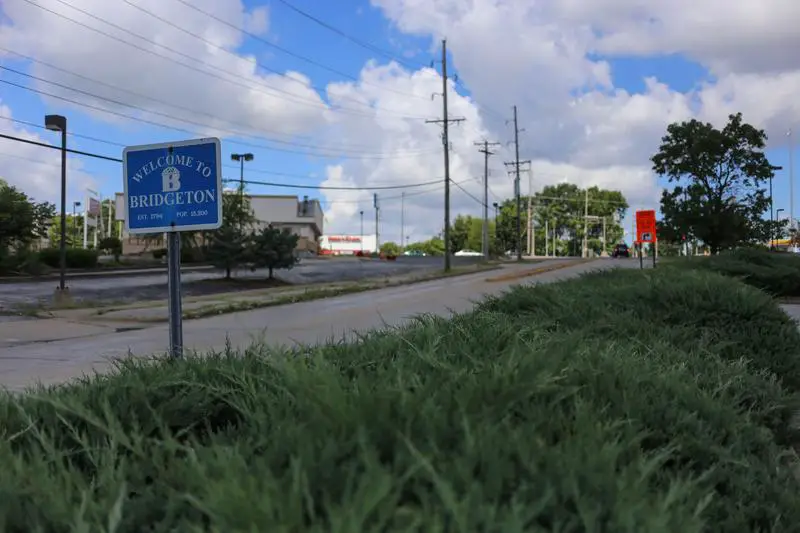
13.8% Hispanic · #8 most Hispanic in Missouri
Bridgeton is a second-ring suburb of Greater St. Louis in northwestern St. Louis County, Missouri, United States. Bridgeton is located at the intersection of the St. Louis outer belt and I-70. Bridgeton serves as the primary transport hub within Greater St. Louis. The population at the 2010 census was 11,550. Portions of Lambert-St. Louis International Airport are within Bridgeton.
Data | Crime | Cost of living | Movers
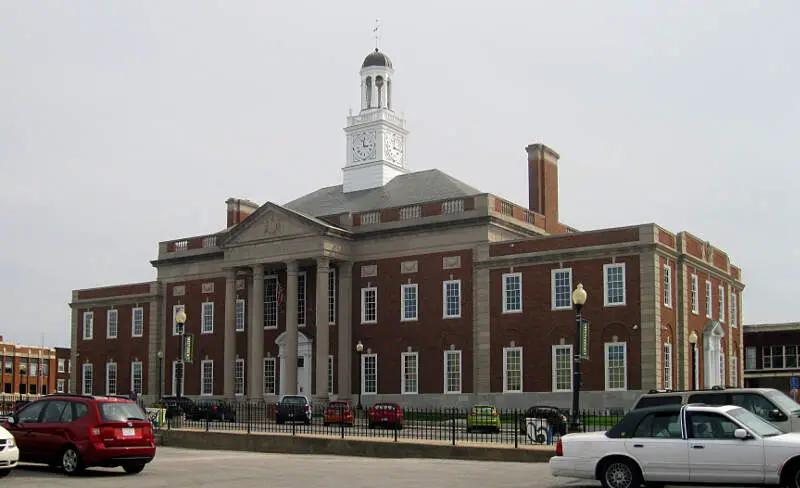
13.3% Hispanic · #9 most Hispanic in Missouri
Independence is the fifth-largest city in the state of Missouri. It lies within Jackson County, of which it is the county seat. Independence is a satellite city of Kansas City, Missouri, and is part of the Kansas City metropolitan area. In 2010, it had a total population of 116,830.
Data | Crime | Cost of living | Movers
12.9% Hispanic · #10 most Hispanic in Missouri
St. Ann is an inner-ring suburb of St. Louis in mid St. Louis County, Missouri, United States. The population was 13,020 at the 2010 census.
Data | Crime | Cost of living | Movers
The receipts
Compare the top ten
Pick a metric. The bars rescale. The red line is Missouri’s statewide median.
On the map
Where Missouri’s Hispanic and Latino communities live
Saturday Night Science
Methodology: How We Determined The Cities In Missouri With The Largest Hispanic Population For 2026
We used Saturday Night Science to compare data on race from the US Census for every city in Missouri.
Missouri’s most recently available data comes from the 2020-2024 American Community Survey.
Specifically, we looked at table B03002: Hispanic OR LATINO ORIGIN BY RACE. Here are the category names as defined by the Census:
- Hispanic or Latino
- White alone*
- Black or African American alone*
- American Indian and Alaska Native alone*
- Asian alone*
- Native Hawaiian and Other Pacific Islander alone*
- Some other race alone*
- Two or more races*
Our particular column of interest here was the number of people who identified as Hispanic or Latino.
We limited our analysis to places in Missouri with a population greater than 5,000 people. That left us with 121 cities.
We then calculated the percentage of Hispanic or Latino residents in each Missouri city. The percentages ranked from 34.5% to 0.0%.
Finally, we ranked each city based on the percentage of the Hispanic or Latino population, with a higher percentage being more Hispanic or Latino. Carthage was the most Hispanic or Latino, while Weldon Spring was the least Hispanic or Latino city.
We updated this article for 2026. This article represents our eleventh time ranking the cities in Missouri with the largest Hispanic/Latino population.
The full plate
Cities In Missouri By Hispanic Population
Click any column to sort. Search by city name.
| Rank | City | Population | Hispanic Population | % Hispanic |
|---|---|---|---|---|
| 1 | Carthage | 15,574 | 5,378 | 34.5% |
| 2 | Monett | 9,873 | 2,714 | 27.5% |
| 3 | Marshall | 13,739 | 2,644 | 19.2% |
| 4 | Overland | 15,695 | 2,408 | 15.3% |
| 5 | Sedalia | 22,003 | 3,314 | 15.1% |
| 6 | Grandview | 26,527 | 3,787 | 14.3% |
| 7 | Neosho | 13,224 | 1,839 | 13.9% |
| 8 | Bridgeton | 11,369 | 1,572 | 13.8% |
| 9 | Independence | 121,740 | 16,198 | 13.3% |
| 10 | St. Ann | 12,811 | 1,653 | 12.9% |
| 11 | Kansas City | 510,612 | 63,633 | 12.5% |
| 12 | St. John | 6,527 | 792 | 12.1% |
| 13 | Raytown | 29,445 | 3,107 | 10.6% |
| 14 | Parkville | 8,366 | 855 | 10.2% |
| 15 | Gladstone | 27,207 | 2,706 | 9.9% |
| 16 | Grain Valley | 16,271 | 1,556 | 9.6% |
| 17 | Excelsior Springs | 10,484 | 929 | 8.9% |
| 18 | St. Joseph | 71,236 | 6,015 | 8.4% |
| 19 | Ellisville | 10,002 | 808 | 8.1% |
| 20 | Belton | 25,008 | 1,927 | 7.7% |
| 21 | Berkeley | 8,123 | 613 | 7.5% |
| 22 | Raymore | 24,526 | 1,698 | 6.9% |
| 23 | Branson | 12,817 | 871 | 6.8% |
| 24 | Aurora | 7,397 | 496 | 6.7% |
| 25 | Pleasant Hill | 8,847 | 585 | 6.6% |
| 26 | St. Charles | 71,508 | 4,625 | 6.5% |
| 27 | Joplin | 52,593 | 3,334 | 6.3% |
| 28 | Blue Springs | 59,965 | 3,712 | 6.2% |
| 29 | Lee’s Summit | 103,656 | 6,369 | 6.1% |
| 30 | Ozark | 22,417 | 1,356 | 6.0% |
| 31 | Warrenton | 9,066 | 530 | 5.8% |
| 32 | Springfield | 169,954 | 9,871 | 5.8% |
| 33 | Warrensburg | 19,582 | 1,103 | 5.6% |
| 34 | Maryland Heights | 27,880 | 1,561 | 5.6% |
| 35 | O’Fallon | 93,801 | 5,200 | 5.5% |
| 36 | Republic | 19,829 | 1,078 | 5.4% |
| 37 | St. Louis | 288,512 | 15,297 | 5.3% |
| 38 | University City | 34,685 | 1,745 | 5.0% |
| 39 | Nevada | 7,925 | 398 | 5.0% |
| 40 | Liberty | 30,689 | 1,539 | 5.0% |
| 41 | Manchester | 18,160 | 902 | 5.0% |
| 42 | Troy | 13,947 | 667 | 4.8% |
| 43 | Rolla | 20,287 | 936 | 4.6% |
| 44 | Wildwood | 35,133 | 1,562 | 4.4% |
| 45 | Battlefield | 6,165 | 274 | 4.4% |
| 45 | Valley Park | 6,795 | 302 | 4.4% |
| 47 | Trenton | 5,536 | 245 | 4.4% |
| 48 | Columbia | 128,548 | 5,680 | 4.4% |
| 49 | Perryville | 8,536 | 374 | 4.4% |
| 50 | Dexter | 7,891 | 338 | 4.3% |
| 51 | Ballwin | 31,279 | 1,295 | 4.1% |
| 52 | Lebanon | 15,270 | 625 | 4.1% |
| 53 | Jackson | 15,659 | 629 | 4.0% |
| 54 | Nixa | 24,836 | 997 | 4.0% |
| 55 | Jefferson City | 42,488 | 1,683 | 4.0% |
| 56 | Hazelwood | 25,114 | 985 | 3.9% |
| 57 | Carl Junction | 8,339 | 315 | 3.8% |
| 58 | Kirksville | 17,563 | 657 | 3.7% |
| 59 | Oak Grove | 8,538 | 318 | 3.7% |
| 60 | Cape Girardeau | 40,344 | 1,502 | 3.7% |
| 61 | Clayton | 17,380 | 644 | 3.7% |
| 62 | Festus | 13,201 | 488 | 3.7% |
| 63 | Webb City | 13,221 | 485 | 3.7% |
| 64 | Bolivar | 11,170 | 406 | 3.6% |
| 65 | Maryville | 10,428 | 377 | 3.6% |
| 66 | Richmond | 5,959 | 206 | 3.5% |
| 67 | Caruthersville | 5,326 | 182 | 3.4% |
| 68 | Macon | 5,466 | 183 | 3.3% |
| 69 | Webster Groves | 23,712 | 789 | 3.3% |
| 70 | Wentzville | 47,061 | 1,561 | 3.3% |
| 71 | Richmond Heights | 9,153 | 303 | 3.3% |
| 72 | Chesterfield | 49,574 | 1,634 | 3.3% |
| 73 | Dardenne Prairie | 13,503 | 442 | 3.3% |
| 74 | Cameron | 8,519 | 272 | 3.2% |
| 75 | Eureka | 13,081 | 392 | 3.0% |
| 76 | St. Peters | 59,092 | 1,713 | 2.9% |
| 77 | Boonville | 7,689 | 221 | 2.9% |
| 78 | Town and Country | 11,607 | 333 | 2.9% |
| 79 | Park Hills | 8,678 | 243 | 2.8% |
| 80 | Hannibal | 16,771 | 460 | 2.7% |
| 81 | Harrisonville | 9,970 | 272 | 2.7% |
| 82 | Kirkwood | 29,363 | 787 | 2.7% |
| 83 | Moberly | 13,526 | 356 | 2.6% |
| 84 | Arnold | 20,956 | 548 | 2.6% |
| 85 | Chillicothe | 8,923 | 233 | 2.6% |
| 86 | Lake St. Louis | 18,066 | 453 | 2.5% |
| 87 | Bonne Terre | 6,683 | 165 | 2.5% |
| 88 | Union | 12,781 | 314 | 2.5% |
| 89 | Florissant | 51,773 | 1,261 | 2.4% |
| 90 | Poplar Bluff | 16,254 | 395 | 2.4% |
| 91 | Smithville | 10,705 | 253 | 2.4% |
| 92 | Creve Coeur | 18,643 | 440 | 2.4% |
| 93 | Sikeston | 16,320 | 381 | 2.3% |
| 94 | Pacific | 7,475 | 172 | 2.3% |
| 95 | Shrewsbury | 6,316 | 143 | 2.3% |
| 96 | Crestwood | 12,295 | 278 | 2.3% |
| 97 | Glendale | 6,114 | 138 | 2.3% |
| 98 | Maplewood | 8,156 | 183 | 2.2% |
| 99 | Des Peres | 9,170 | 205 | 2.2% |
| 100 | Washington | 15,130 | 318 | 2.1% |
Source: U.S. Census ACS 2020-2024. 121 cities with more than 5,000 residents.
Summary
Summary: Hispanic or Latino Populations Across Missouri
According to the most recent data, this is an accurate list if you’re looking for a breakdown of Latino populations for each place across Missouri.
The most Hispanic/Latino cities in Missouri are Carthage, Monett, Marshall, Overland, Sedalia, Grandview, Neosho, Bridgeton, Independence, and St. Ann.


