Most Native American places in Utah research summary. We used Saturday Night Science to research the Utah cities with the highest percentage of Native American residents for 2026. The data comes from the American Community Survey 2020-2024 vintage, which breaks down race by origin.
The city with the highest percentage of Native Americans is Roosevelt. 4.73% of people in Roosevelt are Native Americans.
The city with the lowest percentage of Native Americans is Woods Cross. 0.00% of people in Woods Cross are Native American.
The city with the most Native Americans is Salt Lake City. 1,018 people in Salt Lake City are Native American.
The city with the fewest Native Americans is Woods Cross. 0 people in Woods Cross are Native American.
The United States has 1,698,432 Native Americans and is 0.51% Native American.
Which city in Utah had the largest Native American population? The place with the largest Native American population in Utah for 2026 is Roosevelt. 4.73% of Roosevelt identify as Native American.
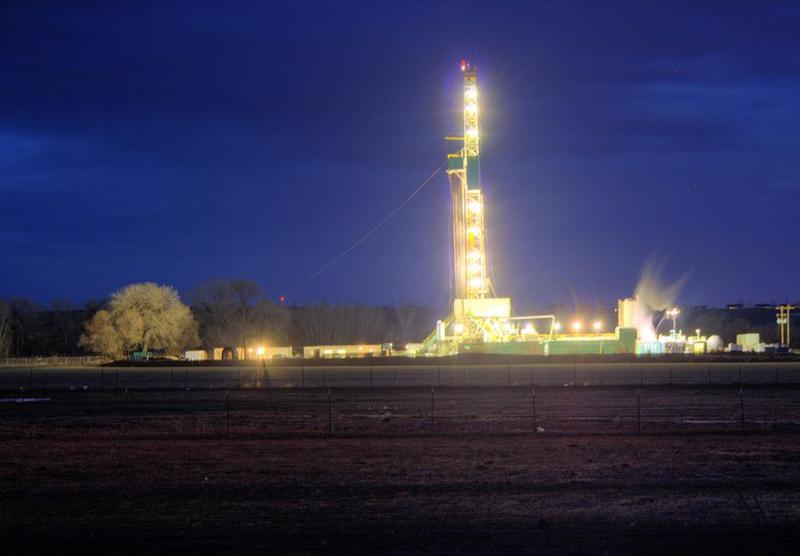
4.7% Native American · 335 Native American residents
Roosevelt is a city in Duchesne County, Utah, United States. The population was 6,046 at the 2010 census, with an estimated population of 6,777 in 2014.
Data | Crime | Cost of living | Movers
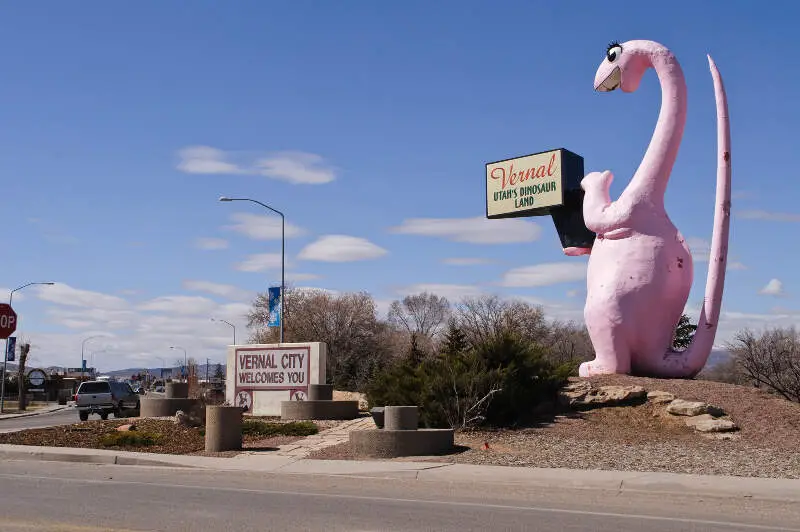
4.1% Native American · 424 Native American residents
Vernal, the county seat and largest city in Uintah County is in northeastern Utah, United States, about 175 miles east of Salt Lake City and 20 miles west of the Colorado border. As of the 2010 census, the city population was 9,089. The population has since grown to 10,844 as of the 2014 population estimate.
Data | Crime | Cost of living | Movers
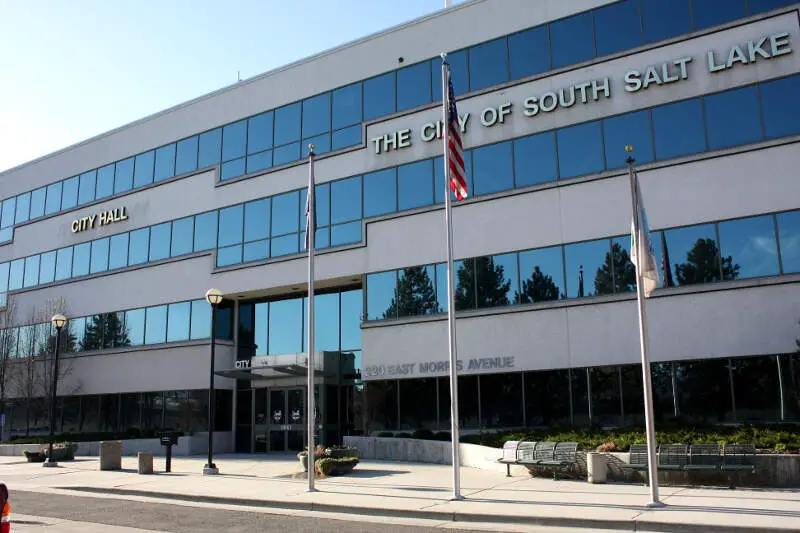
1.8% Native American · 468 Native American residents
South Salt Lake is a city in Salt Lake County, Utah, United States and is part of the Salt Lake City Metropolitan Statistical Area. The population was 23,617 at the 2010 census.
Data | Crime | Cost of living | Movers
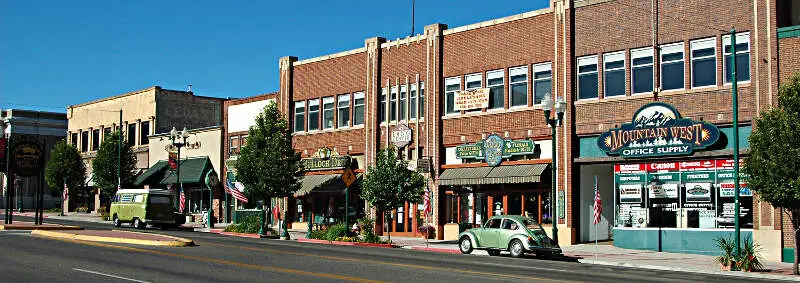
1.7% Native American · 655 Native American residents
Cedar City is a city in Iron County, Utah, United States, 250 miles south of Salt Lake City, and 180 miles north of Las Vegas on Interstate 15. It is the home of Southern Utah University, the Utah Shakespeare Festival, the Utah Summer Games, the Neil Simon Theatre Festival, and other events. As of the 2010 census, the city had a total population of 28,857. In 2011, the U.S. Census Bureau estimated Cedar City’s population to be 29,213.
Data | Crime | Cost of living | Movers
1.4% Native American · 137 Native American residents
Data | Crime | Cost of living | Movers
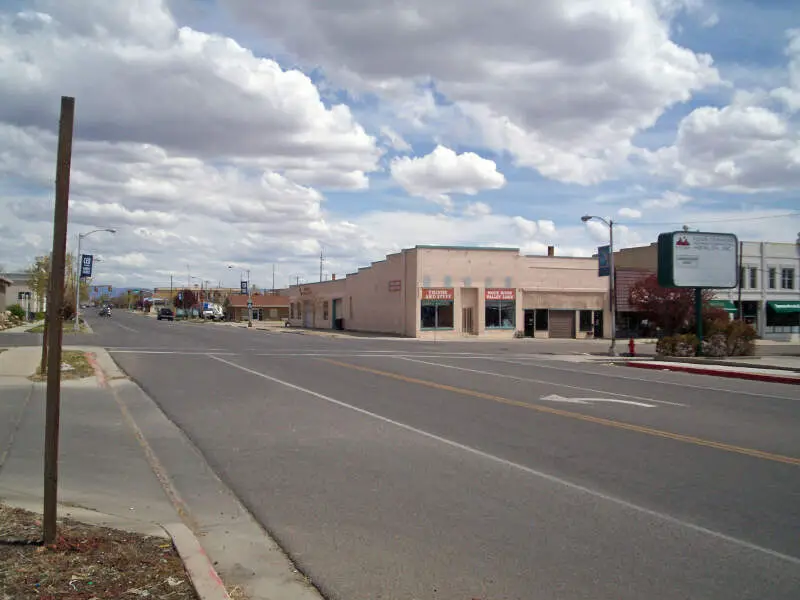
1.2% Native American · 69 Native American residents
Data | Crime | Cost of living | Movers
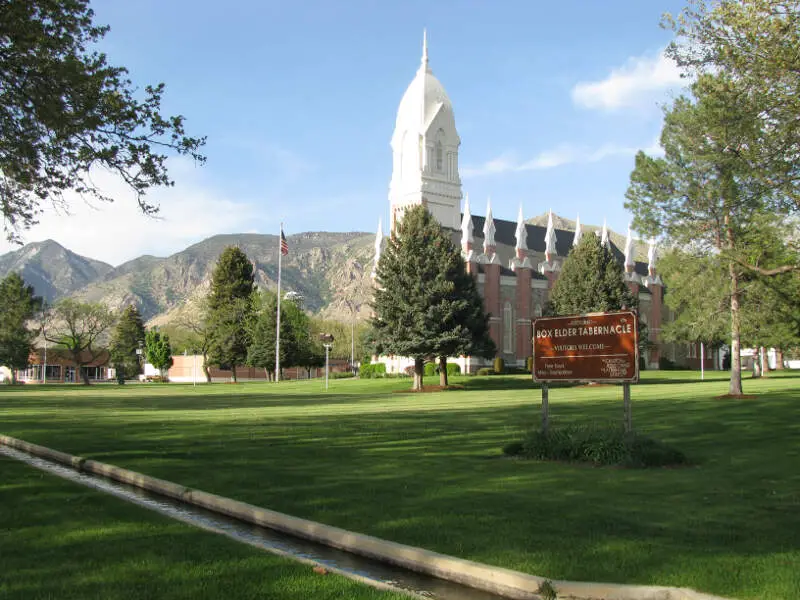
1.0% Native American · 206 Native American residents
Brigham City is a city in Box Elder County, Utah, United States. The population was 17,899 at the 2010 census. It is the county seat of Box Elder County. It lies on the western slope of the Wellsville Mountains, a branch of the Wasatch Range at the western terminus of Box Elder Canyon. Brigham City saw most of its growth during the 1950s and 1960s, but has seen a struggling economy and stagnating growth since then. It is near the headquarters of ATK Thiokol, the company that created the solid rocket boosters for the Space Shuttle.
Data | Crime | Cost of living | Movers
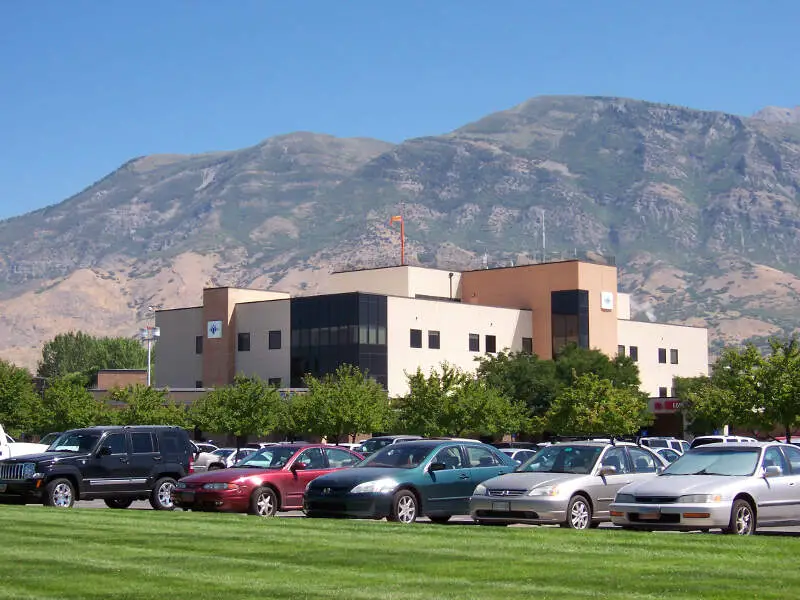
0.9% Native American · 317 Native American residents
American Fork, often referred to by locals as A.F., is a city in Utah County, Utah, United States, at the foot of Mount Timpanogos in the Wasatch Range, north of Utah Lake. It is part of the Provo-Orem Metropolitan Statistical Area. The population was 28,326 in 2015, representing a nearly 20% growth since the 2000 census. The city has grown rapidly since the 1970s.
Data | Crime | Cost of living | Movers
0.8% Native American · 64 Native American residents
Data | Crime | Cost of living | Movers
0.7% Native American · 1,013 Native American residents
West Valley City is a city in Salt Lake County and a suburb of Salt Lake City in the U.S. state of Utah. The population was 129,480 at the 2010 census, making it the second-largest city in Utah. The city incorporated in 1980 from a large, quickly growing unincorporated area, which was variously known as Granger, Hunter, Chesterfield, and Redwood. It is home to the Maverik Center and USANA Amphitheatre.
Data | Crime | Cost of living | Movers
The receipts
Compare the top ten
Pick a metric. The bars rescale. The red line is Utah’s statewide median.
On the map
Where Utah’s Native American population is concentrated
Saturday Night Science
Methodology: How We Determined The Cities In Utah With The Largest Native American Population For 2026
We still believe in the accuracy of data — especially from the Census. So that’s where we went to get the race breakdown across Utah.
We used Saturday Night Science to analyze the Census’s most recently available data, the 2020-2024 American Community Survey data.
Specifically, we looked at table B03002: Hispanic OR LATINO ORIGIN BY RACE. Here are the category names as defined by the Census:
- Hispanic or Latino
- White alone
- Black or African American alone
- American Indian and Alaska Native alone
- Asian alone
- Native Hawaiian and Other Pacific Islander alone
- Some other race alone
- Two or more races
Our particular column of interest here was the number of people identifying as American Indian and Alaska Native alone.
We limited our analysis to places with a population greater than 5,000 people. That left us with 82 cities.
We then calculated the percentage of residents that are American Indian and Alaska Native. The percentages ranked from 4.73 to 0.00.
Finally, we ranked each city based on the percentage of the American Indian and Alaska Native population, with a higher score being more American Indian and Alaska Native than a lower score. Roosevelt took the distinction of being the most American Indian and Alaska Native, while Woods Cross was the least Native American city.
We updated this article for 2026. This article is our eleventh time ranking the cities in Utah with the largest Native American population.
The full plate
Most Native American Places In Utah
Click any column to sort. Search by city name.
| Rank | City | Population | Native American Population | % Native American |
|---|---|---|---|---|
| 1 | Roosevelt | 7,078 | 335 | 4.7% |
| 2 | Vernal | 10,392 | 424 | 4.1% |
| 3 | South Salt Lake | 26,352 | 468 | 1.8% |
| 4 | Cedar City | 38,524 | 655 | 1.7% |
| 5 | Cedar Hills | 9,950 | 137 | 1.4% |
| 6 | Sunset | 5,587 | 69 | 1.2% |
| 7 | Brigham City | 19,992 | 206 | 1.0% |
| 8 | American Fork | 37,109 | 317 | 0.9% |
| 9 | Price | 8,248 | 64 | 0.8% |
| 10 | West Valley City | 138,437 | 1,013 | 0.7% |
| 11 | South Ogden | 17,650 | 127 | 0.7% |
| 12 | Midvale | 35,989 | 237 | 0.7% |
| 13 | Riverton | 45,457 | 286 | 0.6% |
| 14 | Clearfield | 33,523 | 199 | 0.6% |
| 15 | Taylorsville | 58,678 | 327 | 0.6% |
| 16 | Kaysville | 33,053 | 179 | 0.5% |
| 17 | Washington Terrace | 9,182 | 48 | 0.5% |
| 18 | Murray | 50,188 | 249 | 0.5% |
| 19 | Salt Lake City | 208,007 | 1,018 | 0.5% |
| 20 | Riverdale | 9,279 | 45 | 0.5% |
| 21 | Hurricane | 22,771 | 110 | 0.5% |
| 22 | Washington | 32,348 | 153 | 0.5% |
| 23 | St. George | 101,995 | 476 | 0.5% |
| 24 | Sandy | 94,291 | 418 | 0.4% |
| 25 | Ogden | 87,413 | 383 | 0.4% |
| 26 | Tooele | 38,405 | 166 | 0.4% |
| 27 | Hooper | 9,338 | 39 | 0.4% |
| 28 | Orem | 97,182 | 402 | 0.4% |
| 29 | Nephi | 6,885 | 28 | 0.4% |
| 30 | Syracuse | 35,488 | 130 | 0.4% |
| 31 | Holladay | 31,099 | 104 | 0.3% |
| 32 | Roy | 38,993 | 126 | 0.3% |
| 33 | Draper | 50,278 | 151 | 0.3% |
| 34 | Bountiful | 45,023 | 125 | 0.3% |
| 35 | West Jordan | 116,692 | 313 | 0.3% |
| 36 | South Jordan | 82,686 | 201 | 0.2% |
| 37 | Spanish Fork | 44,946 | 106 | 0.2% |
| 38 | Payson | 23,039 | 52 | 0.2% |
| 39 | West Point | 11,929 | 26 | 0.2% |
| 40 | Bluffdale | 18,797 | 40 | 0.2% |
| 41 | Springville | 35,849 | 76 | 0.2% |
| 42 | Highland | 20,119 | 41 | 0.2% |
| 43 | Farmington | 25,389 | 48 | 0.2% |
| 44 | Providence | 8,947 | 16 | 0.2% |
| 45 | Clinton | 23,612 | 41 | 0.2% |
| 46 | Eagle Mountain | 53,290 | 89 | 0.2% |
| 47 | Provo | 114,766 | 184 | 0.2% |
| 48 | North Salt Lake | 23,474 | 37 | 0.2% |
| 49 | West Bountiful | 5,915 | 9 | 0.2% |
| 50 | Plain City | 8,396 | 12 | 0.1% |
| 51 | Santaquin | 16,436 | 23 | 0.1% |
| 52 | Layton | 83,286 | 115 | 0.1% |
| 53 | Pleasant View | 11,217 | 14 | 0.1% |
| 54 | Cottonwood Heights | 32,828 | 40 | 0.1% |
| 55 | Pleasant Grove | 37,852 | 40 | 0.1% |
| 56 | North Ogden | 21,947 | 23 | 0.1% |
| 57 | Lehi | 85,173 | 85 | 0.1% |
| 58 | Ephraim | 5,949 | 5 | 0.1% |
| 59 | Herriman | 59,346 | 47 | 0.1% |
| 60 | Heber | 18,015 | 10 | 0.1% |
| 61 | Logan | 54,907 | 28 | 0.1% |
| 62 | Smithfield | 14,408 | 6 | 0.0% |
| 63 | Richfield | 8,224 | 3 | 0.0% |
| 64 | North Logan | 11,460 | 4 | 0.0% |
| 65 | South Weber | 8,115 | 2 | 0.0% |
| 66 | Enoch | 8,144 | 2 | 0.0% |
| 67 | Alpine | 10,392 | 2 | 0.0% |
| 75 | Farr West | 7,952 | 0 | 0.0% |
| 75 | Grantsville | 14,341 | 0 | 0.0% |
| 75 | Harrisville | 6,935 | 0 | 0.0% |
| 75 | Hyrum | 10,401 | 0 | 0.0% |
| 75 | Ivins | 9,998 | 0 | 0.0% |
| 75 | Lindon | 11,765 | 0 | 0.0% |
| 75 | Santa Clara | 8,152 | 0 | 0.0% |
| 75 | Salem | 10,324 | 0 | 0.0% |
| 75 | Centerville | 16,679 | 0 | 0.0% |
| 75 | Saratoga Springs | 48,425 | 0 | 0.0% |
| 75 | Park City | 8,362 | 0 | 0.0% |
| 75 | West Haven | 21,563 | 0 | 0.0% |
| 75 | Tremonton | 11,477 | 0 | 0.0% |
| 75 | Mapleton | 13,114 | 0 | 0.0% |
| 75 | Woods Cross | 11,531 | 0 | 0.0% |
Source: U.S. Census ACS 2020-2024, table B03002. 82 Utah cities with more than 5,000 residents.
Summary
Summary: Native American Populations Across Utah
If you’re looking for a breakdown of Native American populations across Utah according to the most recent data, this is an accurate list.
The most Native American cities in Utah are Roosevelt, Vernal, South Salt Lake, Cedar City, Cedar Hills, Sunset, Brigham City, American Fork, Price, and West Valley City.


