Fort Lee, NJ
Demographics And Statistics
Living In Fort Lee, New Jersey Summary
Life in Fort Lee research summary. HomeSnacks has been using Saturday Night Science to research the quality of life in Fort Lee over the past nine years using Census, FBI, Zillow, and other primary data sources. Based on the most recently available data, we found the following about life in Fort Lee:
The population in Fort Lee is 39,818.
The median home value in Fort Lee is $577,453.
The median income in Fort Lee is $105,535.
The cost of living in Fort Lee is 141 which is 1.4x higher than the national average.
The median rent in Fort Lee is $2,255.
The unemployment rate in Fort Lee is 5.0%.
The poverty rate in Fort Lee is 8.4%.
The average high in Fort Lee is 61.9° and the average low is 46.7°.
Fort Lee SnackAbility
Overall SnackAbility
Fort Lee, NJ Crime Report
Crime in Fort Lee summary. We use data from the FBI to determine the crime rates in Fort Lee. Key points include:
There were 498 total crimes in Fort Lee in the last reporting year.
The overall crime rate per 100,000 people in Fort Lee is 1,231.3 / 100k people.
The violent crime rate per 100,000 people in Fort Lee is 131.0 / 100k people.
The property crime rate per 100,000 people in Fort Lee is 1,100.3 / 100k people.
Overall, crime in Fort Lee is -41.90% below the national average.
Total Crimes
Below National Average
Crime In Fort Lee Comparison Table
| Statistic | Count Raw |
Fort Lee / 100k People |
New Jersey / 100k People |
National / 100k People |
|---|---|---|---|---|
| Total Crimes Per 100K | 498 | 1,231.3 | 1,645.1 | 2,119.2 |
| Violent Crime | 53 | 131.0 | 217.7 | 359.0 |
| Murder | 0 | 0.0 | 2.3 | 5.0 |
| Robbery | 14 | 34.6 | 49.3 | 61.0 |
| Aggravated Assault | 33 | 81.6 | 148.8 | 256.0 |
| Property Crime | 445 | 1,100.3 | 1,427.3 | 1,760.0 |
| Burglary | 62 | 153.3 | 145.3 | 229.0 |
| Larceny | 323 | 798.6 | 1,119.4 | 1,272.0 |
| Car Theft | 60 | 148.3 | 162.6 | 259.0 |
Fort Lee, NJ Cost Of Living
Cost of living in Fort Lee summary. We use data on the cost of living to determine how expensive it is to live in Fort Lee. Real estate prices drive most of the variance in cost of living around New Jersey. Key points include:
The cost of living in Fort Lee is 141 with 100 being average.
The cost of living in Fort Lee is 1.4x higher than the national average.
The median home value in Fort Lee is $577,453.
The median income in Fort Lee is $105,535.
Fort Lee's Overall Cost Of Living
Higher Than The National Average
Cost Of Living In Fort Lee Comparison Table
| Living Expense | Fort Lee | New Jersey | National Average | |
|---|---|---|---|---|
| Overall | 141 | 122 | 100 | |
| Services | 128 | 108 | 100 | |
| Groceries | 113 | 104 | 100 | |
| Health | 122 | 99 | 100 | |
| Housing | 190 | 159 | 100 | |
| Transportation | 116 | 101 | 100 | |
| Utilities | 103 | 107 | 100 | |
Fort Lee, NJ Weather
The average high in Fort Lee is 61.9° and the average low is 46.7°.
There are 78.0 days of precipitation each year.
Expect an average of 48.7 inches of precipitation each year with 26.1 inches of snow.
| Stat | Fort Lee |
|---|---|
| Average Annual High | 61.9 |
| Average Annual Low | 46.7 |
| Annual Precipitation Days | 78.0 |
| Average Annual Precipitation | 48.7 |
| Average Annual Snowfall | 26.1 |
Average High
Days of Rain
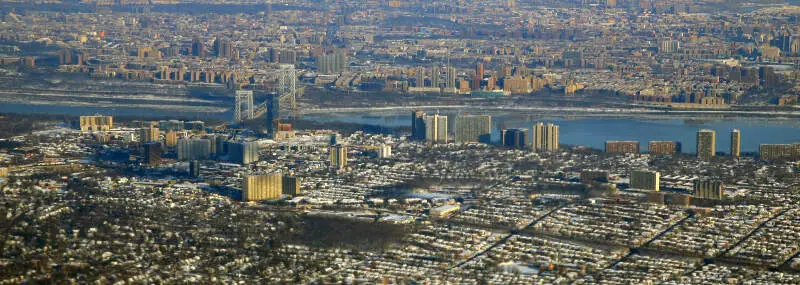
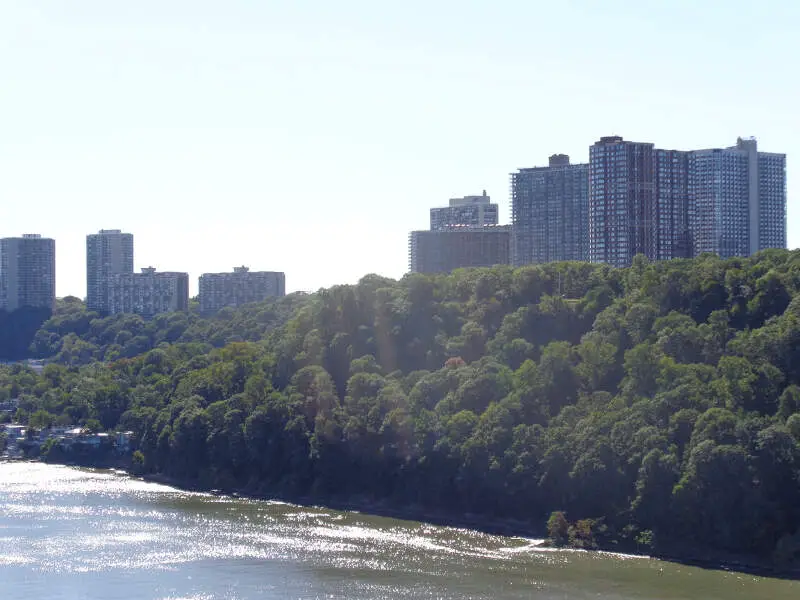
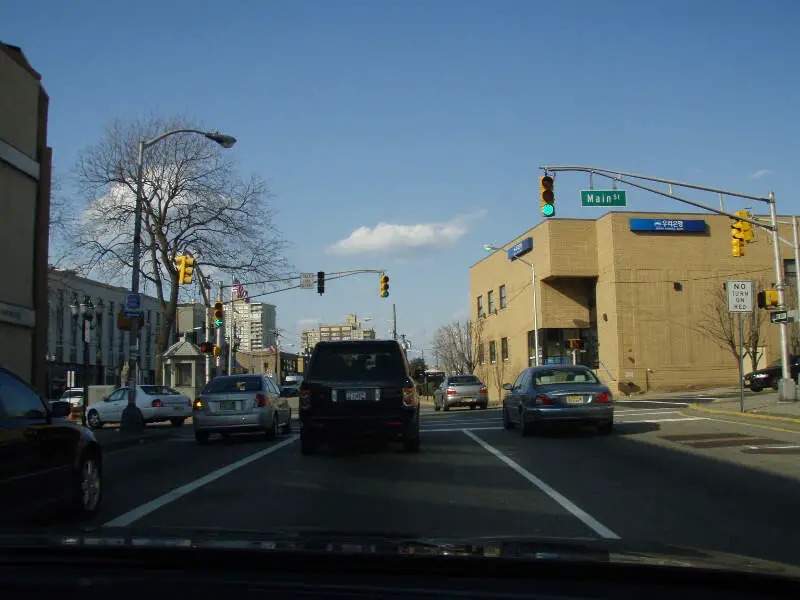
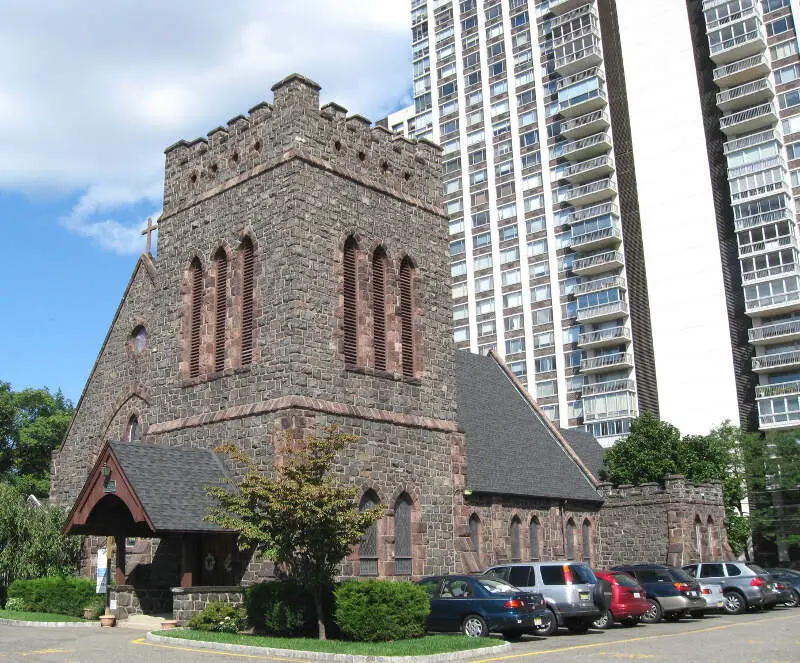
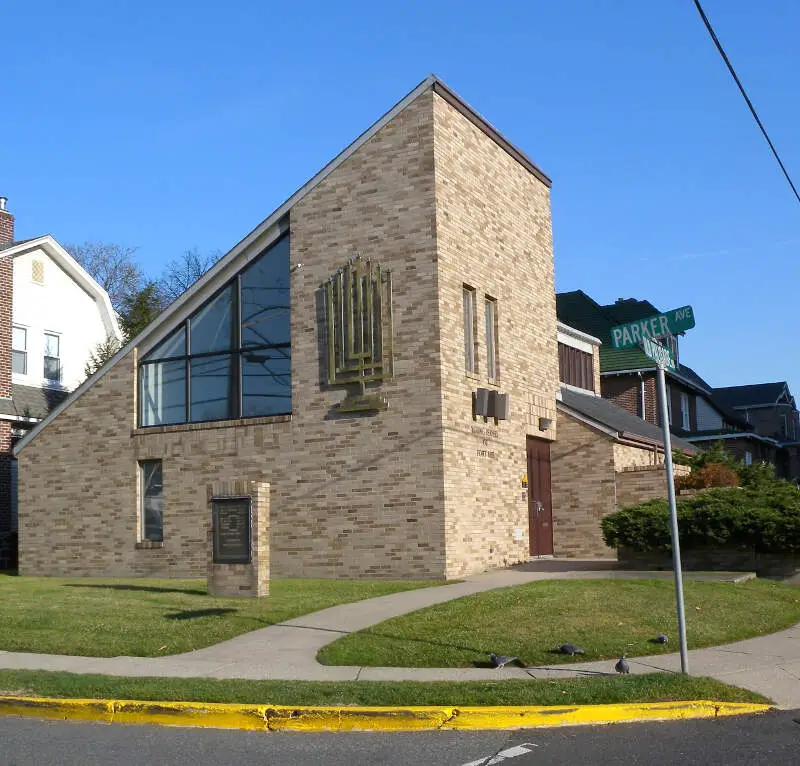
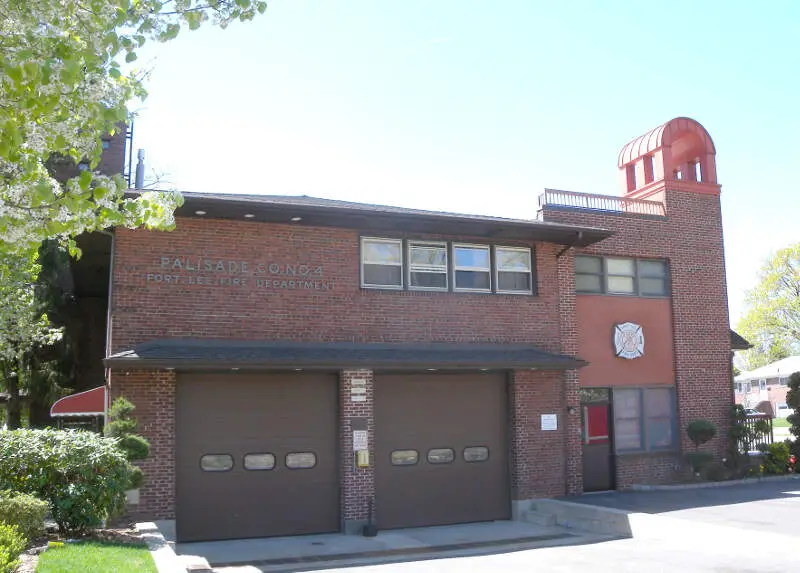
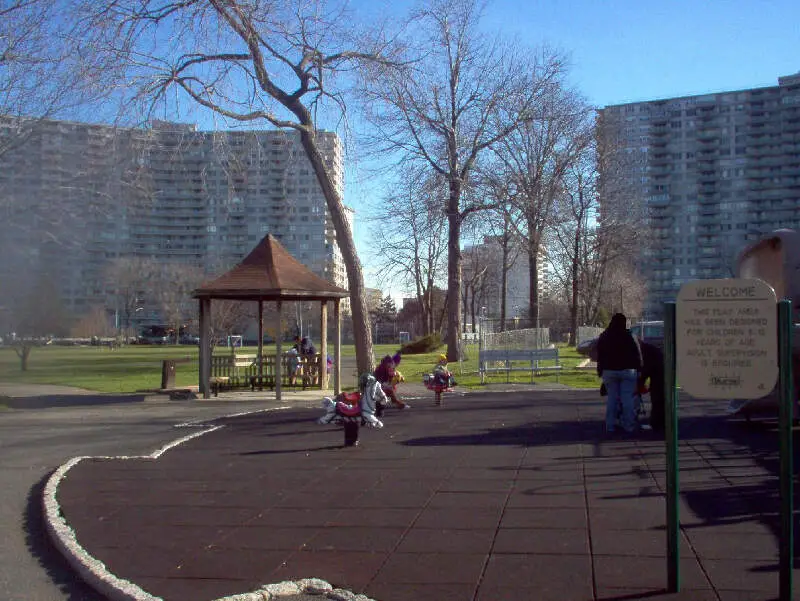
Fort Lee, NJ Photos
1 Reviews & Comments About Fort Lee
/5

HomeSnacks User - 2018-08-27 18:50:18.229578
Low to no crime. The school district is one of the best. Very calm environment. Variety of cultures in one town.
A lot of Korean and Spanish restaurants to eat at.
Rankings for Fort Lee in New Jersey


Locations Around Fort Lee
Map Of Fort Lee, NJ
Best Places Around Fort Lee
Malverne, NY
Population 8,496
Woodmere, NY
Population 18,198
Bronxville, NY
Population 6,539
Pelham Manor, NY
Population 5,648
North New Hyde Park, NY
Population 14,354
East Hills, NY
Population 7,249
Larchmont, NY
Population 6,542
Williston Park, NY
Population 7,508
Port Washington, NY
Population 17,613
Fort Lee Demographics And Statistics
Population over time in Fort Lee
The current population in Fort Lee is 39,818. The population has increased 13.2% from 2010.
| Year | Population | % Change |
|---|---|---|
| 2023 | 39,818 | 0.0% |
| 2022 | 39,799 | 0.2% |
| 2021 | 39,701 | 4.9% |
| 2020 | 37,843 | 1.1% |
| 2019 | 37,430 | 1.2% |
| 2018 | 36,990 | -0.2% |
| 2017 | 37,058 | 1.2% |
| 2016 | 36,607 | 1.0% |
| 2015 | 36,251 | 0.6% |
| 2014 | 36,048 | 1.2% |
| 2013 | 35,617 | 0.6% |
| 2012 | 35,420 | 0.4% |
| 2011 | 35,274 | 0.3% |
| 2010 | 35,161 | - |
Race / Ethnicity in Fort Lee
Fort Lee is:
38.0% White with 15,132 White residents.
2.4% African American with 950 African American residents.
0.1% American Indian with 20 American Indian residents.
44.0% Asian with 17,517 Asian residents.
0.1% Hawaiian with 42 Hawaiian residents.
0.5% Other with 211 Other residents.
2.5% Two Or More with 1,002 Two Or More residents.
12.4% Hispanic with 4,944 Hispanic residents.
| Race | Fort Lee | NJ | USA |
|---|---|---|---|
| White | 38.0% | 51.9% | 58.2% |
| African American | 2.4% | 12.3% | 12.0% |
| American Indian | 0.1% | 0.1% | 0.5% |
| Asian | 44.0% | 9.8% | 5.7% |
| Hawaiian | 0.1% | 0.0% | 0.2% |
| Other | 0.5% | 0.8% | 0.5% |
| Two Or More | 2.5% | 3.2% | 3.9% |
| Hispanic | 12.4% | 21.9% | 19.0% |
Gender in Fort Lee
Fort Lee is 51.6% female with 20,555 female residents.
Fort Lee is 48.4% male with 19,262 male residents.
| Gender | Fort Lee | NJ | USA |
|---|---|---|---|
| Female | 51.6% | 50.8% | 50.5% |
| Male | 48.4% | 49.2% | 49.5% |
Highest level of educational attainment in Fort Lee for adults over 25
4.0% of adults in Fort Lee completed < 9th grade.
2.0% of adults in Fort Lee completed 9-12th grade.
15.0% of adults in Fort Lee completed high school / ged.
10.0% of adults in Fort Lee completed some college.
5.0% of adults in Fort Lee completed associate's degree.
35.0% of adults in Fort Lee completed bachelor's degree.
18.0% of adults in Fort Lee completed master's degree.
7.0% of adults in Fort Lee completed professional degree.
4.0% of adults in Fort Lee completed doctorate degree.
| Education | Fort Lee | NJ | USA |
|---|---|---|---|
| < 9th Grade | 4.0% | 3.0% | 5.0% |
| 9-12th Grade | 2.0% | 5.0% | 6.0% |
| High School / GED | 15.0% | 26.0% | 26.0% |
| Some College | 10.0% | 15.0% | 19.0% |
| Associate's Degree | 5.0% | 7.0% | 9.0% |
| Bachelor's Degree | 35.0% | 26.0% | 21.0% |
| Master's Degree | 18.0% | 13.0% | 10.0% |
| Professional Degree | 7.0% | 3.0% | 2.0% |
| Doctorate Degree | 4.0% | 2.0% | 2.0% |
Household Income For Fort Lee, New Jersey
5.1% of households in Fort Lee earn Less than $10,000.
3.4% of households in Fort Lee earn $10,000 to $14,999.
4.4% of households in Fort Lee earn $15,000 to $24,999.
5.1% of households in Fort Lee earn $25,000 to $34,999.
7.8% of households in Fort Lee earn $35,000 to $49,999.
11.7% of households in Fort Lee earn $50,000 to $74,999.
10.0% of households in Fort Lee earn $75,000 to $99,999.
18.5% of households in Fort Lee earn $100,000 to $149,999.
12.3% of households in Fort Lee earn $150,000 to $199,999.
21.7% of households in Fort Lee earn $200,000 or more.
| Income | Fort Lee | NJ | USA |
|---|---|---|---|
| Less than $10,000 | 5.1% | 4.0% | 4.9% |
| $10,000 to $14,999 | 3.4% | 2.9% | 3.6% |
| $15,000 to $24,999 | 4.4% | 5.0% | 6.6% |
| $25,000 to $34,999 | 5.1% | 5.3% | 6.8% |
| $35,000 to $49,999 | 7.8% | 8.0% | 10.4% |
| $50,000 to $74,999 | 11.7% | 12.9% | 15.7% |
| $75,000 to $99,999 | 10.0% | 11.4% | 12.7% |
| $100,000 to $149,999 | 18.5% | 18.0% | 17.4% |
| $150,000 to $199,999 | 12.3% | 11.7% | 9.3% |
| $200,000 or more | 21.7% | 20.7% | 12.6% |


