Hoboken, NJ
Demographics And Statistics
Living In Hoboken, New Jersey Summary
Life in Hoboken research summary. HomeSnacks has been using Saturday Night Science to research the quality of life in Hoboken over the past nine years using Census, FBI, Zillow, and other primary data sources. Based on the most recently available data, we found the following about life in Hoboken:
The population in Hoboken is 58,340.
The median home value in Hoboken is $818,175.
The median income in Hoboken is $176,943.
The cost of living in Hoboken is 192 which is 1.9x higher than the national average.
The median rent in Hoboken is $2,819.
The unemployment rate in Hoboken is 3.4%.
The poverty rate in Hoboken is 7.1%.
The average high in Hoboken is 62.8° and the average low is 47.6°.
Hoboken SnackAbility
Overall SnackAbility
Hoboken, NJ Crime Report
Crime in Hoboken summary. We use data from the FBI to determine the crime rates in Hoboken. Key points include:
There were 1,130 total crimes in Hoboken in the last reporting year.
The overall crime rate per 100,000 people in Hoboken is 1,972.3 / 100k people.
The violent crime rate per 100,000 people in Hoboken is 188.5 / 100k people.
The property crime rate per 100,000 people in Hoboken is 1,783.8 / 100k people.
Overall, crime in Hoboken is -6.93% below the national average.
Total Crimes
Below National Average
Crime In Hoboken Comparison Table
| Statistic | Count Raw |
Hoboken / 100k People |
New Jersey / 100k People |
National / 100k People |
|---|---|---|---|---|
| Total Crimes Per 100K | 1,130 | 1,972.3 | 1,645.1 | 2,119.2 |
| Violent Crime | 108 | 188.5 | 217.7 | 359.0 |
| Murder | 1 | 1.7 | 2.3 | 5.0 |
| Robbery | 36 | 62.8 | 49.3 | 61.0 |
| Aggravated Assault | 70 | 122.2 | 148.8 | 256.0 |
| Property Crime | 1,022 | 1,783.8 | 1,427.3 | 1,760.0 |
| Burglary | 68 | 118.7 | 145.3 | 229.0 |
| Larceny | 894 | 1,560.4 | 1,119.4 | 1,272.0 |
| Car Theft | 60 | 104.7 | 162.6 | 259.0 |
Hoboken, NJ Cost Of Living
Cost of living in Hoboken summary. We use data on the cost of living to determine how expensive it is to live in Hoboken. Real estate prices drive most of the variance in cost of living around New Jersey. Key points include:
The cost of living in Hoboken is 192 with 100 being average.
The cost of living in Hoboken is 1.9x higher than the national average.
The median home value in Hoboken is $818,175.
The median income in Hoboken is $176,943.
Hoboken's Overall Cost Of Living
Higher Than The National Average
Cost Of Living In Hoboken Comparison Table
| Living Expense | Hoboken | New Jersey | National Average | |
|---|---|---|---|---|
| Overall | 192 | 122 | 100 | |
| Services | 129 | 108 | 100 | |
| Groceries | 111 | 104 | 100 | |
| Health | 122 | 99 | 100 | |
| Housing | 362 | 159 | 100 | |
| Transportation | 113 | 101 | 100 | |
| Utilities | 101 | 107 | 100 | |
Hoboken, NJ Weather
The average high in Hoboken is 62.8° and the average low is 47.6°.
There are 72.7 days of precipitation each year.
Expect an average of 47.6 inches of precipitation each year with 25.6 inches of snow.
| Stat | Hoboken |
|---|---|
| Average Annual High | 62.8 |
| Average Annual Low | 47.6 |
| Annual Precipitation Days | 72.7 |
| Average Annual Precipitation | 47.6 |
| Average Annual Snowfall | 25.6 |
Average High
Days of Rain
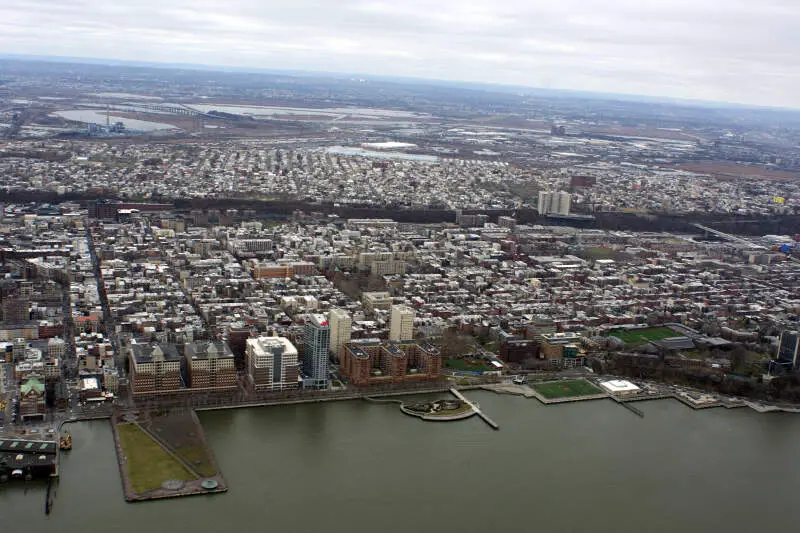
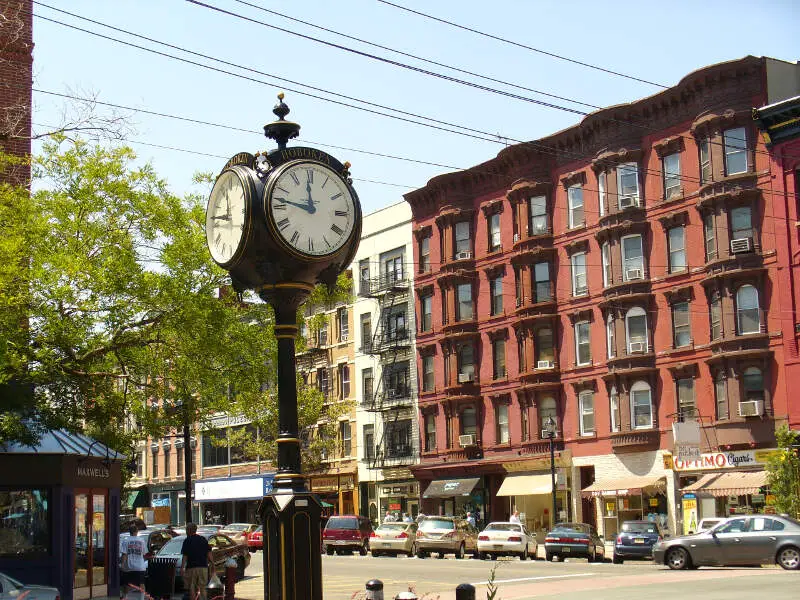
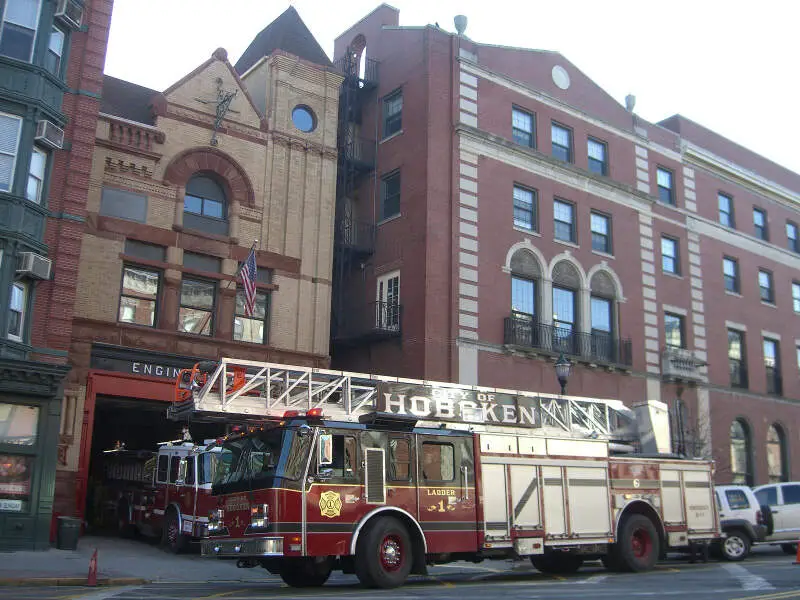
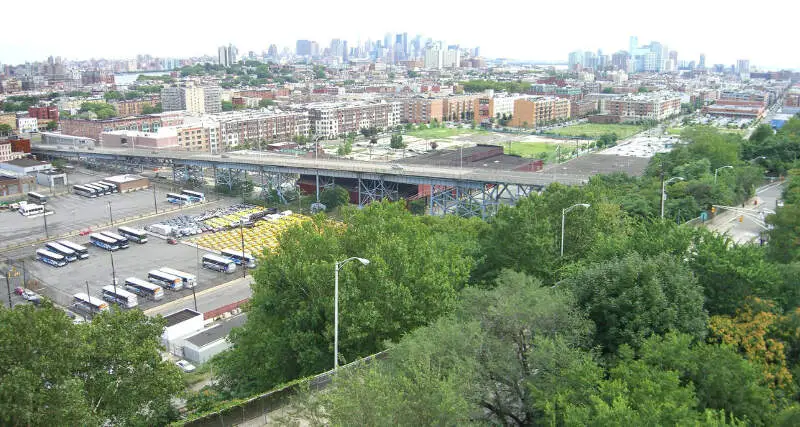
Hoboken, NJ Photos


Rankings for Hoboken in New Jersey


Locations Around Hoboken
Map Of Hoboken, NJ
Best Places Around Hoboken
Malverne, NY
Population 8,496
Woodmere, NY
Population 18,198
Bronxville, NY
Population 6,539
Pelham Manor, NY
Population 5,648
North New Hyde Park, NY
Population 14,354
Larchmont, NY
Population 6,542
Williston Park, NY
Population 7,508
Port Washington, NY
Population 17,613
South Valley Stream, NY
Population 6,177
Hoboken Demographics And Statistics
Population over time in Hoboken
The current population in Hoboken is 58,340. The population has increased 23.1% from 2010.
| Year | Population | % Change |
|---|---|---|
| 2023 | 58,340 | -0.7% |
| 2022 | 58,754 | -1.0% |
| 2021 | 59,369 | 11.4% |
| 2020 | 53,283 | 0.2% |
| 2019 | 53,193 | -0.0% |
| 2018 | 53,211 | -1.7% |
| 2017 | 54,117 | 1.8% |
| 2016 | 53,136 | 1.3% |
| 2015 | 52,452 | 0.9% |
| 2014 | 51,979 | 2.1% |
| 2013 | 50,929 | 2.1% |
| 2012 | 49,898 | 2.9% |
| 2011 | 48,515 | 2.4% |
| 2010 | 47,384 | - |
Race / Ethnicity in Hoboken
Hoboken is:
64.8% White with 37,809 White residents.
3.7% African American with 2,135 African American residents.
0.1% American Indian with 31 American Indian residents.
13.0% Asian with 7,601 Asian residents.
0.0% Hawaiian with 0 Hawaiian residents.
0.4% Other with 224 Other residents.
4.3% Two Or More with 2,499 Two Or More residents.
13.8% Hispanic with 8,041 Hispanic residents.
| Race | Hoboken | NJ | USA |
|---|---|---|---|
| White | 64.8% | 51.9% | 58.2% |
| African American | 3.7% | 12.3% | 12.0% |
| American Indian | 0.1% | 0.1% | 0.5% |
| Asian | 13.0% | 9.8% | 5.7% |
| Hawaiian | 0.0% | 0.0% | 0.2% |
| Other | 0.4% | 0.8% | 0.5% |
| Two Or More | 4.3% | 3.2% | 3.9% |
| Hispanic | 13.8% | 21.9% | 19.0% |
Gender in Hoboken
Hoboken is 50.4% female with 29,411 female residents.
Hoboken is 49.6% male with 28,928 male residents.
| Gender | Hoboken | NJ | USA |
|---|---|---|---|
| Female | 50.4% | 50.8% | 50.5% |
| Male | 49.6% | 49.2% | 49.5% |
Highest level of educational attainment in Hoboken for adults over 25
2.0% of adults in Hoboken completed < 9th grade.
1.0% of adults in Hoboken completed 9-12th grade.
7.0% of adults in Hoboken completed high school / ged.
5.0% of adults in Hoboken completed some college.
2.0% of adults in Hoboken completed associate's degree.
50.0% of adults in Hoboken completed bachelor's degree.
24.0% of adults in Hoboken completed master's degree.
6.0% of adults in Hoboken completed professional degree.
3.0% of adults in Hoboken completed doctorate degree.
| Education | Hoboken | NJ | USA |
|---|---|---|---|
| < 9th Grade | 2.0% | 3.0% | 5.0% |
| 9-12th Grade | 1.0% | 5.0% | 6.0% |
| High School / GED | 7.0% | 26.0% | 26.0% |
| Some College | 5.0% | 15.0% | 19.0% |
| Associate's Degree | 2.0% | 7.0% | 9.0% |
| Bachelor's Degree | 50.0% | 26.0% | 21.0% |
| Master's Degree | 24.0% | 13.0% | 10.0% |
| Professional Degree | 6.0% | 3.0% | 2.0% |
| Doctorate Degree | 3.0% | 2.0% | 2.0% |
Household Income For Hoboken, New Jersey
3.4% of households in Hoboken earn Less than $10,000.
2.8% of households in Hoboken earn $10,000 to $14,999.
2.9% of households in Hoboken earn $15,000 to $24,999.
2.7% of households in Hoboken earn $25,000 to $34,999.
4.2% of households in Hoboken earn $35,000 to $49,999.
5.9% of households in Hoboken earn $50,000 to $74,999.
5.8% of households in Hoboken earn $75,000 to $99,999.
14.2% of households in Hoboken earn $100,000 to $149,999.
14.3% of households in Hoboken earn $150,000 to $199,999.
43.8% of households in Hoboken earn $200,000 or more.
| Income | Hoboken | NJ | USA |
|---|---|---|---|
| Less than $10,000 | 3.4% | 4.0% | 4.9% |
| $10,000 to $14,999 | 2.8% | 2.9% | 3.6% |
| $15,000 to $24,999 | 2.9% | 5.0% | 6.6% |
| $25,000 to $34,999 | 2.7% | 5.3% | 6.8% |
| $35,000 to $49,999 | 4.2% | 8.0% | 10.4% |
| $50,000 to $74,999 | 5.9% | 12.9% | 15.7% |
| $75,000 to $99,999 | 5.8% | 11.4% | 12.7% |
| $100,000 to $149,999 | 14.2% | 18.0% | 17.4% |
| $150,000 to $199,999 | 14.3% | 11.7% | 9.3% |
| $200,000 or more | 43.8% | 20.7% | 12.6% |


