North Las Vegas, NV
Demographics And Statistics
Living In North Las Vegas, Nevada Summary
Life in North Las Vegas research summary. HomeSnacks has been using Saturday Night Science to research the quality of life in North Las Vegas over the past nine years using Census, FBI, Zillow, and other primary data sources. Based on the most recently available data, we found the following about life in North Las Vegas:
The population in North Las Vegas is 270,773.
The median home value in North Las Vegas is $407,754.
The median income in North Las Vegas is $76,772.
The cost of living in North Las Vegas is 108 which is 1.1x higher than the national average.
The median rent in North Las Vegas is $1,605.
The unemployment rate in North Las Vegas is 8.1%.
The poverty rate in North Las Vegas is 12.2%.
The average high in North Las Vegas is 80.8° and the average low is 54.0°.
North Las Vegas SnackAbility
Overall SnackAbility
North Las Vegas, NV Crime Report
Crime in North Las Vegas summary. We use data from the FBI to determine the crime rates in North Las Vegas. Key points include:
There were 6,889 total crimes in North Las Vegas in the last reporting year.
The overall crime rate per 100,000 people in North Las Vegas is 2,350.4 / 100k people.
The violent crime rate per 100,000 people in North Las Vegas is 388.9 / 100k people.
The property crime rate per 100,000 people in North Las Vegas is 1,961.4 / 100k people.
Overall, crime in North Las Vegas is 10.91% above the national average.
Total Crimes
Above National Average
Crime In North Las Vegas Comparison Table
| Statistic | Count Raw |
North Las Vegas / 100k People |
Nevada / 100k People |
National / 100k People |
|---|---|---|---|---|
| Total Crimes Per 100K | 6,889 | 2,350.4 | 2,599.0 | 2,119.2 |
| Violent Crime | 1,140 | 388.9 | 402.0 | 359.0 |
| Murder | 35 | 11.9 | 6.1 | 5.0 |
| Robbery | 329 | 112.2 | 63.1 | 61.0 |
| Aggravated Assault | 679 | 231.7 | 281.0 | 256.0 |
| Property Crime | 5,749 | 1,961.4 | 2,197.0 | 1,760.0 |
| Burglary | 959 | 327.2 | 364.4 | 229.0 |
| Larceny | 2,737 | 933.8 | 1,357.2 | 1,272.0 |
| Car Theft | 2,053 | 700.4 | 475.4 | 259.0 |
North Las Vegas, NV Cost Of Living
Cost of living in North Las Vegas summary. We use data on the cost of living to determine how expensive it is to live in North Las Vegas. Real estate prices drive most of the variance in cost of living around Nevada. Key points include:
The cost of living in North Las Vegas is 108 with 100 being average.
The cost of living in North Las Vegas is 1.1x higher than the national average.
The median home value in North Las Vegas is $407,754.
The median income in North Las Vegas is $76,772.
North Las Vegas's Overall Cost Of Living
Higher Than The National Average
Cost Of Living In North Las Vegas Comparison Table
| Living Expense | North Las Vegas | Nevada | National Average | |
|---|---|---|---|---|
| Overall | 108 | 101 | 100 | |
| Services | 85 | 93 | 100 | |
| Groceries | 106 | 104 | 100 | |
| Health | 89 | 94 | 100 | |
| Housing | 138 | 105 | 100 | |
| Transportation | 110 | 118 | 100 | |
| Utilities | 105 | 101 | 100 | |
North Las Vegas, NV Weather
The average high in North Las Vegas is 80.8° and the average low is 54.0°.
There are 11.6 days of precipitation each year.
Expect an average of 4.5 inches of precipitation each year with 0.1 inches of snow.
| Stat | North Las Vegas |
|---|---|
| Average Annual High | 80.8 |
| Average Annual Low | 54.0 |
| Annual Precipitation Days | 11.6 |
| Average Annual Precipitation | 4.5 |
| Average Annual Snowfall | 0.1 |
Average High
Days of Rain
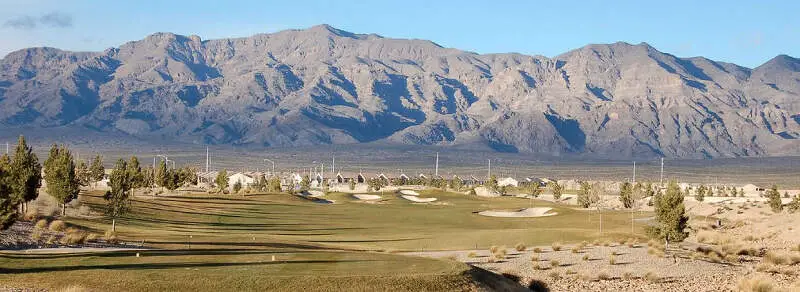
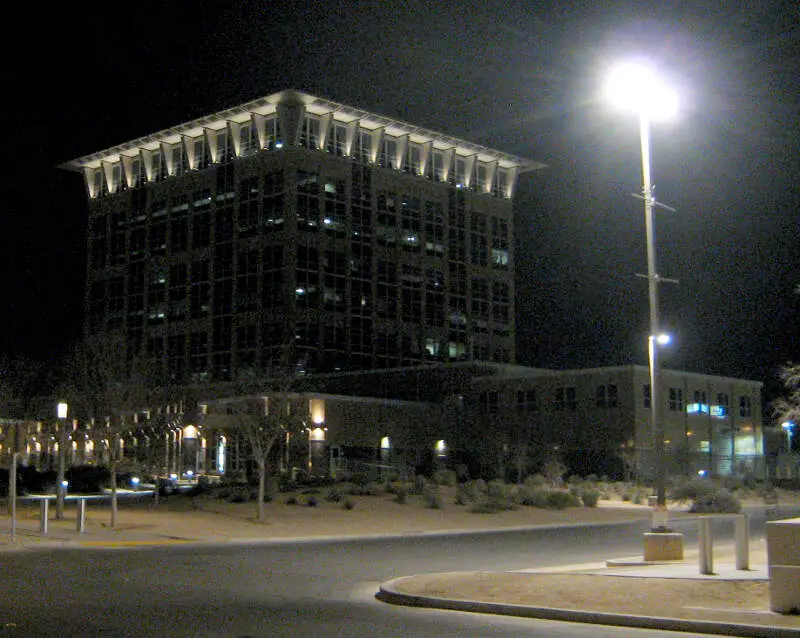
North Las Vegas, NV Photos
Rankings for North Las Vegas in Nevada


Locations Around North Las Vegas
Map Of North Las Vegas, NV
Best Places Around North Las Vegas
Summerlin South, NV
Population 30,075
Henderson, NV
Population 324,523
Enterprise, NV
Population 232,043
Spring Valley, NV
Population 219,913
Las Vegas, NV
Population 650,873
Winchester, NV
Population 37,774
Whitney, NV
Population 46,268
Paradise, NV
Population 186,178
Sunrise Manor, NV
Population 199,099
North Las Vegas Demographics And Statistics
Population over time in North Las Vegas
The current population in North Las Vegas is 270,773. The population has increased 32.8% from 2010.
| Year | Population | % Change |
|---|---|---|
| 2023 | 270,773 | 2.6% |
| 2022 | 264,022 | 1.7% |
| 2021 | 259,638 | 5.0% |
| 2020 | 247,248 | 2.4% |
| 2019 | 241,369 | 1.8% |
| 2018 | 236,986 | 1.1% |
| 2017 | 234,389 | 1.7% |
| 2016 | 230,436 | 1.6% |
| 2015 | 226,860 | 1.6% |
| 2014 | 223,336 | 1.6% |
| 2013 | 219,725 | 1.8% |
| 2012 | 215,762 | 2.5% |
| 2011 | 210,458 | 3.2% |
| 2010 | 203,951 | - |
Race / Ethnicity in North Las Vegas
North Las Vegas is:
23.4% White with 63,474 White residents.
21.2% African American with 57,392 African American residents.
0.3% American Indian with 879 American Indian residents.
6.8% Asian with 18,429 Asian residents.
0.7% Hawaiian with 2,019 Hawaiian residents.
0.4% Other with 1,094 Other residents.
5.8% Two Or More with 15,659 Two Or More residents.
41.3% Hispanic with 111,827 Hispanic residents.
| Race | North Las Vegas | NV | USA |
|---|---|---|---|
| White | 23.4% | 46.0% | 58.2% |
| African American | 21.2% | 9.1% | 12.0% |
| American Indian | 0.3% | 0.6% | 0.5% |
| Asian | 6.8% | 8.5% | 5.7% |
| Hawaiian | 0.7% | 0.7% | 0.2% |
| Other | 0.4% | 0.5% | 0.5% |
| Two Or More | 5.8% | 5.4% | 3.9% |
| Hispanic | 41.3% | 29.2% | 19.0% |
Gender in North Las Vegas
North Las Vegas is 51.2% female with 138,642 female residents.
North Las Vegas is 48.8% male with 132,131 male residents.
| Gender | North Las Vegas | NV | USA |
|---|---|---|---|
| Female | 51.2% | 49.6% | 50.5% |
| Male | 48.8% | 50.4% | 49.5% |
Highest level of educational attainment in North Las Vegas for adults over 25
7.0% of adults in North Las Vegas completed < 9th grade.
9.0% of adults in North Las Vegas completed 9-12th grade.
33.0% of adults in North Las Vegas completed high school / ged.
23.0% of adults in North Las Vegas completed some college.
9.0% of adults in North Las Vegas completed associate's degree.
12.0% of adults in North Las Vegas completed bachelor's degree.
5.0% of adults in North Las Vegas completed master's degree.
1.0% of adults in North Las Vegas completed professional degree.
1.0% of adults in North Las Vegas completed doctorate degree.
| Education | North Las Vegas | NV | USA |
|---|---|---|---|
| < 9th Grade | 7.0% | 5.0% | 5.0% |
| 9-12th Grade | 9.0% | 7.0% | 6.0% |
| High School / GED | 33.0% | 27.0% | 26.0% |
| Some College | 23.0% | 24.0% | 19.0% |
| Associate's Degree | 9.0% | 9.0% | 9.0% |
| Bachelor's Degree | 12.0% | 18.0% | 21.0% |
| Master's Degree | 5.0% | 7.0% | 10.0% |
| Professional Degree | 1.0% | 2.0% | 2.0% |
| Doctorate Degree | 1.0% | 1.0% | 2.0% |
Household Income For North Las Vegas, Nevada
4.6% of households in North Las Vegas earn Less than $10,000.
2.8% of households in North Las Vegas earn $10,000 to $14,999.
5.4% of households in North Las Vegas earn $15,000 to $24,999.
7.2% of households in North Las Vegas earn $25,000 to $34,999.
11.2% of households in North Las Vegas earn $35,000 to $49,999.
17.5% of households in North Las Vegas earn $50,000 to $74,999.
15.5% of households in North Las Vegas earn $75,000 to $99,999.
20.4% of households in North Las Vegas earn $100,000 to $149,999.
8.7% of households in North Las Vegas earn $150,000 to $199,999.
6.8% of households in North Las Vegas earn $200,000 or more.
| Income | North Las Vegas | NV | USA |
|---|---|---|---|
| Less than $10,000 | 4.6% | 5.2% | 4.9% |
| $10,000 to $14,999 | 2.8% | 2.9% | 3.6% |
| $15,000 to $24,999 | 5.4% | 6.3% | 6.6% |
| $25,000 to $34,999 | 7.2% | 7.1% | 6.8% |
| $35,000 to $49,999 | 11.2% | 11.1% | 10.4% |
| $50,000 to $74,999 | 17.5% | 17.0% | 15.7% |
| $75,000 to $99,999 | 15.5% | 13.6% | 12.7% |
| $100,000 to $149,999 | 20.4% | 18.1% | 17.4% |
| $150,000 to $199,999 | 8.7% | 8.8% | 9.3% |
| $200,000 or more | 6.8% | 9.8% | 12.6% |


