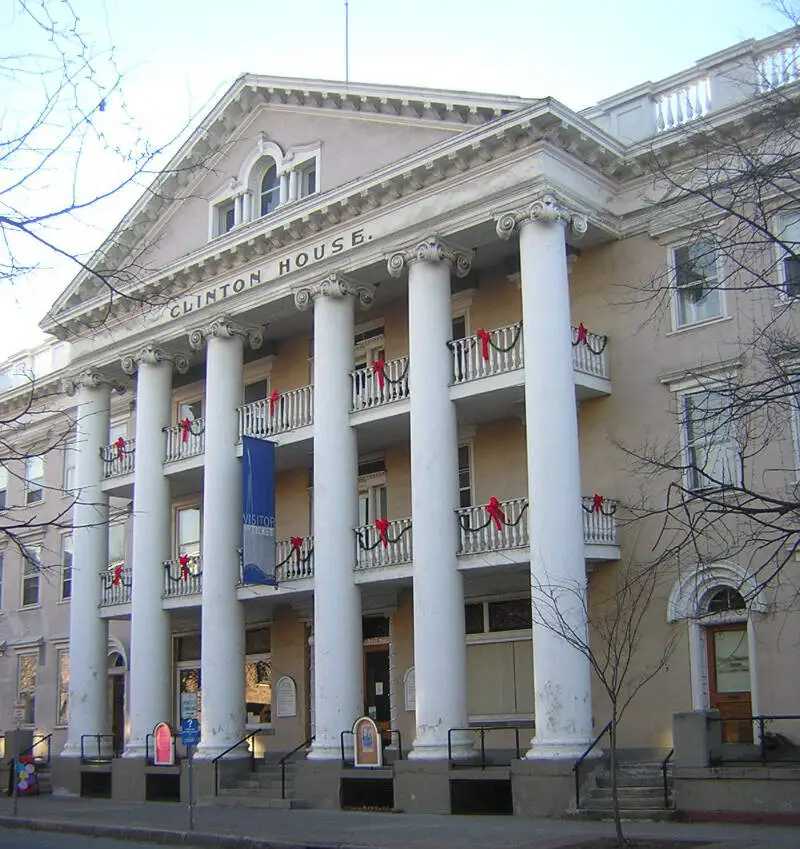
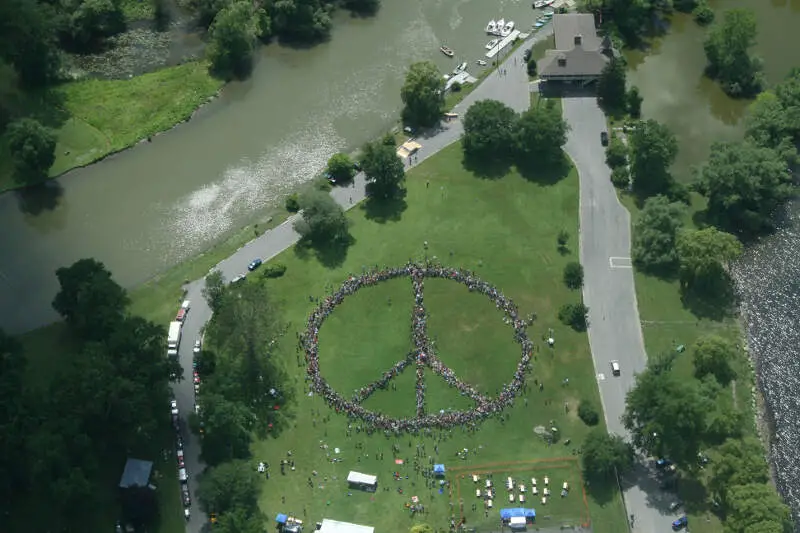
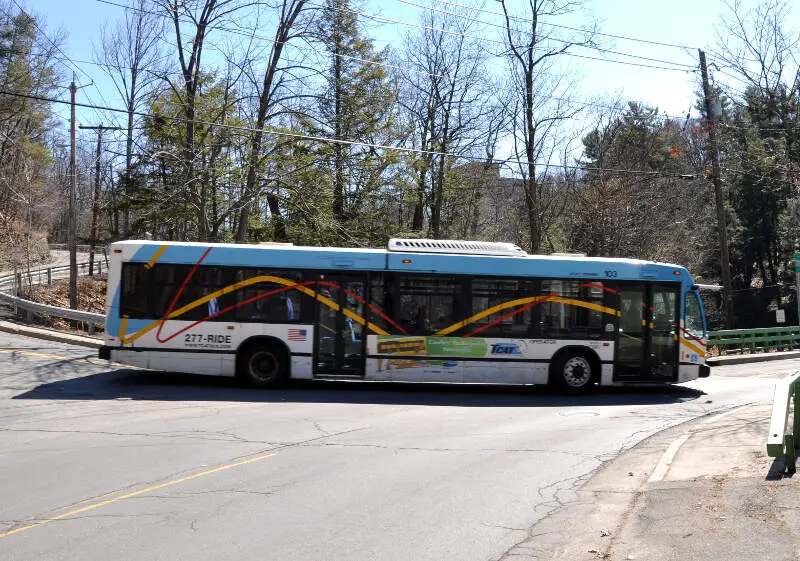
Ithaca, NY
Demographics And Statistics
Living In Ithaca, New York Summary
Life in Ithaca research summary. HomeSnacks has been using Saturday Night Science to research the quality of life in Ithaca over the past nine years using Census, FBI, Zillow, and other primary data sources. Based on the most recently available data, we found the following about life in Ithaca:
The population in Ithaca is 31,792.
The median home value in Ithaca is $416,732.
The median income in Ithaca is $48,617.
The cost of living in Ithaca is 111 which is 1.1x higher than the national average.
The median rent in Ithaca is $1,441.
The unemployment rate in Ithaca is 7.1%.
The poverty rate in Ithaca is 28.4%.
The average high in Ithaca is 57.8° and the average low is 37.5°.
Ithaca SnackAbility
Overall SnackAbility
Ithaca, NY Crime Report
Crime in Ithaca summary. We use data from the FBI to determine the crime rates in Ithaca. Key points include:
There were 1,148 total crimes in Ithaca in the last reporting year.
The overall crime rate per 100,000 people in Ithaca is 3,412.0 / 100k people.
The violent crime rate per 100,000 people in Ithaca is 196.2 / 100k people.
The property crime rate per 100,000 people in Ithaca is 3,215.8 / 100k people.
Overall, crime in Ithaca is 61.00% above the national average.
Total Crimes
Above National Average
Crime In Ithaca Comparison Table
| Statistic | Count Raw |
Ithaca / 100k People |
New York / 100k People |
National / 100k People |
|---|---|---|---|---|
| Total Crimes Per 100K | 1,148 | 3,412.0 | 2,099.7 | 2,119.2 |
| Violent Crime | 66 | 196.2 | 380.2 | 359.0 |
| Murder | 1 | 3.0 | 2.7 | 5.0 |
| Robbery | 16 | 47.6 | 96.1 | 61.0 |
| Aggravated Assault | 43 | 127.8 | 259.6 | 256.0 |
| Property Crime | 1,082 | 3,215.8 | 1,719.5 | 1,760.0 |
| Burglary | 111 | 329.9 | 136.6 | 229.0 |
| Larceny | 955 | 2,838.4 | 1,432.8 | 1,272.0 |
| Car Theft | 16 | 47.6 | 150.2 | 259.0 |
Ithaca, NY Cost Of Living
Cost of living in Ithaca summary. We use data on the cost of living to determine how expensive it is to live in Ithaca. Real estate prices drive most of the variance in cost of living around New York. Key points include:
The cost of living in Ithaca is 111 with 100 being average.
The cost of living in Ithaca is 1.1x higher than the national average.
The median home value in Ithaca is $416,732.
The median income in Ithaca is $48,617.
Ithaca's Overall Cost Of Living
Higher Than The National Average
Cost Of Living In Ithaca Comparison Table
| Living Expense | Ithaca | New York | National Average | |
|---|---|---|---|---|
| Overall | 111 | 119 | 100 | |
| Services | 102 | 110 | 100 | |
| Groceries | 97 | 103 | 100 | |
| Health | 101 | 101 | 100 | |
| Housing | 138 | 145 | 100 | |
| Transportation | 108 | 105 | 100 | |
| Utilities | 106 | 99 | 100 | |
Ithaca, NY Weather
The average high in Ithaca is 57.8° and the average low is 37.5°.
There are 84.6 days of precipitation each year.
Expect an average of 34.7 inches of precipitation each year with 64.0 inches of snow.
| Stat | Ithaca |
|---|---|
| Average Annual High | 57.8 |
| Average Annual Low | 37.5 |
| Annual Precipitation Days | 84.6 |
| Average Annual Precipitation | 34.7 |
| Average Annual Snowfall | 64.0 |
Average High
Days of Rain
Ithaca, NY Photos


Rankings for Ithaca in New York


Locations Around Ithaca
Map Of Ithaca, NY
Best Places Around Ithaca
South Hill, NY
Population 6,805
Westvale, NY
Population 5,293
Fairmount, NY
Population 9,998
Endwell, NY
Population 11,821
Big Flats, NY
Population 5,846
Seneca Falls, NY
Population 6,967
Solvay, NY
Population 6,590
Penn Yan, NY
Population 4,800
Baldwinsville, NY
Population 7,732
Sayre, PA
Population 5,444
Ithaca Demographics And Statistics
Population over time in Ithaca
The current population in Ithaca is 31,792. The population has increased 6.8% from 2010.
| Year | Population | % Change |
|---|---|---|
| 2023 | 31,792 | 1.4% |
| 2022 | 31,359 | -1.4% |
| 2021 | 31,819 | 3.6% |
| 2020 | 30,715 | 0.5% |
| 2019 | 30,569 | 0.0% |
| 2018 | 30,568 | -0.5% |
| 2017 | 30,720 | 0.3% |
| 2016 | 30,625 | 0.2% |
| 2015 | 30,565 | 0.5% |
| 2014 | 30,399 | 0.6% |
| 2013 | 30,225 | 0.7% |
| 2012 | 30,016 | 0.5% |
| 2011 | 29,880 | 0.4% |
| 2010 | 29,774 | - |
Race / Ethnicity in Ithaca
Ithaca is:
62.8% White with 19,968 White residents.
5.1% African American with 1,624 African American residents.
0.3% American Indian with 88 American Indian residents.
15.1% Asian with 4,785 Asian residents.
0.1% Hawaiian with 20 Hawaiian residents.
2.0% Other with 634 Other residents.
5.5% Two Or More with 1,738 Two Or More residents.
9.2% Hispanic with 2,935 Hispanic residents.
| Race | Ithaca | NY | USA |
|---|---|---|---|
| White | 62.8% | 53.4% | 58.2% |
| African American | 5.1% | 13.6% | 12.0% |
| American Indian | 0.3% | 0.2% | 0.5% |
| Asian | 15.1% | 8.8% | 5.7% |
| Hawaiian | 0.1% | 0.0% | 0.2% |
| Other | 2.0% | 0.9% | 0.5% |
| Two Or More | 5.5% | 3.4% | 3.9% |
| Hispanic | 9.2% | 19.6% | 19.0% |
Gender in Ithaca
Ithaca is 49.0% female with 15,576 female residents.
Ithaca is 51.0% male with 16,216 male residents.
| Gender | Ithaca | NY | USA |
|---|---|---|---|
| Female | 49.0% | 51.2% | 50.5% |
| Male | 51.0% | 48.8% | 49.5% |
Highest level of educational attainment in Ithaca for adults over 25
3.0% of adults in Ithaca completed < 9th grade.
1.0% of adults in Ithaca completed 9-12th grade.
8.0% of adults in Ithaca completed high school / ged.
11.0% of adults in Ithaca completed some college.
6.0% of adults in Ithaca completed associate's degree.
27.0% of adults in Ithaca completed bachelor's degree.
26.0% of adults in Ithaca completed master's degree.
3.0% of adults in Ithaca completed professional degree.
15.0% of adults in Ithaca completed doctorate degree.
| Education | Ithaca | NY | USA |
|---|---|---|---|
| < 9th Grade | 3.0% | 5.0% | 5.0% |
| 9-12th Grade | 1.0% | 6.0% | 6.0% |
| High School / GED | 8.0% | 25.0% | 26.0% |
| Some College | 11.0% | 15.0% | 19.0% |
| Associate's Degree | 6.0% | 9.0% | 9.0% |
| Bachelor's Degree | 27.0% | 22.0% | 21.0% |
| Master's Degree | 26.0% | 13.0% | 10.0% |
| Professional Degree | 3.0% | 3.0% | 2.0% |
| Doctorate Degree | 15.0% | 2.0% | 2.0% |
Household Income For Ithaca, New York
16.8% of households in Ithaca earn Less than $10,000.
5.0% of households in Ithaca earn $10,000 to $14,999.
7.6% of households in Ithaca earn $15,000 to $24,999.
8.9% of households in Ithaca earn $25,000 to $34,999.
14.0% of households in Ithaca earn $35,000 to $49,999.
12.4% of households in Ithaca earn $50,000 to $74,999.
8.9% of households in Ithaca earn $75,000 to $99,999.
9.6% of households in Ithaca earn $100,000 to $149,999.
6.6% of households in Ithaca earn $150,000 to $199,999.
10.1% of households in Ithaca earn $200,000 or more.
| Income | Ithaca | NY | USA |
|---|---|---|---|
| Less than $10,000 | 16.8% | 5.7% | 4.9% |
| $10,000 to $14,999 | 5.0% | 4.1% | 3.6% |
| $15,000 to $24,999 | 7.6% | 6.5% | 6.6% |
| $25,000 to $34,999 | 8.9% | 6.2% | 6.8% |
| $35,000 to $49,999 | 14.0% | 9.1% | 10.4% |
| $50,000 to $74,999 | 12.4% | 13.8% | 15.7% |
| $75,000 to $99,999 | 8.9% | 11.4% | 12.7% |
| $100,000 to $149,999 | 9.6% | 16.8% | 17.4% |
| $150,000 to $199,999 | 6.6% | 10.1% | 9.3% |
| $200,000 or more | 10.1% | 16.4% | 12.6% |


