Oneonta SnackAbility
Overall SnackAbility
Cost of living in Oneonta summary. We use data on the cost of living to determine how expensive it is to live in Oneonta. Real estate prices drive most of the variance in cost of living around New York. Key points include:
The cost of living in Oneonta is 101 with 100 being average.
The cost of living in Oneonta is 1.0x higher than the national average.
The median home value in Oneonta is $220,587.
The median income in Oneonta is $61,111.
Oneonta's Overall Cost Of Living
Higher Than The National Average
Cost Of Living In Oneonta Comparison Table
| Living Expense | Oneonta | New York | National Average |
|---|---|---|---|
| Overall | 101 | 121 | 100 |
| Services | 107 | 105 | 100 |
| Groceries | 109 | 108 | 100 |
| Health | 84 | 143 | 100 |
| Housing | 113 | 112 | 100 |
| Transportation | 111 | 114 | 100 |
| Utilities | 114 | 111 | 100 |
Source: Cost of living index, normalized to US average = 100
Oneonta, NY Weather
The average high in Oneonta is 56.9° and the average low is 35.0°.
There are 87.4 days of precipitation each year.
Expect an average of 42.7 inches of precipitation each year with 77.5 inches of snow.
| Stat | Oneonta |
|---|---|
| Average Annual High | 56.9 |
| Average Annual Low | 35.0 |
| Annual Precipitation Days | 87.4 |
| Average Annual Precipitation | 42.7 |
| Average Annual Snowfall | 77.5 |
Average High
Days of Rain
Source: NOAA climate normals (30-year)
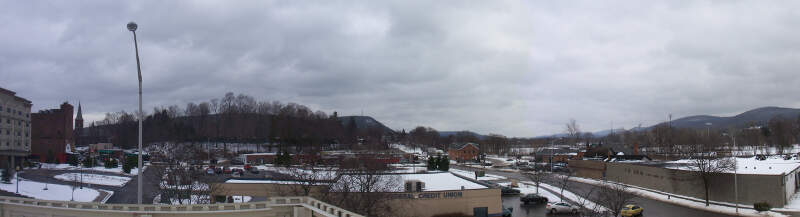
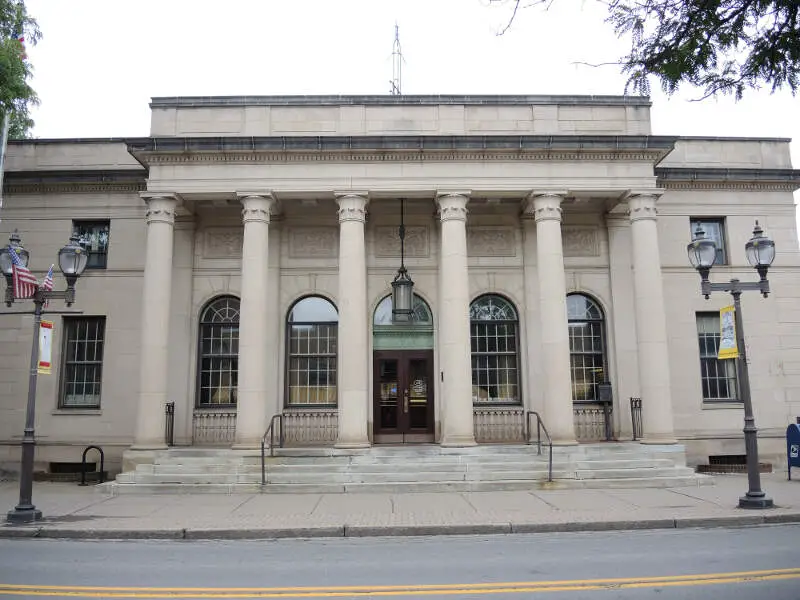
Oneonta, NY Photos
Rankings & Articles For Oneonta


Locations Around Oneonta
Map Of Oneonta, NY
Best Places Around Oneonta
Norwich, NY
Population 6,782
Binghamton, NY
Population 47,151
Ilion, NY
Population 7,593
Utica, NY
Population 64,217
Herkimer, NY
Population 7,566
Oneonta Demographics And Statistics
Population over time in Oneonta
The current population in Oneonta is 15,045. The population has increased 7.4% from 2010.
| Year | Population | % Change |
|---|---|---|
| 2024 | 15,045 | 4.0% |
| 2023 | 14,467 | 2.6% |
| 2022 | 14,097 | 10.4% |
| 2021 | 12,764 | -7.9% |
| 2020 | 13,855 | -0.3% |
| 2019 | 13,893 | 0.4% |
| 2018 | 13,834 | -0.7% |
| 2017 | 13,932 | 0.5% |
| 2016 | 13,863 | 0.0% |
| 2015 | 13,862 | -0.3% |
| 2014 | 13,906 | -0.1% |
| 2013 | 13,922 | 0.2% |
| 2012 | 13,890 | -0.3% |
| 2011 | 13,938 | -0.5% |
| 2010 | 14,006 | - |
Race / Ethnicity in Oneonta
See the full breakdown
Oneonta is:
79.9% White with 12,020 White residents.
5.7% African American with 859 African American residents.
0.1% American Indian with 21 American Indian residents.
2.5% Asian with 374 Asian residents.
0.0% Hawaiian with 0 Hawaiian residents.
1.2% Other with 178 Other residents.
2.8% Two Or More with 419 Two Or More residents.
7.8% Hispanic with 1,174 Hispanic residents.
| Race | Oneonta | NY | USA |
|---|---|---|---|
| White | 79.9% | 52.8% | 57.4% |
| African American | 5.7% | 13.4% | 11.9% |
| American Indian | 0.1% | 0.2% | 0.5% |
| Asian | 2.5% | 9.0% | 5.9% |
| Hawaiian | 0.0% | 0.0% | 0.2% |
| Other | 1.2% | 1.0% | 0.6% |
| Two Or More | 2.8% | 3.8% | 4.3% |
| Hispanic | 7.8% | 19.8% | 19.3% |
Gender in Oneonta
See the full breakdown
Oneonta is 51.5% female with 7,745 female residents.
Oneonta is 48.5% male with 7,299 male residents.
| Gender | Oneonta | NY | USA |
|---|---|---|---|
| Female | 51.5% | 51.2% | 50.5% |
| Male | 48.5% | 48.8% | 49.5% |
Highest level of educational attainment in Oneonta for adults over 25
See the full breakdown
3.0% of adults in Oneonta completed < 9th grade.
3.0% of adults in Oneonta completed 9-12th grade.
21.0% of adults in Oneonta completed high school / ged.
17.0% of adults in Oneonta completed some college.
9.0% of adults in Oneonta completed associate's degree.
25.0% of adults in Oneonta completed bachelor's degree.
17.0% of adults in Oneonta completed master's degree.
3.0% of adults in Oneonta completed professional degree.
2.0% of adults in Oneonta completed doctorate degree.
| Education | Oneonta | NY | USA |
|---|---|---|---|
| < 9th Grade | 3.0% | 6.0% | 4.0% |
| 9-12th Grade | 3.0% | 6.0% | 6.0% |
| High School / GED | 21.0% | 24.0% | 26.0% |
| Some College | 17.0% | 15.0% | 19.0% |
| Associate's Degree | 9.0% | 9.0% | 9.0% |
| Bachelor's Degree | 25.0% | 22.0% | 22.0% |
| Master's Degree | 17.0% | 13.0% | 10.0% |
| Professional Degree | 3.0% | 3.0% | 2.0% |
| Doctorate Degree | 2.0% | 2.0% | 2.0% |
Household Income For Oneonta, New York
See the full breakdown
4.2% of households in Oneonta earn Less than $10,000.
5.4% of households in Oneonta earn $10,000 to $14,999.
11.1% of households in Oneonta earn $15,000 to $24,999.
8.1% of households in Oneonta earn $25,000 to $34,999.
11.3% of households in Oneonta earn $35,000 to $49,999.
23.3% of households in Oneonta earn $50,000 to $74,999.
11.9% of households in Oneonta earn $75,000 to $99,999.
15.5% of households in Oneonta earn $100,000 to $149,999.
5.1% of households in Oneonta earn $150,000 to $199,999.
4.2% of households in Oneonta earn $200,000 or more.
| Income | Oneonta | NY | USA |
|---|---|---|---|
| Less than $10,000 | 4.2% | 5.8% | 5.0% |
| $10,000 to $14,999 | 5.4% | 3.9% | 3.4% |
| $15,000 to $24,999 | 11.1% | 6.3% | 6.3% |
| $25,000 to $34,999 | 8.1% | 6.2% | 6.6% |
| $35,000 to $49,999 | 11.3% | 8.9% | 10.1% |
| $50,000 to $74,999 | 23.3% | 13.6% | 15.5% |
| $75,000 to $99,999 | 11.9% | 11.4% | 12.6% |
| $100,000 to $149,999 | 15.5% | 16.7% | 17.5% |
| $150,000 to $199,999 | 5.1% | 10.1% | 9.6% |
| $200,000 or more | 4.2% | 17.1% | 13.4% |
Source: U.S. Census ACS 5-year estimates (2024)


