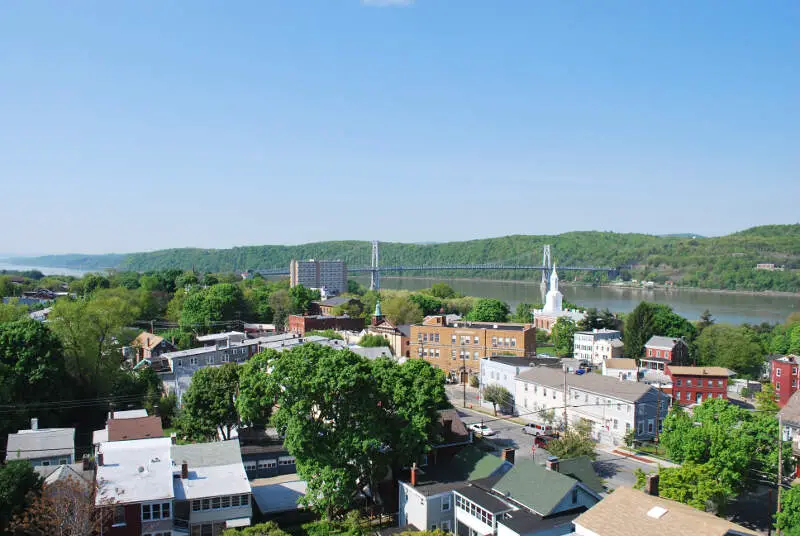
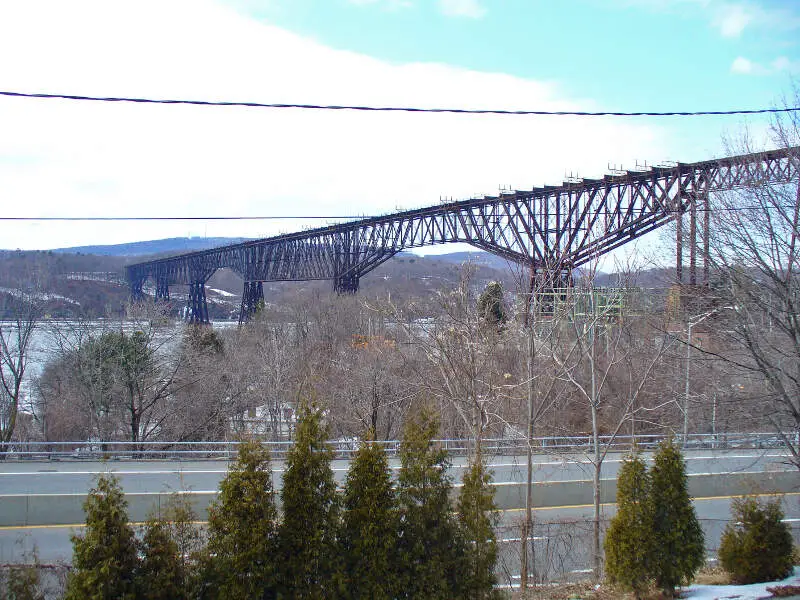
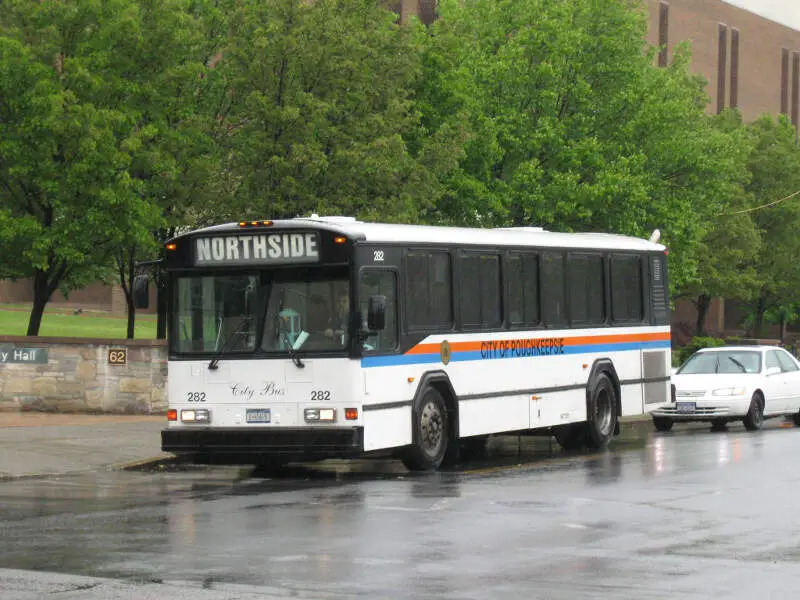
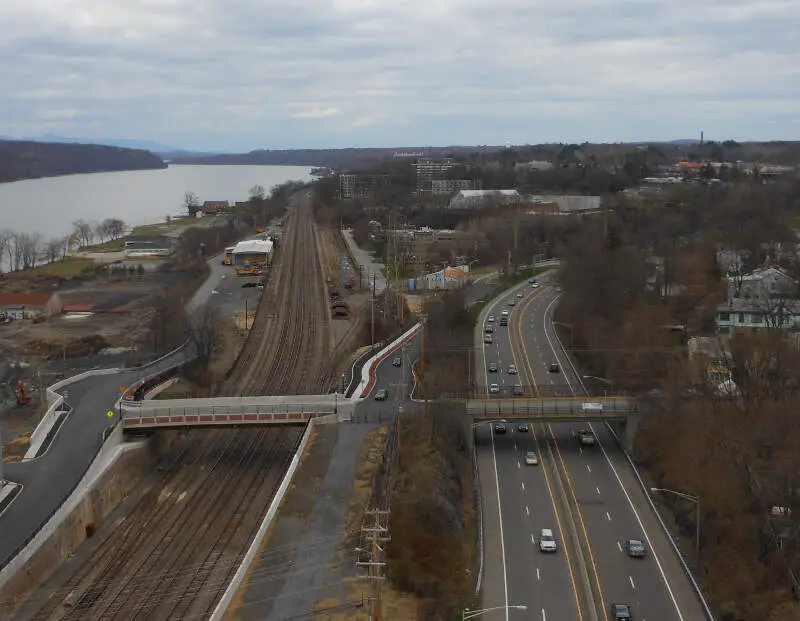
Poughkeepsie, NY
Demographics And Statistics
Living In Poughkeepsie, New York Summary
Life in Poughkeepsie research summary. HomeSnacks has been using Saturday Night Science to research the quality of life in Poughkeepsie over the past nine years using Census, FBI, Zillow, and other primary data sources. Based on the most recently available data, we found the following about life in Poughkeepsie:
The population in Poughkeepsie is 31,778.
The median home value in Poughkeepsie is $327,224.
The median income in Poughkeepsie is $60,050.
The cost of living in Poughkeepsie is 115 which is 1.1x higher than the national average.
The median rent in Poughkeepsie is $1,370.
The unemployment rate in Poughkeepsie is 7.8%.
The poverty rate in Poughkeepsie is 18.0%.
The average high in Poughkeepsie is 61.2° and the average low is 39.5°.
Poughkeepsie SnackAbility
Overall SnackAbility
Poughkeepsie, NY Crime Report
Crime in Poughkeepsie summary. We use data from the FBI to determine the crime rates in Poughkeepsie. Key points include:
There were 726 total crimes in Poughkeepsie in the last reporting year.
The overall crime rate per 100,000 people in Poughkeepsie is 2,279.9 / 100k people.
The violent crime rate per 100,000 people in Poughkeepsie is 643.8 / 100k people.
The property crime rate per 100,000 people in Poughkeepsie is 1,636.2 / 100k people.
Overall, crime in Poughkeepsie is 7.58% above the national average.
Total Crimes
Above National Average
Crime In Poughkeepsie Comparison Table
| Statistic | Count Raw |
Poughkeepsie / 100k People |
New York / 100k People |
National / 100k People |
|---|---|---|---|---|
| Total Crimes Per 100K | 726 | 2,279.9 | 2,099.7 | 2,119.2 |
| Violent Crime | 205 | 643.8 | 380.2 | 359.0 |
| Murder | 2 | 6.3 | 2.7 | 5.0 |
| Robbery | 33 | 103.6 | 96.1 | 61.0 |
| Aggravated Assault | 150 | 471.1 | 259.6 | 256.0 |
| Property Crime | 521 | 1,636.2 | 1,719.5 | 1,760.0 |
| Burglary | 78 | 245.0 | 136.6 | 229.0 |
| Larceny | 403 | 1,265.6 | 1,432.8 | 1,272.0 |
| Car Theft | 40 | 125.6 | 150.2 | 259.0 |
Poughkeepsie, NY Cost Of Living
Cost of living in Poughkeepsie summary. We use data on the cost of living to determine how expensive it is to live in Poughkeepsie. Real estate prices drive most of the variance in cost of living around New York. Key points include:
The cost of living in Poughkeepsie is 115 with 100 being average.
The cost of living in Poughkeepsie is 1.1x higher than the national average.
The median home value in Poughkeepsie is $327,224.
The median income in Poughkeepsie is $60,050.
Poughkeepsie's Overall Cost Of Living
Higher Than The National Average
Cost Of Living In Poughkeepsie Comparison Table
| Living Expense | Poughkeepsie | New York | National Average | |
|---|---|---|---|---|
| Overall | 115 | 119 | 100 | |
| Services | 111 | 110 | 100 | |
| Groceries | 106 | 103 | 100 | |
| Health | 110 | 101 | 100 | |
| Housing | 111 | 145 | 100 | |
| Transportation | 103 | 105 | 100 | |
| Utilities | 132 | 99 | 100 | |
Poughkeepsie, NY Weather
The average high in Poughkeepsie is 61.2° and the average low is 39.5°.
There are 81.2 days of precipitation each year.
Expect an average of 43.7 inches of precipitation each year with 42.9 inches of snow.
| Stat | Poughkeepsie |
|---|---|
| Average Annual High | 61.2 |
| Average Annual Low | 39.5 |
| Annual Precipitation Days | 81.2 |
| Average Annual Precipitation | 43.7 |
| Average Annual Snowfall | 42.9 |
Average High
Days of Rain
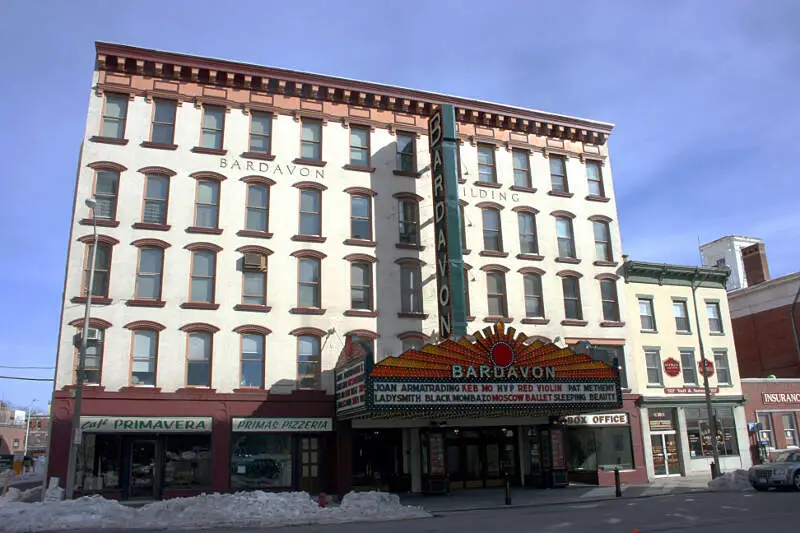
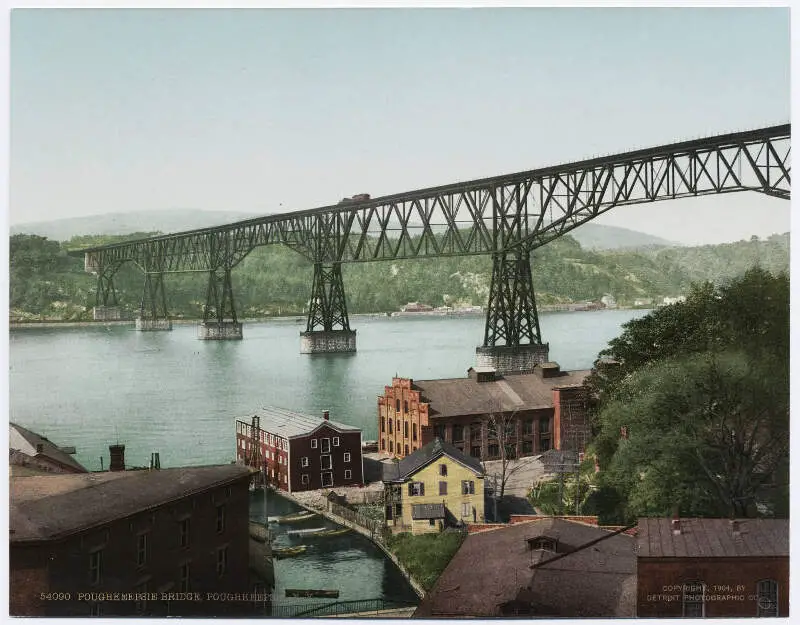
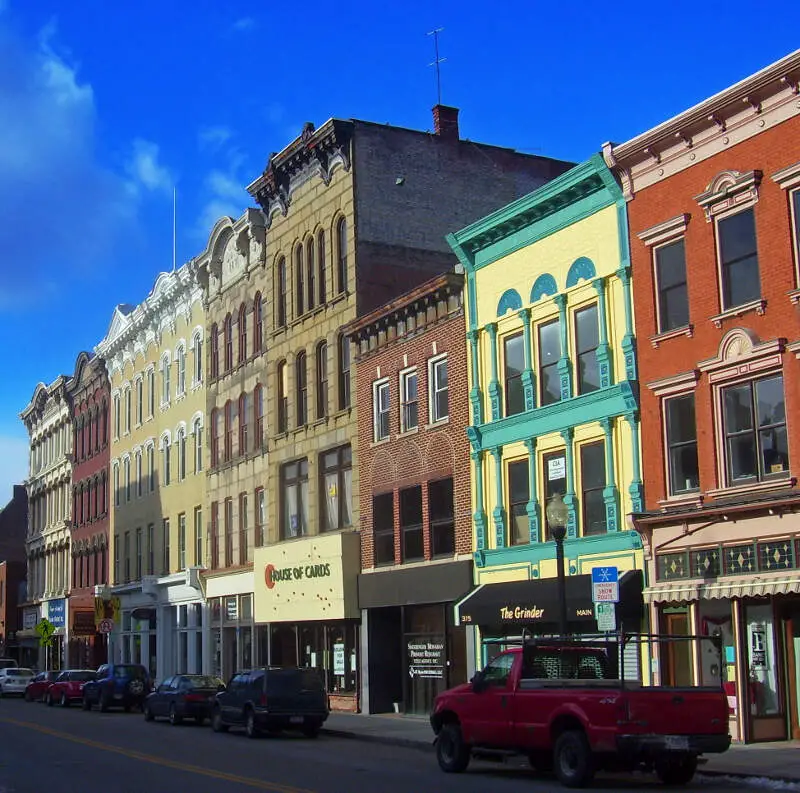
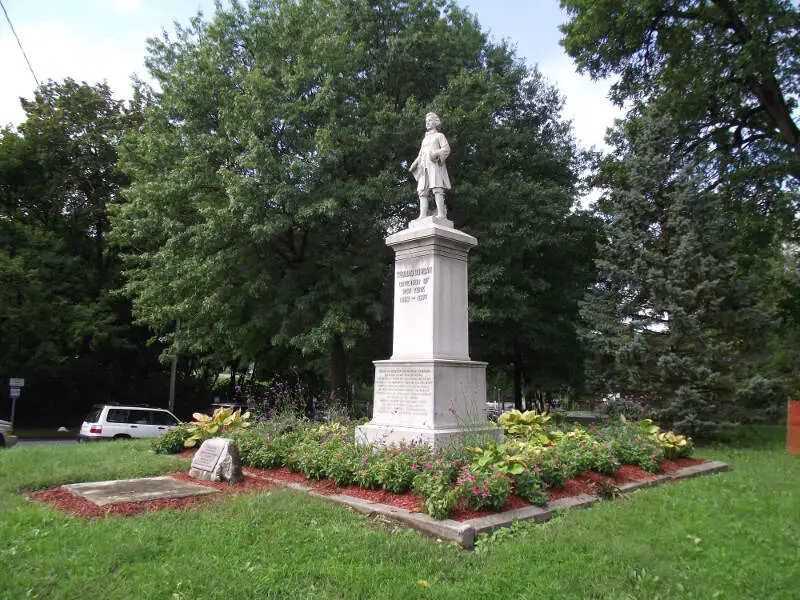
Poughkeepsie, NY Photos

Rankings for Poughkeepsie in New York


Locations Around Poughkeepsie
Map Of Poughkeepsie, NY
Best Places Around Poughkeepsie
Myers Corner, NY
Population 10,786
Orange Lake, NY
Population 9,588
New Windsor, NY
Population 8,427
Walden, NY
Population 6,871
Wappingers Falls, NY
Population 5,694
New Paltz, NY
Population 8,028
Beacon, NY
Population 14,629
Newburgh, NY
Population 28,649
Highland, NY
Population 6,321
Poughkeepsie Demographics And Statistics
Population over time in Poughkeepsie
The current population in Poughkeepsie is 31,778. The population has decreased -2.0% from 2010.
| Year | Population | % Change |
|---|---|---|
| 2023 | 31,778 | 0.2% |
| 2022 | 31,717 | 0.8% |
| 2021 | 31,475 | 3.7% |
| 2020 | 30,341 | -0.1% |
| 2019 | 30,381 | 0.1% |
| 2018 | 30,356 | -0.5% |
| 2017 | 30,505 | -0.0% |
| 2016 | 30,511 | -0.4% |
| 2015 | 30,635 | -0.3% |
| 2014 | 30,716 | -1.5% |
| 2013 | 31,172 | -1.3% |
| 2012 | 31,593 | -3.0% |
| 2011 | 32,564 | 0.4% |
| 2010 | 32,441 | - |
Race / Ethnicity in Poughkeepsie
Poughkeepsie is:
34.5% White with 10,968 White residents.
31.3% African American with 9,947 African American residents.
0.1% American Indian with 43 American Indian residents.
1.4% Asian with 454 Asian residents.
0.0% Hawaiian with 0 Hawaiian residents.
1.1% Other with 355 Other residents.
6.8% Two Or More with 2,173 Two Or More residents.
24.7% Hispanic with 7,838 Hispanic residents.
| Race | Poughkeepsie | NY | USA |
|---|---|---|---|
| White | 34.5% | 53.4% | 58.2% |
| African American | 31.3% | 13.6% | 12.0% |
| American Indian | 0.1% | 0.2% | 0.5% |
| Asian | 1.4% | 8.8% | 5.7% |
| Hawaiian | 0.0% | 0.0% | 0.2% |
| Other | 1.1% | 0.9% | 0.5% |
| Two Or More | 6.8% | 3.4% | 3.9% |
| Hispanic | 24.7% | 19.6% | 19.0% |
Gender in Poughkeepsie
Poughkeepsie is 51.4% female with 16,330 female residents.
Poughkeepsie is 48.6% male with 15,447 male residents.
| Gender | Poughkeepsie | NY | USA |
|---|---|---|---|
| Female | 51.4% | 51.2% | 50.5% |
| Male | 48.6% | 48.8% | 49.5% |
Highest level of educational attainment in Poughkeepsie for adults over 25
7.0% of adults in Poughkeepsie completed < 9th grade.
7.0% of adults in Poughkeepsie completed 9-12th grade.
30.0% of adults in Poughkeepsie completed high school / ged.
17.0% of adults in Poughkeepsie completed some college.
8.0% of adults in Poughkeepsie completed associate's degree.
17.0% of adults in Poughkeepsie completed bachelor's degree.
11.0% of adults in Poughkeepsie completed master's degree.
2.0% of adults in Poughkeepsie completed professional degree.
1.0% of adults in Poughkeepsie completed doctorate degree.
| Education | Poughkeepsie | NY | USA |
|---|---|---|---|
| < 9th Grade | 7.0% | 5.0% | 5.0% |
| 9-12th Grade | 7.0% | 6.0% | 6.0% |
| High School / GED | 30.0% | 25.0% | 26.0% |
| Some College | 17.0% | 15.0% | 19.0% |
| Associate's Degree | 8.0% | 9.0% | 9.0% |
| Bachelor's Degree | 17.0% | 22.0% | 21.0% |
| Master's Degree | 11.0% | 13.0% | 10.0% |
| Professional Degree | 2.0% | 3.0% | 2.0% |
| Doctorate Degree | 1.0% | 2.0% | 2.0% |
Household Income For Poughkeepsie, New York
7.5% of households in Poughkeepsie earn Less than $10,000.
5.9% of households in Poughkeepsie earn $10,000 to $14,999.
9.6% of households in Poughkeepsie earn $15,000 to $24,999.
10.1% of households in Poughkeepsie earn $25,000 to $34,999.
9.9% of households in Poughkeepsie earn $35,000 to $49,999.
17.1% of households in Poughkeepsie earn $50,000 to $74,999.
10.9% of households in Poughkeepsie earn $75,000 to $99,999.
15.0% of households in Poughkeepsie earn $100,000 to $149,999.
5.5% of households in Poughkeepsie earn $150,000 to $199,999.
8.5% of households in Poughkeepsie earn $200,000 or more.
| Income | Poughkeepsie | NY | USA |
|---|---|---|---|
| Less than $10,000 | 7.5% | 5.7% | 4.9% |
| $10,000 to $14,999 | 5.9% | 4.1% | 3.6% |
| $15,000 to $24,999 | 9.6% | 6.5% | 6.6% |
| $25,000 to $34,999 | 10.1% | 6.2% | 6.8% |
| $35,000 to $49,999 | 9.9% | 9.1% | 10.4% |
| $50,000 to $74,999 | 17.1% | 13.8% | 15.7% |
| $75,000 to $99,999 | 10.9% | 11.4% | 12.7% |
| $100,000 to $149,999 | 15.0% | 16.8% | 17.4% |
| $150,000 to $199,999 | 5.5% | 10.1% | 9.3% |
| $200,000 or more | 8.5% | 16.4% | 12.6% |


