Dayton SnackAbility
Overall SnackAbility
Crime in Dayton summary. We use data from the FBI to determine the crime rates in Dayton. Key points include:
There were 7,651 total crimes in Dayton in the last reporting year.
The overall crime rate per 100,000 people in Dayton is 5,673.4 / 100k people.
The violent crime rate per 100,000 people in Dayton is 1,339.2 / 100k people.
The property crime rate per 100,000 people in Dayton is 4,334.2 / 100k people.
Overall, crime in Dayton is 167.71% above the national average.
Total Crimes
Above National Average
Crime In Dayton Comparison Table
| Statistic | Count Raw |
Dayton / 100k People |
Ohio / 100k People |
National / 100k People |
|---|---|---|---|---|
| Total Crimes Per 100K | 7,651 | 5,673.4 | 1,844.9 | 2,119.2 |
| Violent Crime | 1,806 | 1,339.2 | 293.7 | 359.0 |
| Murder | 40 | 29.7 | 5.0 | 5.0 |
| Robbery | 341 | 252.9 | 45.5 | 61.0 |
| Aggravated Assault | 1,268 | 940.3 | 197.4 | 256.0 |
| Property Crime | 5,845 | 4,334.2 | 1,551.2 | 1,760.0 |
| Burglary | 1,159 | 859.4 | 206.0 | 229.0 |
| Larceny | 2,892 | 2,144.5 | 1,132.8 | 1,272.0 |
| Car Theft | 1,794 | 1,330.3 | 212.5 | 259.0 |
Source: FBI Uniform Crime Reporting (2024)
Cost of living in Dayton summary. We use data on the cost of living to determine how expensive it is to live in Dayton. Real estate prices drive most of the variance in cost of living around Ohio. Key points include:
The cost of living in Dayton is 81 with 100 being average.
The cost of living in Dayton is 0.8x lower than the national average.
The median home value in Dayton is $136,592.
The median income in Dayton is $45,247.
Dayton's Overall Cost Of Living
Lower Than The National Average
Cost Of Living In Dayton Comparison Table
| Living Expense | Dayton | Ohio | National Average |
|---|---|---|---|
| Overall | 81 | 90 | 100 |
| Services | 99 | 97 | 100 |
| Groceries | 97 | 97 | 100 |
| Health | 51 | 75 | 100 |
| Housing | 93 | 97 | 100 |
| Transportation | 96 | 95 | 100 |
| Utilities | 95 | 97 | 100 |
Source: Cost of living index, normalized to US average = 100
Dayton, OH Weather
The average high in Dayton is 62.6° and the average low is 43.3°.
There are 76.7 days of precipitation each year.
Expect an average of 40.6 inches of precipitation each year with 15.1 inches of snow.
| Stat | Dayton |
|---|---|
| Average Annual High | 62.6 |
| Average Annual Low | 43.3 |
| Annual Precipitation Days | 76.7 |
| Average Annual Precipitation | 40.6 |
| Average Annual Snowfall | 15.1 |
Average High
Days of Rain
Source: NOAA climate normals (30-year)
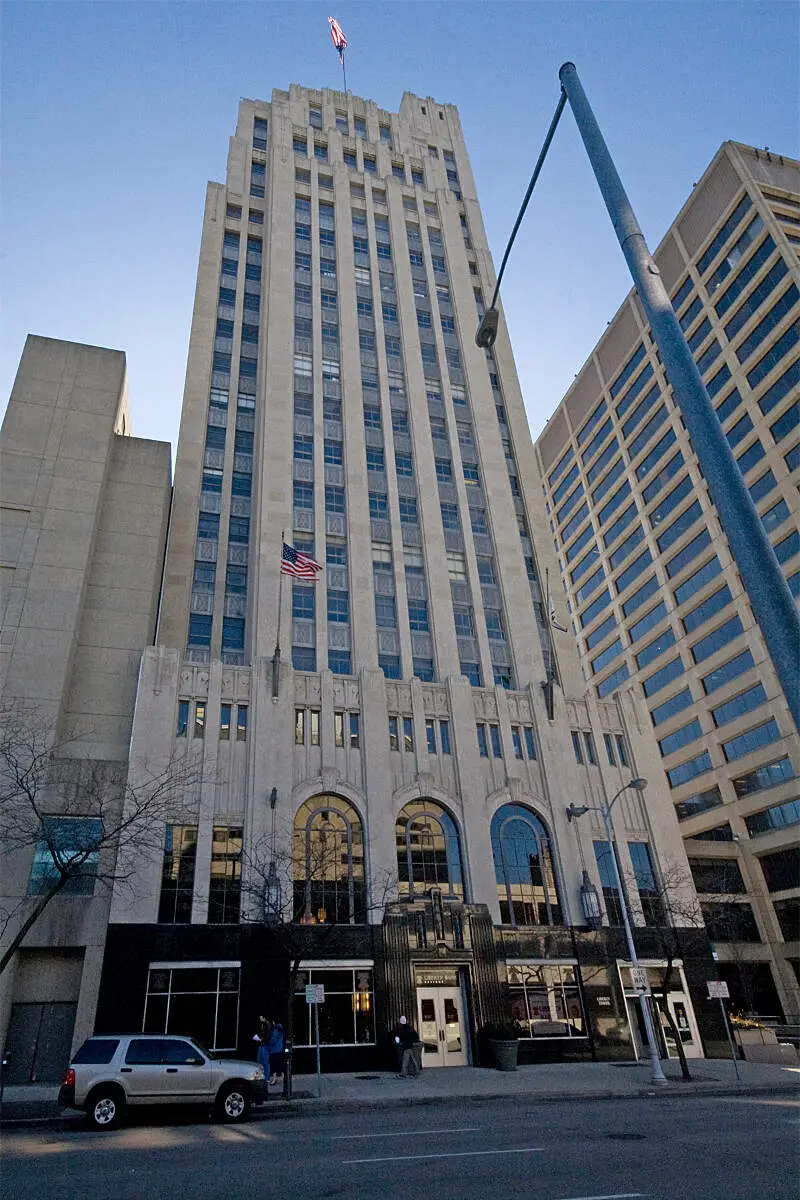
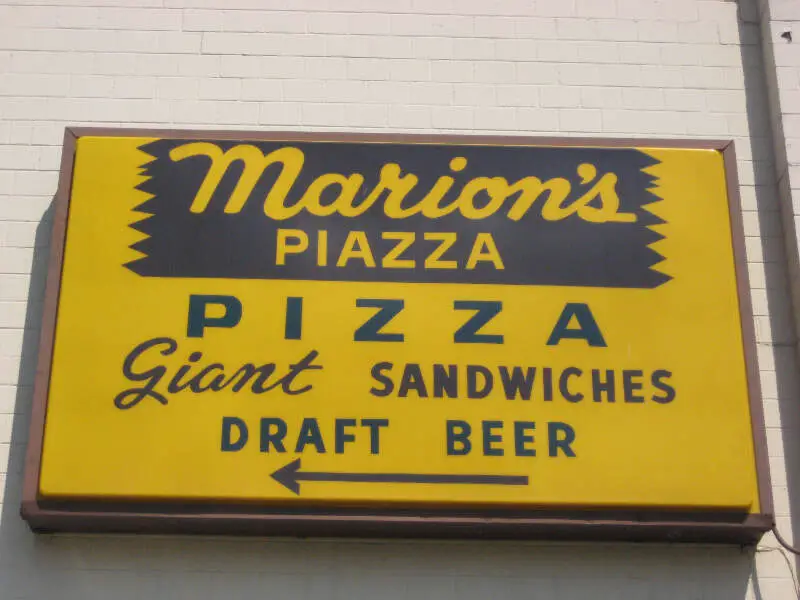
Dayton, OH Photos


7 Reviews & Comments About Dayton

Hey let me tell you...Dayton is a SHITHOLE.
What do you expect in the armpit of America-
All kidding aside,what killed Dayton was job loss. Back in the 40s & 50s, Dayton was a great place. Tons of jobs, good neighborhoods and great schools. You could come here and get a good job without a college degree. GM, Panasonic, Standard Register, NCR, Delphi Chassis, GE...the list goes on. As time went on, these companies moved to areas with cheaper overhead...I.e. out of state or country. All of those places I listed are gone. Closed.
No decent jobs are left here, unless you work at the air force base or one of our many hospitals. The hospitals stay busy with all the shootings, stabbings and h****n ODs.
Dayton is a bygone town from a bygone era and it gets worse every day. I was born and raised here, but I would leave tomorrow if I didn't have family to take care of. The powers that be here are not interested in revitalizing the city. There is so much abandoned property here that the city could offer potential interests a good land deal or tax breaks, but seem to be too greedy to let that happen.
Nothing here will change until something different is done.
Dayton is horrible. I live in a suburb of it and am from a another suburb it. My ex from when I was in high school, lived in Dayton I stay the night with him and his sister one night. The lived on a small dead end Street. We were eating pizza. When we heard a loud clash/yelling from outside. He look out the peep hole there were over 30 teenagers in mob yelling at us to come out. His sister was pregnant at the time. Him and her boyfriend went outside and she called the cops. Once they were out side they were getting jumped by all of those people. Two of the young female from that mob of people started yelling at her and I. All we could do is watch in horror. Oh they also broke the back window on their roommates Ford Fiesta with a brick. When the teenagers heard sirens they all scattered. And my ex and his sister's boyfriend were b****y and bruised.
I remember my ex saying they were saying that we jumped one of their friends, but we'd been together all day long so there was no way.
I live in Dayton Ohio the area that I live is pretty tuff but my area is getting pretty bad so I always lock my doors so no one robs my house
I'm from ohio and Dayton is actually s**t... no offense Dayton peeps
Dayton was listed as the 3rd worst city in the country.... I can't believe there are 2 cities worse than mine
Junkies, junkies everywhere
All of Dayton bad the Westside being the worst there ar junkies every where alot of fentanyl h****n junkies and m**h junkies if you want good dope come to Dayton Ohio drive James H Macgee or Gettysburg ave you can find dope on the east end and Northside to I'm born and raised here if you want to live in a grimy a*s drug fueled crime ridden city but don't want to lived in a over populated place like Cleveland Cincinnati or Columbus come to Dayton will meet all your f****d up dreams we were the overdose capital of the country for few years we have big city crime without big city traffic where nightmares came to die Dayton Ohio oh yeah home of the Wright Brothers Ohio Players And Roger Troutman same place Roger Troutman was murdered and China Arnold stuck her baby in the microwave wave and killed it
The Dope and Dope fiends everyone grimy
I'm from Cincinnati and driving through Dayton is like going thru a small ghost town/war zone. I have family there and they even say it's depressing. Sad part is most people from Dayton go to Columbus, Middletown, Cincinnati or elsewhere to have fun. Funny thing is Rooster's is like a club for local folks, yea I said Rooster's Restaurant.
The terrible a** roads and a lot of empty houses
Rankings & Articles For Dayton


Locations Around Dayton
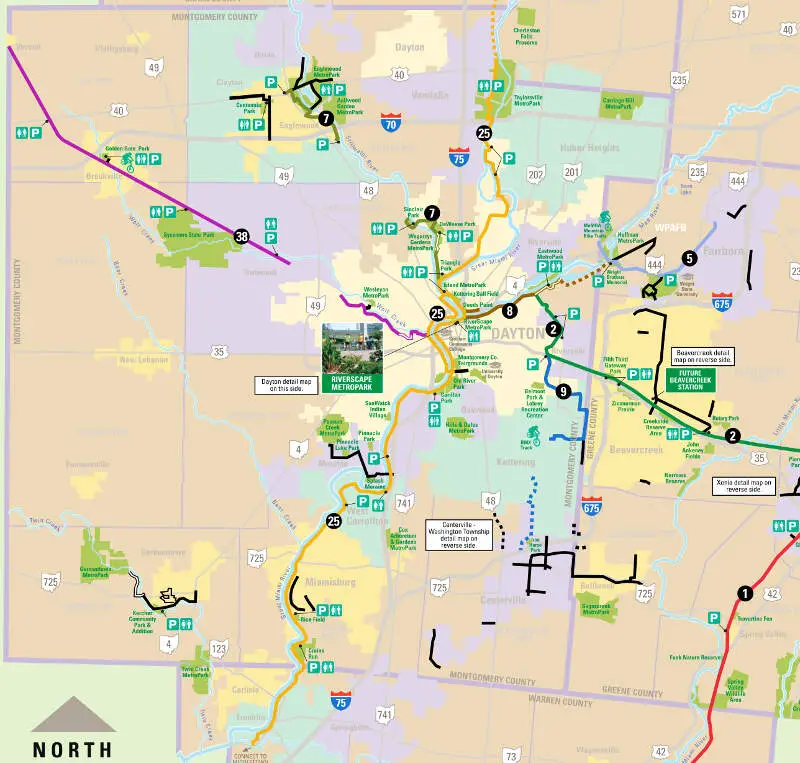
Map Of Dayton, OH
Best Places Around Dayton
Springboro, OH
Population 19,980
Bellbrook, OH
Population 7,394
Beavercreek, OH
Population 47,126
Oakwood, OH
Population 9,458
Kettering, OH
Population 57,206
Germantown, OH
Population 5,825
Centerville, OH
Population 25,205
Centerville, OH
Population 25,205
Clayton, OH
Population 13,277
Vandalia, OH
Population 15,053
Dayton Demographics And Statistics
Population over time in Dayton
The current population in Dayton is 136,579. The population has decreased 6.2% from 2010.
| Year | Population | % Change |
|---|---|---|
| 2024 | 136,579 | -0.1% |
| 2023 | 136,741 | -0.4% |
| 2022 | 137,305 | -0.8% |
| 2021 | 138,416 | -1.4% |
| 2020 | 140,444 | -0.1% |
| 2019 | 140,569 | -0.2% |
| 2018 | 140,782 | -0.1% |
| 2017 | 140,939 | -0.1% |
| 2016 | 141,143 | -0.2% |
| 2015 | 141,368 | -0.3% |
| 2014 | 141,776 | -1.2% |
| 2013 | 143,446 | 0.5% |
| 2012 | 142,670 | -1.0% |
| 2011 | 144,044 | -1.1% |
| 2010 | 145,609 | - |
Race / Ethnicity in Dayton
See the full breakdown
Dayton is:
49.9% White with 68,193 White residents.
37.6% African American with 51,305 African American residents.
0.1% American Indian with 130 American Indian residents.
1.3% Asian with 1,822 Asian residents.
0.0% Hawaiian with 39 Hawaiian residents.
0.5% Other with 714 Other residents.
4.8% Two Or More with 6,617 Two Or More residents.
5.7% Hispanic with 7,759 Hispanic residents.
| Race | Dayton | OH | USA |
|---|---|---|---|
| White | 49.9% | 75.8% | 57.4% |
| African American | 37.6% | 12.0% | 11.9% |
| American Indian | 0.1% | 0.1% | 0.5% |
| Asian | 1.3% | 2.5% | 5.9% |
| Hawaiian | 0.0% | 0.0% | 0.2% |
| Other | 0.5% | 0.4% | 0.6% |
| Two Or More | 4.8% | 4.3% | 4.3% |
| Hispanic | 5.7% | 4.8% | 19.3% |
Gender in Dayton
See the full breakdown
Dayton is 50.5% female with 69,006 female residents.
Dayton is 49.5% male with 67,573 male residents.
| Gender | Dayton | OH | USA |
|---|---|---|---|
| Female | 50.5% | 50.7% | 50.5% |
| Male | 49.5% | 49.3% | 49.5% |
Highest level of educational attainment in Dayton for adults over 25
See the full breakdown
3.0% of adults in Dayton completed < 9th grade.
8.0% of adults in Dayton completed 9-12th grade.
32.0% of adults in Dayton completed high school / ged.
26.0% of adults in Dayton completed some college.
9.0% of adults in Dayton completed associate's degree.
14.0% of adults in Dayton completed bachelor's degree.
6.0% of adults in Dayton completed master's degree.
1.0% of adults in Dayton completed professional degree.
1.0% of adults in Dayton completed doctorate degree.
| Education | Dayton | OH | USA |
|---|---|---|---|
| < 9th Grade | 3.0% | 3.0% | 4.0% |
| 9-12th Grade | 8.0% | 6.0% | 6.0% |
| High School / GED | 32.0% | 32.0% | 26.0% |
| Some College | 26.0% | 19.0% | 19.0% |
| Associate's Degree | 9.0% | 9.0% | 9.0% |
| Bachelor's Degree | 14.0% | 19.0% | 22.0% |
| Master's Degree | 6.0% | 9.0% | 10.0% |
| Professional Degree | 1.0% | 2.0% | 2.0% |
| Doctorate Degree | 1.0% | 1.0% | 2.0% |
Household Income For Dayton, Ohio
See the full breakdown
10.0% of households in Dayton earn Less than $10,000.
8.5% of households in Dayton earn $10,000 to $14,999.
11.5% of households in Dayton earn $15,000 to $24,999.
10.2% of households in Dayton earn $25,000 to $34,999.
14.6% of households in Dayton earn $35,000 to $49,999.
17.7% of households in Dayton earn $50,000 to $74,999.
10.2% of households in Dayton earn $75,000 to $99,999.
9.6% of households in Dayton earn $100,000 to $149,999.
4.2% of households in Dayton earn $150,000 to $199,999.
3.4% of households in Dayton earn $200,000 or more.
| Income | Dayton | OH | USA |
|---|---|---|---|
| Less than $10,000 | 10.0% | 5.2% | 5.0% |
| $10,000 to $14,999 | 8.5% | 4.0% | 3.4% |
| $15,000 to $24,999 | 11.5% | 7.1% | 6.3% |
| $25,000 to $34,999 | 10.2% | 7.5% | 6.6% |
| $35,000 to $49,999 | 14.6% | 11.6% | 10.1% |
| $50,000 to $74,999 | 17.7% | 16.9% | 15.5% |
| $75,000 to $99,999 | 10.2% | 13.1% | 12.6% |
| $100,000 to $149,999 | 9.6% | 17.1% | 17.5% |
| $150,000 to $199,999 | 4.2% | 8.3% | 9.6% |
| $200,000 or more | 3.4% | 9.1% | 13.4% |
Source: U.S. Census ACS 5-year estimates (2024)


