Miamisburg, OH
Demographics And Statistics
Living In Miamisburg, Ohio Summary
Life in Miamisburg research summary. HomeSnacks has been using Saturday Night Science to research the quality of life in Miamisburg over the past nine years using Census, FBI, Zillow, and other primary data sources. Based on the most recently available data, we found the following about life in Miamisburg:
The population in Miamisburg is 19,859.
The median home value in Miamisburg is $255,998.
The median income in Miamisburg is $82,095.
The cost of living in Miamisburg is 97 which is 1.0x lower than the national average.
The median rent in Miamisburg is $1,119.
The unemployment rate in Miamisburg is 6.8%.
The poverty rate in Miamisburg is 9.7%.
The average high in Miamisburg is 62.3° and the average low is 43.0°.
Miamisburg SnackAbility
Overall SnackAbility
Miamisburg, OH Crime Report
Crime in Miamisburg summary. We use data from the FBI to determine the crime rates in Miamisburg. Key points include:
There were 320 total crimes in Miamisburg in the last reporting year.
The overall crime rate per 100,000 people in Miamisburg is 1,617.7 / 100k people.
The violent crime rate per 100,000 people in Miamisburg is 146.6 / 100k people.
The property crime rate per 100,000 people in Miamisburg is 1,471.1 / 100k people.
Overall, crime in Miamisburg is -23.67% below the national average.
Total Crimes
Below National Average
Crime In Miamisburg Comparison Table
| Statistic | Count Raw |
Miamisburg / 100k People |
Ohio / 100k People |
National / 100k People |
|---|---|---|---|---|
| Total Crimes Per 100K | 320 | 1,617.7 | 1,844.9 | 2,119.2 |
| Violent Crime | 29 | 146.6 | 293.7 | 359.0 |
| Murder | 0 | 0.0 | 5.0 | 5.0 |
| Robbery | 7 | 35.4 | 45.5 | 61.0 |
| Aggravated Assault | 19 | 96.1 | 197.4 | 256.0 |
| Property Crime | 291 | 1,471.1 | 1,551.2 | 1,760.0 |
| Burglary | 34 | 171.9 | 206.0 | 229.0 |
| Larceny | 203 | 1,026.2 | 1,132.8 | 1,272.0 |
| Car Theft | 54 | 273.0 | 212.5 | 259.0 |
Miamisburg, OH Cost Of Living
Cost of living in Miamisburg summary. We use data on the cost of living to determine how expensive it is to live in Miamisburg. Real estate prices drive most of the variance in cost of living around Ohio. Key points include:
The cost of living in Miamisburg is 97 with 100 being average.
The cost of living in Miamisburg is 1.0x lower than the national average.
The median home value in Miamisburg is $255,998.
The median income in Miamisburg is $82,095.
Miamisburg's Overall Cost Of Living
Lower Than The National Average
Cost Of Living In Miamisburg Comparison Table
| Living Expense | Miamisburg | Ohio | National Average | |
|---|---|---|---|---|
| Overall | 97 | 93 | 100 | |
| Services | 98 | 101 | 100 | |
| Groceries | 100 | 103 | 100 | |
| Health | 109 | 97 | 100 | |
| Housing | 86 | 74 | 100 | |
| Transportation | 95 | 102 | 100 | |
| Utilities | 104 | 100 | 100 | |
Miamisburg, OH Weather
The average high in Miamisburg is 62.3° and the average low is 43.0°.
There are 76.7 days of precipitation each year.
Expect an average of 40.4 inches of precipitation each year with 15.6 inches of snow.
| Stat | Miamisburg |
|---|---|
| Average Annual High | 62.3 |
| Average Annual Low | 43.0 |
| Annual Precipitation Days | 76.7 |
| Average Annual Precipitation | 40.4 |
| Average Annual Snowfall | 15.6 |
Average High
Days of Rain
Miamisburg, OH Photos


Rankings for Miamisburg in Ohio


Locations Around Miamisburg
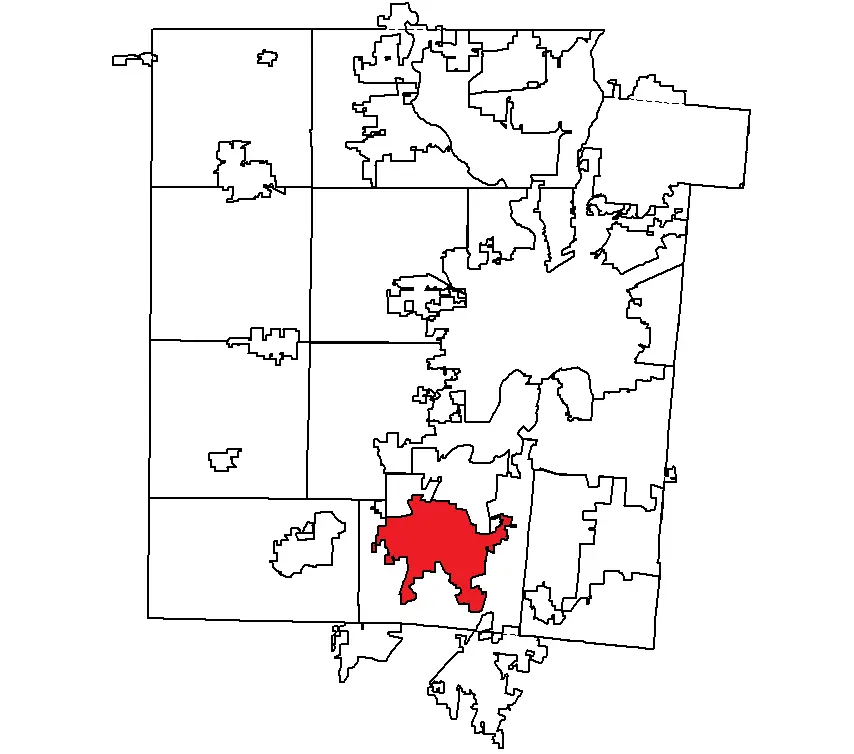
Map Of Miamisburg, OH
Best Places Around Miamisburg
Mason, OH
Population 35,148
Springboro, OH
Population 19,577
Bellbrook, OH
Population 7,344
Beavercreek, OH
Population 46,787
Oakwood, OH
Population 9,480
Kettering, OH
Population 57,442
Germantown, OH
Population 5,796
Centerville, OH
Population 24,815
Centerville, OH
Population 24,815
Lebanon, OH
Population 21,216
Miamisburg Demographics And Statistics
Population over time in Miamisburg
The current population in Miamisburg is 19,859. The population has decreased -0.6% from 2010.
| Year | Population | % Change |
|---|---|---|
| 2023 | 19,859 | -0.1% |
| 2022 | 19,877 | -0.0% |
| 2021 | 19,878 | -0.7% |
| 2020 | 20,020 | 0.1% |
| 2019 | 19,993 | 0.1% |
| 2018 | 19,974 | -0.3% |
| 2017 | 20,042 | -0.1% |
| 2016 | 20,069 | -0.2% |
| 2015 | 20,119 | -0.2% |
| 2014 | 20,168 | 0.1% |
| 2013 | 20,148 | 0.2% |
| 2012 | 20,108 | 0.2% |
| 2011 | 20,073 | 0.4% |
| 2010 | 19,986 | - |
Race / Ethnicity in Miamisburg
Miamisburg is:
90.8% White with 18,036 White residents.
3.2% African American with 632 African American residents.
0.3% American Indian with 55 American Indian residents.
1.7% Asian with 338 Asian residents.
0.0% Hawaiian with 0 Hawaiian residents.
0.2% Other with 34 Other residents.
2.4% Two Or More with 475 Two Or More residents.
1.5% Hispanic with 289 Hispanic residents.
| Race | Miamisburg | OH | USA |
|---|---|---|---|
| White | 90.8% | 76.5% | 58.2% |
| African American | 3.2% | 12.1% | 12.0% |
| American Indian | 0.3% | 0.1% | 0.5% |
| Asian | 1.7% | 2.4% | 5.7% |
| Hawaiian | 0.0% | 0.0% | 0.2% |
| Other | 0.2% | 0.4% | 0.5% |
| Two Or More | 2.4% | 3.9% | 3.9% |
| Hispanic | 1.5% | 4.6% | 19.0% |
Gender in Miamisburg
Miamisburg is 50.0% female with 9,938 female residents.
Miamisburg is 50.0% male with 9,921 male residents.
| Gender | Miamisburg | OH | USA |
|---|---|---|---|
| Female | 50.0% | 50.7% | 50.5% |
| Male | 50.0% | 49.3% | 49.5% |
Highest level of educational attainment in Miamisburg for adults over 25
3.0% of adults in Miamisburg completed < 9th grade.
4.0% of adults in Miamisburg completed 9-12th grade.
29.0% of adults in Miamisburg completed high school / ged.
21.0% of adults in Miamisburg completed some college.
14.0% of adults in Miamisburg completed associate's degree.
18.0% of adults in Miamisburg completed bachelor's degree.
9.0% of adults in Miamisburg completed master's degree.
0.0% of adults in Miamisburg completed professional degree.
2.0% of adults in Miamisburg completed doctorate degree.
| Education | Miamisburg | OH | USA |
|---|---|---|---|
| < 9th Grade | 3.0% | 3.0% | 5.0% |
| 9-12th Grade | 4.0% | 6.0% | 6.0% |
| High School / GED | 29.0% | 32.0% | 26.0% |
| Some College | 21.0% | 19.0% | 19.0% |
| Associate's Degree | 14.0% | 9.0% | 9.0% |
| Bachelor's Degree | 18.0% | 19.0% | 21.0% |
| Master's Degree | 9.0% | 9.0% | 10.0% |
| Professional Degree | 0.0% | 2.0% | 2.0% |
| Doctorate Degree | 2.0% | 1.0% | 2.0% |
Household Income For Miamisburg, Ohio
2.2% of households in Miamisburg earn Less than $10,000.
3.1% of households in Miamisburg earn $10,000 to $14,999.
4.0% of households in Miamisburg earn $15,000 to $24,999.
5.2% of households in Miamisburg earn $25,000 to $34,999.
11.9% of households in Miamisburg earn $35,000 to $49,999.
18.2% of households in Miamisburg earn $50,000 to $74,999.
14.3% of households in Miamisburg earn $75,000 to $99,999.
22.8% of households in Miamisburg earn $100,000 to $149,999.
8.2% of households in Miamisburg earn $150,000 to $199,999.
10.2% of households in Miamisburg earn $200,000 or more.
| Income | Miamisburg | OH | USA |
|---|---|---|---|
| Less than $10,000 | 2.2% | 5.2% | 4.9% |
| $10,000 to $14,999 | 3.1% | 4.1% | 3.6% |
| $15,000 to $24,999 | 4.0% | 7.4% | 6.6% |
| $25,000 to $34,999 | 5.2% | 7.7% | 6.8% |
| $35,000 to $49,999 | 11.9% | 11.9% | 10.4% |
| $50,000 to $74,999 | 18.2% | 17.1% | 15.7% |
| $75,000 to $99,999 | 14.3% | 13.2% | 12.7% |
| $100,000 to $149,999 | 22.8% | 16.9% | 17.4% |
| $150,000 to $199,999 | 8.2% | 8.0% | 9.3% |
| $200,000 or more | 10.2% | 8.5% | 12.6% |


