Oakwood, OH
Demographics And Statistics
Living In Oakwood, Ohio Summary
Life in Oakwood research summary. HomeSnacks has been using Saturday Night Science to research the quality of life in Oakwood over the past nine years using Census, FBI, Zillow, and other primary data sources. Based on the most recently available data, we found the following about life in Oakwood:
The population in Oakwood is 9,480.
The median home value in Oakwood is $392,814.
The median income in Oakwood is $158,968.
The median rent in Oakwood is $1,320.
The unemployment rate in Oakwood is 2.5%.
The poverty rate in Oakwood is 3.2%.
The average high in Oakwood is 62.1° and the average low is 43.1°.
Table Of Contents
Oakwood SnackAbility
Overall SnackAbility
Oakwood, OH Weather
The average high in Oakwood is 62.1° and the average low is 43.1°.
There are 76.7 days of precipitation each year.
Expect an average of 40.6 inches of precipitation each year with 15.1 inches of snow.
| Stat | Oakwood |
|---|---|
| Average Annual High | 62.1 |
| Average Annual Low | 43.1 |
| Annual Precipitation Days | 76.7 |
| Average Annual Precipitation | 40.6 |
| Average Annual Snowfall | 15.1 |
Average High
Days of Rain
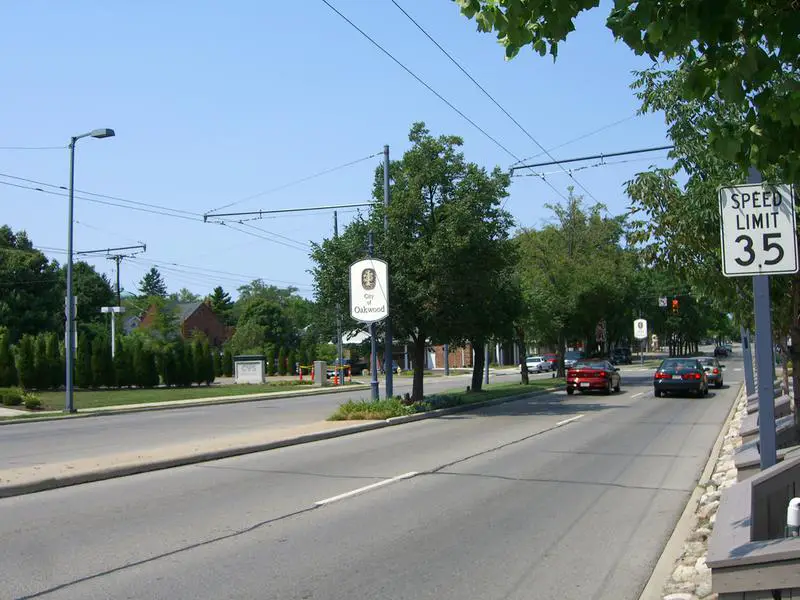
Oakwood, OH Photos
Rankings for Oakwood in Ohio


Locations Around Oakwood
Map Of Oakwood, OH
Best Places Around Oakwood
Hudson, OH
Population 23,007
Shaker Heights, OH
Population 29,004
Highland Heights, OH
Population 8,619
Macedonia, OH
Population 12,142
Pepper Pike, OH
Population 6,807
Solon, OH
Population 23,970
Broadview Heights, OH
Population 19,768
Munroe Falls, OH
Population 5,019
Strongsville, OH
Population 46,022
Rocky River, OH
Population 21,490
Oakwood Demographics And Statistics
Population over time in Oakwood
The current population in Oakwood is 9,480. The population has increased 3.2% from 2010.
| Year | Population | % Change |
|---|---|---|
| 2023 | 9,480 | -0.2% |
| 2022 | 9,496 | 0.3% |
| 2021 | 9,470 | 5.7% |
| 2020 | 8,958 | -0.3% |
| 2019 | 8,982 | -0.5% |
| 2018 | 9,030 | -0.1% |
| 2017 | 9,035 | -0.5% |
| 2016 | 9,077 | -0.4% |
| 2015 | 9,118 | -0.3% |
| 2014 | 9,150 | -0.2% |
| 2013 | 9,165 | -0.2% |
| 2012 | 9,186 | -0.1% |
| 2011 | 9,195 | 0.1% |
| 2010 | 9,188 | - |
Race / Ethnicity in Oakwood
Oakwood is:
90.8% White with 8,604 White residents.
0.5% African American with 50 African American residents.
0.0% American Indian with 0 American Indian residents.
2.8% Asian with 266 Asian residents.
0.0% Hawaiian with 0 Hawaiian residents.
0.6% Other with 56 Other residents.
4.2% Two Or More with 400 Two Or More residents.
1.1% Hispanic with 104 Hispanic residents.
| Race | Oakwood | OH | USA |
|---|---|---|---|
| White | 90.8% | 76.5% | 58.2% |
| African American | 0.5% | 12.1% | 12.0% |
| American Indian | 0.0% | 0.1% | 0.5% |
| Asian | 2.8% | 2.4% | 5.7% |
| Hawaiian | 0.0% | 0.0% | 0.2% |
| Other | 0.6% | 0.4% | 0.5% |
| Two Or More | 4.2% | 3.9% | 3.9% |
| Hispanic | 1.1% | 4.6% | 19.0% |
Gender in Oakwood
Oakwood is 52.6% female with 4,988 female residents.
Oakwood is 47.4% male with 4,492 male residents.
| Gender | Oakwood | OH | USA |
|---|---|---|---|
| Female | 52.6% | 50.7% | 50.5% |
| Male | 47.4% | 49.3% | 49.5% |
Highest level of educational attainment in Oakwood for adults over 25
-1.0% of adults in Oakwood completed < 9th grade.
1.0% of adults in Oakwood completed 9-12th grade.
6.0% of adults in Oakwood completed high school / ged.
11.0% of adults in Oakwood completed some college.
7.0% of adults in Oakwood completed associate's degree.
32.0% of adults in Oakwood completed bachelor's degree.
31.0% of adults in Oakwood completed master's degree.
8.0% of adults in Oakwood completed professional degree.
5.0% of adults in Oakwood completed doctorate degree.
| Education | Oakwood | OH | USA |
|---|---|---|---|
| < 9th Grade | -1.0% | 3.0% | 5.0% |
| 9-12th Grade | 1.0% | 6.0% | 6.0% |
| High School / GED | 6.0% | 32.0% | 26.0% |
| Some College | 11.0% | 19.0% | 19.0% |
| Associate's Degree | 7.0% | 9.0% | 9.0% |
| Bachelor's Degree | 32.0% | 19.0% | 21.0% |
| Master's Degree | 31.0% | 9.0% | 10.0% |
| Professional Degree | 8.0% | 2.0% | 2.0% |
| Doctorate Degree | 5.0% | 1.0% | 2.0% |
Household Income For Oakwood, Ohio
1.4% of households in Oakwood earn Less than $10,000.
0.7% of households in Oakwood earn $10,000 to $14,999.
3.5% of households in Oakwood earn $15,000 to $24,999.
1.9% of households in Oakwood earn $25,000 to $34,999.
6.5% of households in Oakwood earn $35,000 to $49,999.
8.0% of households in Oakwood earn $50,000 to $74,999.
9.4% of households in Oakwood earn $75,000 to $99,999.
16.1% of households in Oakwood earn $100,000 to $149,999.
14.6% of households in Oakwood earn $150,000 to $199,999.
37.9% of households in Oakwood earn $200,000 or more.
| Income | Oakwood | OH | USA |
|---|---|---|---|
| Less than $10,000 | 1.4% | 5.2% | 4.9% |
| $10,000 to $14,999 | 0.7% | 4.1% | 3.6% |
| $15,000 to $24,999 | 3.5% | 7.4% | 6.6% |
| $25,000 to $34,999 | 1.9% | 7.7% | 6.8% |
| $35,000 to $49,999 | 6.5% | 11.9% | 10.4% |
| $50,000 to $74,999 | 8.0% | 17.1% | 15.7% |
| $75,000 to $99,999 | 9.4% | 13.2% | 12.7% |
| $100,000 to $149,999 | 16.1% | 16.9% | 17.4% |
| $150,000 to $199,999 | 14.6% | 8.0% | 9.3% |
| $200,000 or more | 37.9% | 8.5% | 12.6% |


