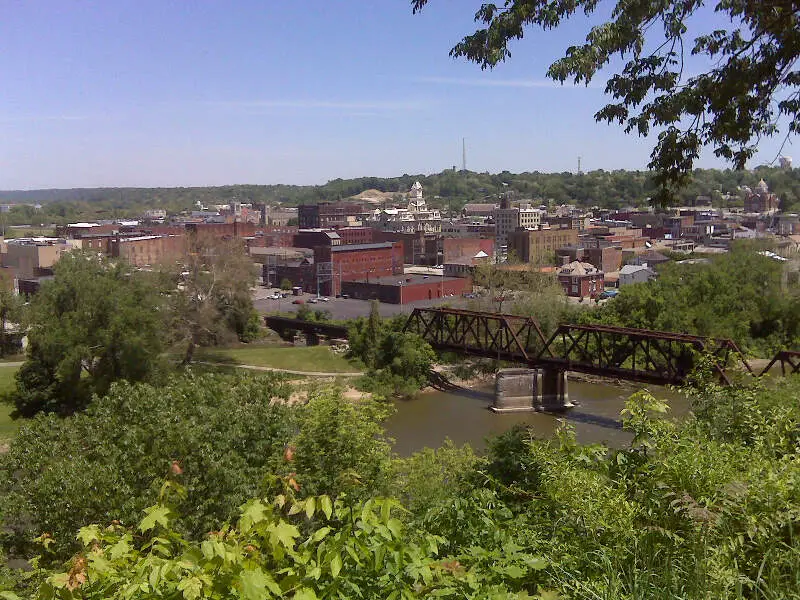
Zanesville, OH
Demographics And Statistics
Living In Zanesville, Ohio Summary
Life in Zanesville research summary. HomeSnacks has been using Saturday Night Science to research the quality of life in Zanesville over the past nine years using Census, FBI, Zillow, and other primary data sources. Based on the most recently available data, we found the following about life in Zanesville:
The population in Zanesville is 24,726.
The median home value in Zanesville is $199,120.
The median income in Zanesville is $39,085.
The cost of living in Zanesville is 83 which is 0.8x lower than the national average.
The median rent in Zanesville is $812.
The unemployment rate in Zanesville is 8.7%.
The poverty rate in Zanesville is 26.8%.
The average high in Zanesville is 62.6° and the average low is 40.7°.
Zanesville SnackAbility
Overall SnackAbility
Zanesville, OH Crime Report
Crime in Zanesville summary. We use data from the FBI to determine the crime rates in Zanesville. Key points include:
There were 781 total crimes in Zanesville in the last reporting year.
The overall crime rate per 100,000 people in Zanesville is 3,173.5 / 100k people.
The violent crime rate per 100,000 people in Zanesville is 333.2 / 100k people.
The property crime rate per 100,000 people in Zanesville is 2,840.3 / 100k people.
Overall, crime in Zanesville is 49.75% above the national average.
Total Crimes
Above National Average
Crime In Zanesville Comparison Table
| Statistic | Count Raw |
Zanesville / 100k People |
Ohio / 100k People |
National / 100k People |
|---|---|---|---|---|
| Total Crimes Per 100K | 781 | 3,173.5 | 1,844.9 | 2,119.2 |
| Violent Crime | 82 | 333.2 | 293.7 | 359.0 |
| Murder | 0 | 0.0 | 5.0 | 5.0 |
| Robbery | 5 | 20.3 | 45.5 | 61.0 |
| Aggravated Assault | 57 | 231.6 | 197.4 | 256.0 |
| Property Crime | 699 | 2,840.3 | 1,551.2 | 1,760.0 |
| Burglary | 135 | 548.6 | 206.0 | 229.0 |
| Larceny | 526 | 2,137.3 | 1,132.8 | 1,272.0 |
| Car Theft | 38 | 154.4 | 212.5 | 259.0 |
Zanesville, OH Cost Of Living
Cost of living in Zanesville summary. We use data on the cost of living to determine how expensive it is to live in Zanesville. Real estate prices drive most of the variance in cost of living around Ohio. Key points include:
The cost of living in Zanesville is 83 with 100 being average.
The cost of living in Zanesville is 0.8x lower than the national average.
The median home value in Zanesville is $199,120.
The median income in Zanesville is $39,085.
Zanesville's Overall Cost Of Living
Lower Than The National Average
Cost Of Living In Zanesville Comparison Table
| Living Expense | Zanesville | Ohio | National Average | |
|---|---|---|---|---|
| Overall | 83 | 93 | 100 | |
| Services | 94 | 101 | 100 | |
| Groceries | 105 | 103 | 100 | |
| Health | 83 | 97 | 100 | |
| Housing | 53 | 74 | 100 | |
| Transportation | 91 | 102 | 100 | |
| Utilities | 96 | 100 | 100 | |
Zanesville, OH Weather
The average high in Zanesville is 62.6° and the average low is 40.7°.
There are 79.3 days of precipitation each year.
Expect an average of 39.7 inches of precipitation each year with 19.8 inches of snow.
| Stat | Zanesville |
|---|---|
| Average Annual High | 62.6 |
| Average Annual Low | 40.7 |
| Annual Precipitation Days | 79.3 |
| Average Annual Precipitation | 39.7 |
| Average Annual Snowfall | 19.8 |
Average High
Days of Rain
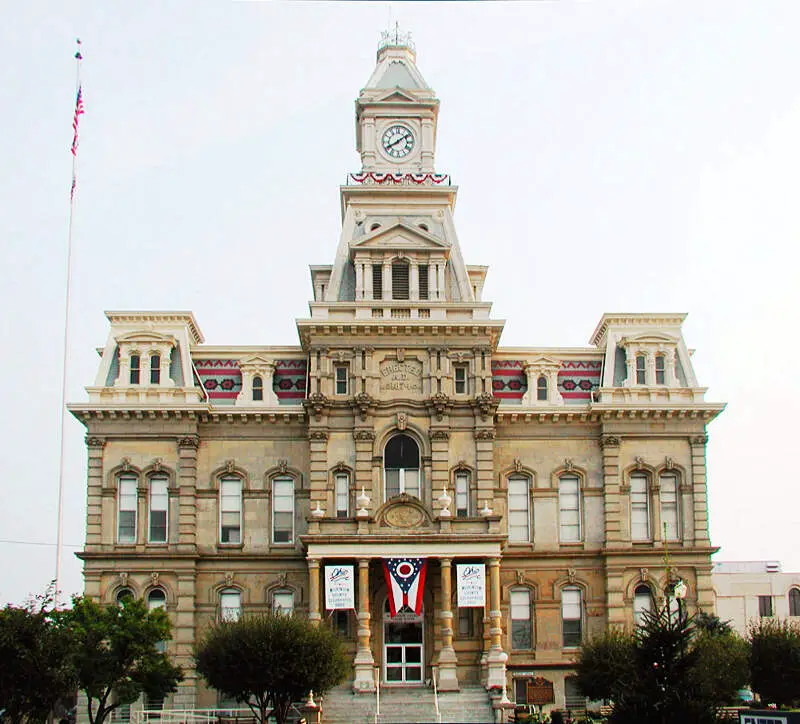
Zanesville, OH Photos


4 Reviews & Comments About Zanesville
/5

Nicholas Nestor - None
Its funny because it's true. I live in Zanesville. Tom's ice cream bowl is actually really good though and we also have a steak & shake.
Lane Bell - None
I'm from Zanesville. While everything he mentioned is true, we do in fact have a steak n shake. It's arguably the best in the world behind Las Vegas Nevada.
Pete389man - None
I live in zanesville and it's great. Your just some city slicker
Kaid Brown - None
I live in zanesville and it's a pretty nice biggish city
Rankings for Zanesville in Ohio


Locations Around Zanesville
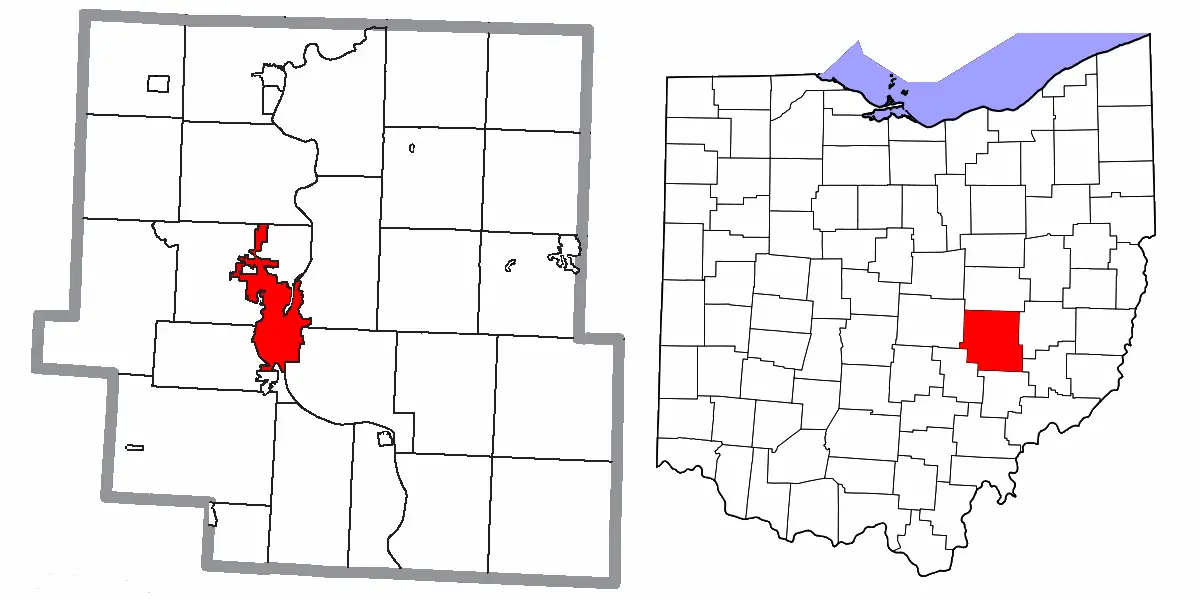
Map Of Zanesville, OH
Best Places Around Zanesville
Bexley, OH
Population 13,324
Gahanna, OH
Population 35,438
New Albany, OH
Population 10,524
Westerville, OH
Population 38,543
Canal Winchester, OH
Population 9,659
Pickerington, OH
Population 23,828
Granville, OH
Population 5,916
Apple Valley, OH
Population 5,125
Reynoldsburg, OH
Population 41,032
New Philadelphia, OH
Population 17,563
Zanesville Demographics And Statistics
Population over time in Zanesville
The current population in Zanesville is 24,726. The population has decreased -3.3% from 2010.
| Year | Population | % Change |
|---|---|---|
| 2023 | 24,726 | -0.2% |
| 2022 | 24,772 | -0.1% |
| 2021 | 24,809 | -1.7% |
| 2020 | 25,246 | 0.2% |
| 2019 | 25,200 | -0.7% |
| 2018 | 25,376 | -0.0% |
| 2017 | 25,378 | -0.3% |
| 2016 | 25,467 | -0.0% |
| 2015 | 25,470 | 0.1% |
| 2014 | 25,444 | -0.1% |
| 2013 | 25,481 | 0.0% |
| 2012 | 25,475 | -0.2% |
| 2011 | 25,538 | -0.1% |
| 2010 | 25,567 | - |
Race / Ethnicity in Zanesville
Zanesville is:
80.6% White with 19,939 White residents.
8.6% African American with 2,120 African American residents.
0.1% American Indian with 23 American Indian residents.
1.0% Asian with 251 Asian residents.
0.0% Hawaiian with 10 Hawaiian residents.
0.3% Other with 78 Other residents.
6.7% Two Or More with 1,662 Two Or More residents.
2.6% Hispanic with 643 Hispanic residents.
| Race | Zanesville | OH | USA |
|---|---|---|---|
| White | 80.6% | 76.5% | 58.2% |
| African American | 8.6% | 12.1% | 12.0% |
| American Indian | 0.1% | 0.1% | 0.5% |
| Asian | 1.0% | 2.4% | 5.7% |
| Hawaiian | 0.0% | 0.0% | 0.2% |
| Other | 0.3% | 0.4% | 0.5% |
| Two Or More | 6.7% | 3.9% | 3.9% |
| Hispanic | 2.6% | 4.6% | 19.0% |
Gender in Zanesville
Zanesville is 53.2% female with 13,156 female residents.
Zanesville is 46.8% male with 11,570 male residents.
| Gender | Zanesville | OH | USA |
|---|---|---|---|
| Female | 53.2% | 50.7% | 50.5% |
| Male | 46.8% | 49.3% | 49.5% |
Highest level of educational attainment in Zanesville for adults over 25
4.0% of adults in Zanesville completed < 9th grade.
11.0% of adults in Zanesville completed 9-12th grade.
42.0% of adults in Zanesville completed high school / ged.
20.0% of adults in Zanesville completed some college.
9.0% of adults in Zanesville completed associate's degree.
9.0% of adults in Zanesville completed bachelor's degree.
4.0% of adults in Zanesville completed master's degree.
1.0% of adults in Zanesville completed professional degree.
0.0% of adults in Zanesville completed doctorate degree.
| Education | Zanesville | OH | USA |
|---|---|---|---|
| < 9th Grade | 4.0% | 3.0% | 5.0% |
| 9-12th Grade | 11.0% | 6.0% | 6.0% |
| High School / GED | 42.0% | 32.0% | 26.0% |
| Some College | 20.0% | 19.0% | 19.0% |
| Associate's Degree | 9.0% | 9.0% | 9.0% |
| Bachelor's Degree | 9.0% | 19.0% | 21.0% |
| Master's Degree | 4.0% | 9.0% | 10.0% |
| Professional Degree | 1.0% | 2.0% | 2.0% |
| Doctorate Degree | 0.0% | 1.0% | 2.0% |
Household Income For Zanesville, Ohio
7.8% of households in Zanesville earn Less than $10,000.
7.9% of households in Zanesville earn $10,000 to $14,999.
15.3% of households in Zanesville earn $15,000 to $24,999.
13.2% of households in Zanesville earn $25,000 to $34,999.
16.0% of households in Zanesville earn $35,000 to $49,999.
17.2% of households in Zanesville earn $50,000 to $74,999.
10.2% of households in Zanesville earn $75,000 to $99,999.
7.7% of households in Zanesville earn $100,000 to $149,999.
1.7% of households in Zanesville earn $150,000 to $199,999.
3.1% of households in Zanesville earn $200,000 or more.
| Income | Zanesville | OH | USA |
|---|---|---|---|
| Less than $10,000 | 7.8% | 5.2% | 4.9% |
| $10,000 to $14,999 | 7.9% | 4.1% | 3.6% |
| $15,000 to $24,999 | 15.3% | 7.4% | 6.6% |
| $25,000 to $34,999 | 13.2% | 7.7% | 6.8% |
| $35,000 to $49,999 | 16.0% | 11.9% | 10.4% |
| $50,000 to $74,999 | 17.2% | 17.1% | 15.7% |
| $75,000 to $99,999 | 10.2% | 13.2% | 12.7% |
| $100,000 to $149,999 | 7.7% | 16.9% | 17.4% |
| $150,000 to $199,999 | 1.7% | 8.0% | 9.3% |
| $200,000 or more | 3.1% | 8.5% | 12.6% |


