Philomath, OR
Demographics And Statistics
Living In Philomath, Oregon Summary
Life in Philomath research summary. HomeSnacks has been using Saturday Night Science to research the quality of life in Philomath over the past nine years using Census, FBI, Zillow, and other primary data sources. Based on the most recently available data, we found the following about life in Philomath:
The population in Philomath is 5,537.
The median home value in Philomath is $519,586.
The median income in Philomath is $83,373.
The cost of living in Philomath is 113 which is 1.1x higher than the national average.
The median rent in Philomath is $1,415.
The unemployment rate in Philomath is 3.1%.
The poverty rate in Philomath is 7.9%.
The average high in Philomath is 62.6° and the average low is 42.1°.
Philomath SnackAbility
Overall SnackAbility
Philomath, OR Crime Report
Crime in Philomath summary. We use data from the FBI to determine the crime rates in Philomath. Key points include:
There were 52 total crimes in Philomath in the last reporting year.
The overall crime rate per 100,000 people in Philomath is 889.5 / 100k people.
The violent crime rate per 100,000 people in Philomath is 85.5 / 100k people.
The property crime rate per 100,000 people in Philomath is 804.0 / 100k people.
Overall, crime in Philomath is -58.03% below the national average.
Total Crimes
Below National Average
Crime In Philomath Comparison Table
| Statistic | Count Raw |
Philomath / 100k People |
Oregon / 100k People |
National / 100k People |
|---|---|---|---|---|
| Total Crimes Per 100K | 52 | 889.5 | 2,719.1 | 2,119.2 |
| Violent Crime | 5 | 85.5 | 331.0 | 359.0 |
| Murder | 0 | 0.0 | 3.7 | 5.0 |
| Robbery | 1 | 17.1 | 57.0 | 61.0 |
| Aggravated Assault | 2 | 34.2 | 229.1 | 256.0 |
| Property Crime | 47 | 804.0 | 2,388.0 | 1,760.0 |
| Burglary | 3 | 51.3 | 306.5 | 229.0 |
| Larceny | 42 | 718.4 | 1,789.5 | 1,272.0 |
| Car Theft | 2 | 34.2 | 292.1 | 259.0 |
Philomath, OR Cost Of Living
Cost of living in Philomath summary. We use data on the cost of living to determine how expensive it is to live in Philomath. Real estate prices drive most of the variance in cost of living around Oregon. Key points include:
The cost of living in Philomath is 113 with 100 being average.
The cost of living in Philomath is 1.1x higher than the national average.
The median home value in Philomath is $519,586.
The median income in Philomath is $83,373.
Philomath's Overall Cost Of Living
Higher Than The National Average
Cost Of Living In Philomath Comparison Table
| Living Expense | Philomath | Oregon | National Average | |
|---|---|---|---|---|
| Overall | 113 | 112 | 100 | |
| Services | 104 | 107 | 100 | |
| Groceries | 105 | 107 | 100 | |
| Health | 100 | 104 | 100 | |
| Housing | 135 | 124 | 100 | |
| Transportation | 105 | 116 | 100 | |
| Utilities | 97 | 97 | 100 | |
Philomath, OR Weather
The average high in Philomath is 62.6° and the average low is 42.1°.
There are 85.7 days of precipitation each year.
Expect an average of 48.0 inches of precipitation each year with 6.9 inches of snow.
| Stat | Philomath |
|---|---|
| Average Annual High | 62.6 |
| Average Annual Low | 42.1 |
| Annual Precipitation Days | 85.7 |
| Average Annual Precipitation | 48.0 |
| Average Annual Snowfall | 6.9 |
Average High
Days of Rain
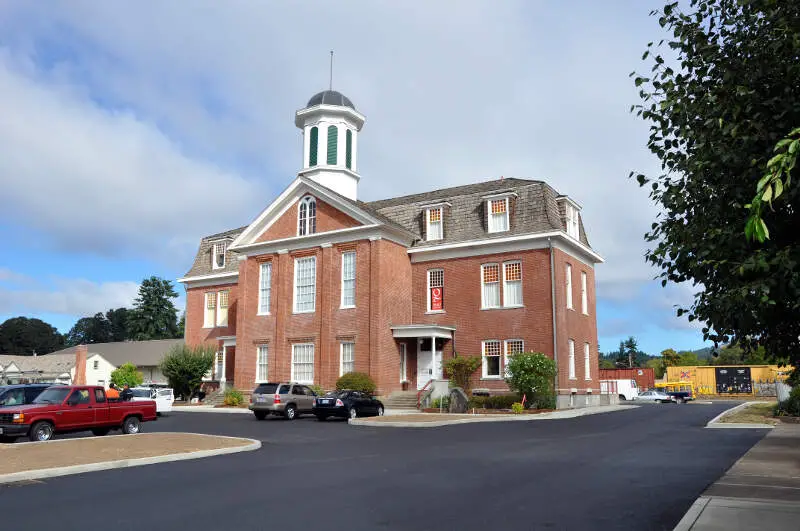
Philomath, OR Photos
1 Reviews & Comments About Philomath
/5

HomeSnacks User - 2018-07-15 16:19:58.383318
I lived in Philomath for many years and raised my daughter there. Philomath is a small town about 5 miles west of Corvallis and on a major through fare to the Oregon Coast. For years Philomath was mainly a wood products industry town with sawmills on each end and in the middle, very middle class. There is little violent crime, however, there are pockets of drug related crime and prostitution and as they get busted the move to another part of town. The schools in Philomath are ok, but some of the teaching staff is very incompetent and disrespectful to the students. A local timber baron built the high school/community indoor summing pool and his foundation provides scholarships to eligible high school graduates of Philomath. As years progressed and the timber industry declined, Philomath struggled for economic viability and many businesses permanently closed, then new technology businesses started moving into the area which has improved the overall quality of the town. Overall if you like small towns close to outdoor recreational activities Philomath is a good choice and I would recommend it.
Things that stood out was the comeback of the towns economic assets with technology moving in to replace part of the timber industry lost. The bad, is the busted drug and prostitution groups moving from one location to another and co-mingling within neighborhoods.
Rankings for Philomath in Oregon


Locations Around Philomath
Map Of Philomath, OR
Best Places Around Philomath
Keizer, OR
Population 39,013
Corvallis, OR
Population 60,424
Salem, OR
Population 176,666
Eugene, OR
Population 177,520
Dallas, OR
Population 17,214
Silverton, OR
Population 10,445
Four Corners, OR
Population 16,168
Springfield, OR
Population 61,642
Stayton, OR
Population 8,223
Albany, OR
Population 56,773
Philomath Demographics And Statistics
Population over time in Philomath
The current population in Philomath is 5,537. The population has increased 22.6% from 2010.
| Year | Population | % Change |
|---|---|---|
| 2023 | 5,537 | 2.0% |
| 2022 | 5,429 | 1.4% |
| 2021 | 5,353 | 4.1% |
| 2020 | 5,143 | 4.3% |
| 2019 | 4,929 | 4.8% |
| 2018 | 4,702 | 1.7% |
| 2017 | 4,624 | 0.9% |
| 2016 | 4,584 | -0.3% |
| 2015 | 4,597 | 0.4% |
| 2014 | 4,577 | -0.1% |
| 2013 | 4,581 | 0.4% |
| 2012 | 4,564 | 0.3% |
| 2011 | 4,549 | 0.7% |
| 2010 | 4,518 | - |
Race / Ethnicity in Philomath
Philomath is:
87.1% White with 4,822 White residents.
0.0% African American with 0 African American residents.
1.3% American Indian with 71 American Indian residents.
2.0% Asian with 108 Asian residents.
0.4% Hawaiian with 24 Hawaiian residents.
0.8% Other with 45 Other residents.
5.0% Two Or More with 278 Two Or More residents.
3.4% Hispanic with 189 Hispanic residents.
| Race | Philomath | OR | USA |
|---|---|---|---|
| White | 87.1% | 72.3% | 58.2% |
| African American | 0.0% | 1.8% | 12.0% |
| American Indian | 1.3% | 0.7% | 0.5% |
| Asian | 2.0% | 4.4% | 5.7% |
| Hawaiian | 0.4% | 0.4% | 0.2% |
| Other | 0.8% | 0.5% | 0.5% |
| Two Or More | 5.0% | 5.6% | 3.9% |
| Hispanic | 3.4% | 14.3% | 19.0% |
Gender in Philomath
Philomath is 51.7% female with 2,862 female residents.
Philomath is 48.3% male with 2,674 male residents.
| Gender | Philomath | OR | USA |
|---|---|---|---|
| Female | 51.7% | 50.1% | 50.5% |
| Male | 48.3% | 49.9% | 49.5% |
Highest level of educational attainment in Philomath for adults over 25
-1.0% of adults in Philomath completed < 9th grade.
4.0% of adults in Philomath completed 9-12th grade.
19.0% of adults in Philomath completed high school / ged.
16.0% of adults in Philomath completed some college.
14.0% of adults in Philomath completed associate's degree.
27.0% of adults in Philomath completed bachelor's degree.
16.0% of adults in Philomath completed master's degree.
3.0% of adults in Philomath completed professional degree.
2.0% of adults in Philomath completed doctorate degree.
| Education | Philomath | OR | USA |
|---|---|---|---|
| < 9th Grade | -1.0% | 4.0% | 5.0% |
| 9-12th Grade | 4.0% | 5.0% | 6.0% |
| High School / GED | 19.0% | 22.0% | 26.0% |
| Some College | 16.0% | 24.0% | 19.0% |
| Associate's Degree | 14.0% | 9.0% | 9.0% |
| Bachelor's Degree | 27.0% | 22.0% | 21.0% |
| Master's Degree | 16.0% | 10.0% | 10.0% |
| Professional Degree | 3.0% | 2.0% | 2.0% |
| Doctorate Degree | 2.0% | 2.0% | 2.0% |
Household Income For Philomath, Oregon
6.5% of households in Philomath earn Less than $10,000.
2.0% of households in Philomath earn $10,000 to $14,999.
1.2% of households in Philomath earn $15,000 to $24,999.
8.5% of households in Philomath earn $25,000 to $34,999.
10.5% of households in Philomath earn $35,000 to $49,999.
16.5% of households in Philomath earn $50,000 to $74,999.
17.0% of households in Philomath earn $75,000 to $99,999.
20.3% of households in Philomath earn $100,000 to $149,999.
7.8% of households in Philomath earn $150,000 to $199,999.
9.6% of households in Philomath earn $200,000 or more.
| Income | Philomath | OR | USA |
|---|---|---|---|
| Less than $10,000 | 6.5% | 4.4% | 4.9% |
| $10,000 to $14,999 | 2.0% | 3.4% | 3.6% |
| $15,000 to $24,999 | 1.2% | 6.3% | 6.6% |
| $25,000 to $34,999 | 8.5% | 6.4% | 6.8% |
| $35,000 to $49,999 | 10.5% | 10.5% | 10.4% |
| $50,000 to $74,999 | 16.5% | 15.9% | 15.7% |
| $75,000 to $99,999 | 17.0% | 13.3% | 12.7% |
| $100,000 to $149,999 | 20.3% | 18.5% | 17.4% |
| $150,000 to $199,999 | 7.8% | 9.6% | 9.3% |
| $200,000 or more | 9.6% | 11.8% | 12.6% |


