
South Carolina is the best state for those looking for good old-fashioned fun. The energy the residents of South Carolina exude attracts many people in search of a little piece of southern charm amidst a quaint backdrop.
What does the perfect place to live in South Carolina look like?
We used Saturday Night Science to answer that question. We compared FBI, Zillow, and Census data on factors like crime, home prices, and incomes. The best places in South Carolina have strong economies, excellent schools, and plenty of things to do.
Grab some of great granny’s sweet tea and a basket of hush puppies and read on.
Table Of Contents: Top Ten | Table | Map | Methodology | Summary
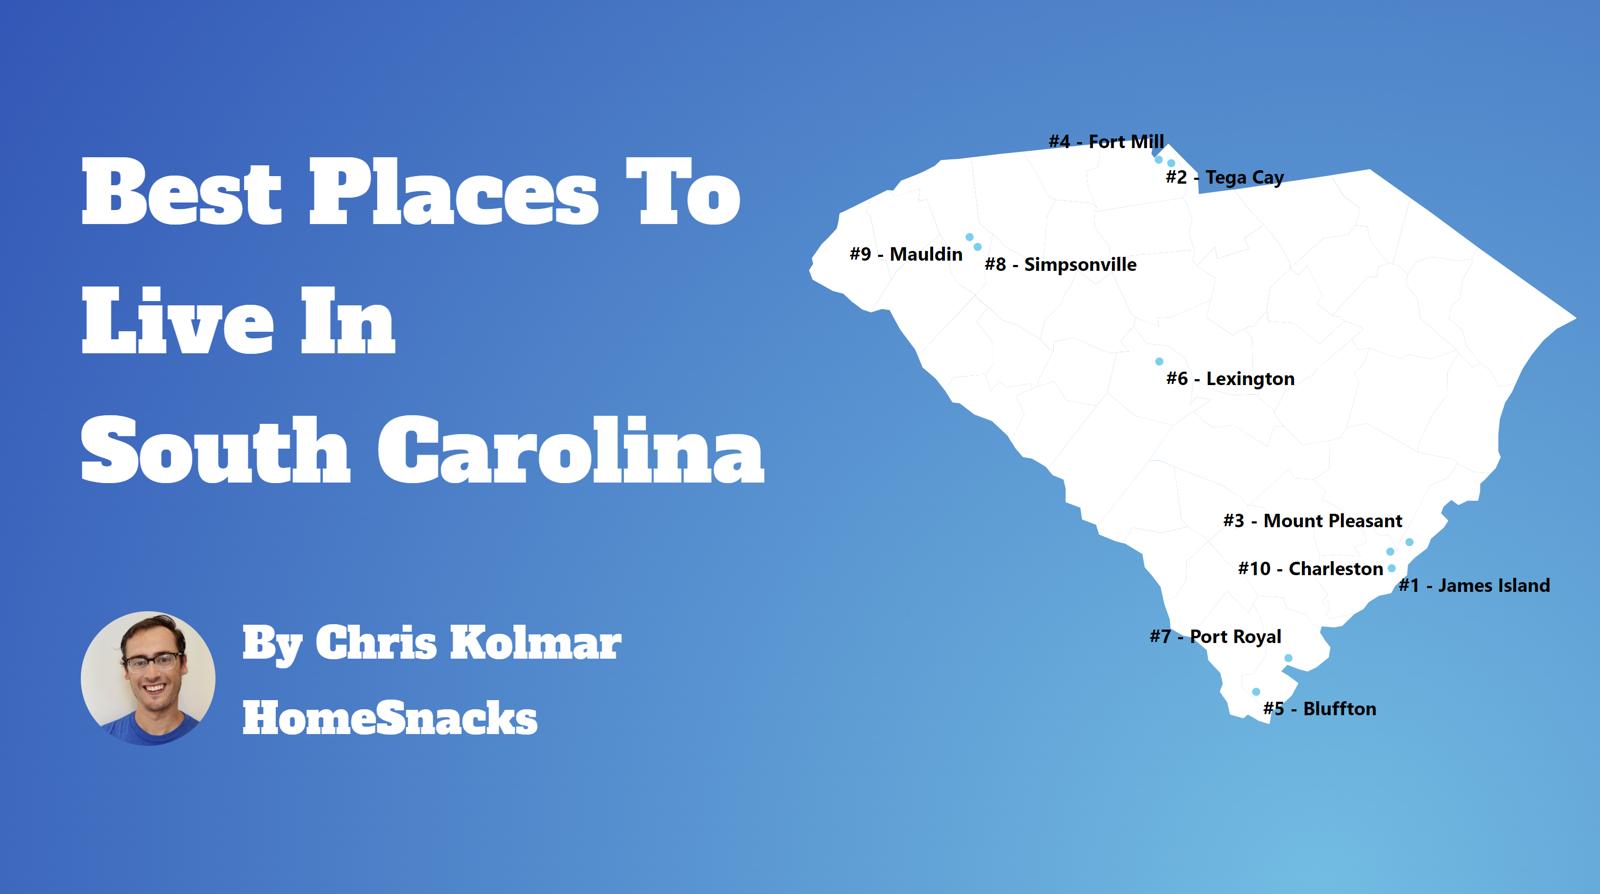
The 10 Best Places To Live In South Carolina For 2026
What city is the best place to live in South Carolina for 2026? According to the US Census and FBI data, Tega Cay is the best place to live in South Carolina.
In South Carolina, it helps to be close to Myrtle Beach and within a day trip to Congaree National Park.
Read on to learn more about the best places in The Palmetto State.
For more reading, check out:
The 10 Best Places To Live In South Carolina For 2026

| Stat | Tega Cay | South Carolina |
|---|---|---|
| Population | 13,615 | 5,296,225 |
| Rank Last Year | 1 | – |
| Median Home Value | $611,048 | $304,083 |
| Median Income | $142,000 | $69,324 |
| Unemployment Rate | 2.2% | 4.9% |
| Crime Per Capita | 0.0035 | 0.0249 |
More on Tega Cay: Data | Crime | Cost Of Living | Movers
No, we have not fudged the numbers, Tega Cay’s numbers are legit, they’re just so good that they’re hard to believe. But, believe it, and if you’ve ever thought about moving here, do it now because not only is Tega Cay South Carolina’s best city, it is also one of the fastest growing places in the state.
Do we think this is why the median home price here is the 3rd highest in the state? Absolutely: classic case of supply and demand. In terms of affordability, however, the Tega Cay’s overall cost of living isn’t too bad, but living expenses like groceries and health services will take a bite out of your paycheck. So, make sure you find a job that pays a combined household income of $142,000/year.

| Stat | Mount Pleasant | South Carolina |
|---|---|---|
| Population | 93,993 | 5,296,225 |
| Rank Last Year | 2 | – |
| Median Home Value | $875,092 | $304,083 |
| Median Income | $124,755 | $69,324 |
| Unemployment Rate | 3.3% | 4.9% |
| Crime Per Capita | 0.0134 | 0.0249 |
More on Mount Pleasant: Data | Crime | Cost Of Living | Movers
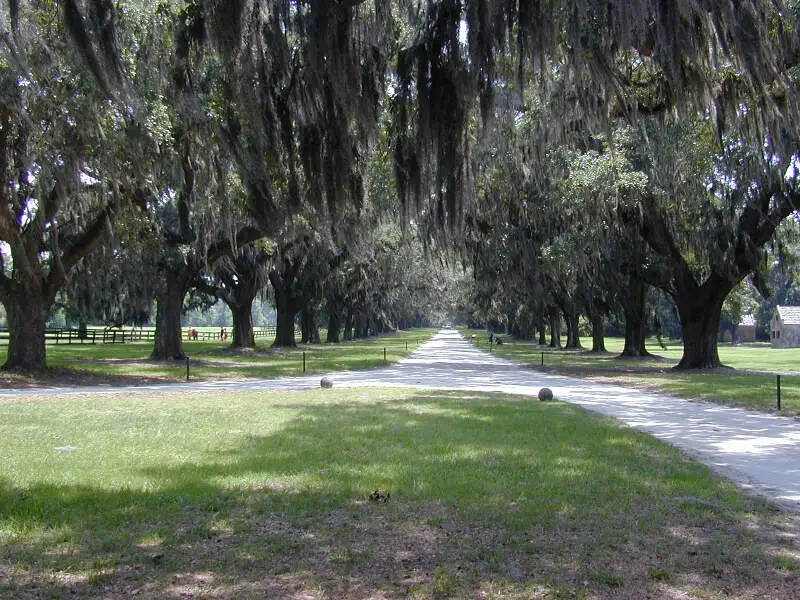
Of course the word “pleasant” is in the name of South Carolina’s #2 best place to live, Mount Pleasant. But, it’s not only because the city has great weather and is close to the Atlantic Coast, it’s more about its low crime rate, low unemployment rate, and the fact that the locals here make close to $124,755/year.
To put Mount Pleasant’s safety record into perspective, you have a greater chance of a Palmetto Tree falling on you than being involved in a crime as the crime rate here is below the national level. Heck, the people here are too busy working to be naughty–Mount Pleasant’s unemployment rate is the 14th lowest in the state at 3.3%. The cost of living is a bit higher in Mount Pleasant; so, be prepared to pay a bit more for your living expenses.

| Stat | Fort Mill | South Carolina |
|---|---|---|
| Population | 30,775 | 5,296,225 |
| Rank Last Year | 3 | – |
| Median Home Value | $527,208 | $304,083 |
| Median Income | $121,823 | $69,324 |
| Unemployment Rate | 2.3% | 4.9% |
| Crime Per Capita | 0.0082 | 0.0249 |
More on Fort Mill: Data | Crime | Cost Of Living | Movers
Mix a little southern charm with a little southern hospitality and you have the 3rd best place to live in South Carolina, Fort Mill. Yes, this little piece of heaven from the Southeastern United States, is about as close to a perfect place as you can get. The 30,775 residents here are pretty lucky as the city’s unemployment rate is the 7th lowest in the state at 2.3% and the median income is $121,823/year. This salary is super handy when it comes to paying the 6th best median home price in the state at $527,208 and the city’s slightly higher cost of living.
The crime rate in Fort Mill is also super low. In fact, there were only 250 committed here last year making it one of the safest places in the state.

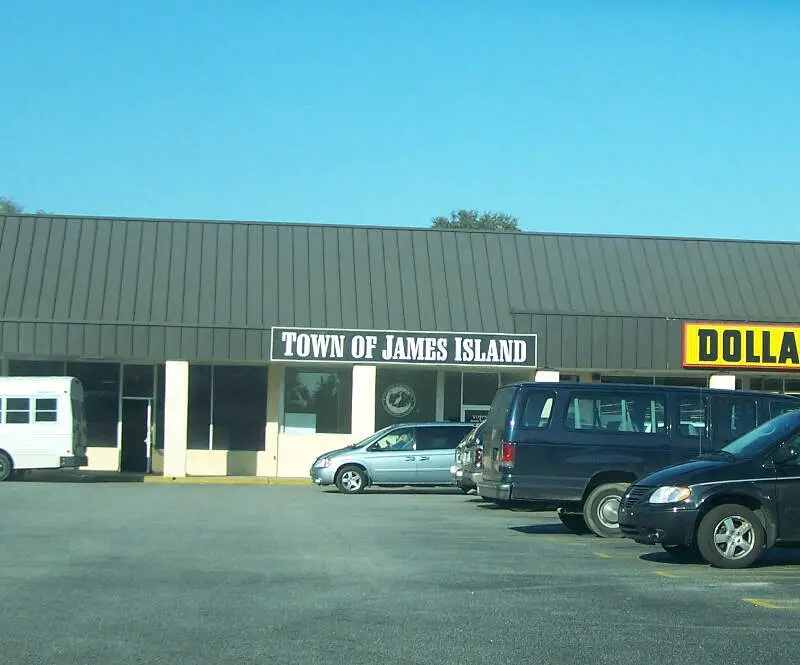
| Stat | James Island | South Carolina |
|---|---|---|
| Population | 12,198 | 5,296,225 |
| Rank Last Year | 6 | – |
| Median Home Value | $597,130 | $304,083 |
| Median Income | $104,217 | $69,324 |
| Unemployment Rate | 1.2% | 4.9% |
| Crime Per Capita | 0.0426 | 0.0249 |
More on James Island: Data | Cost Of Living | Movers
The grass is definitely greener on the side of South Carolina that houses the state’s 4th best place to live, James Island. Located just south of the Charleston Harbor where the Stono and Folly Rivers meet, James Island has managed to protect its small town feel while looking out for its 12,198 residents’ bottom line.
James Island’s cost of living might be slightly higher than the rest of the state, but the city’s median income is $104,217/year. The median home price in James Island is the 4th highest in South Carolina at $597,130. And if you know anything about property taxes, they are based on home prices and higher property taxes generally mean better schools. Folks, James Island has some pretty great schools. In fact, the test scores and graduation rates from the Charleston 01 School District are surpassing the rest of the state.

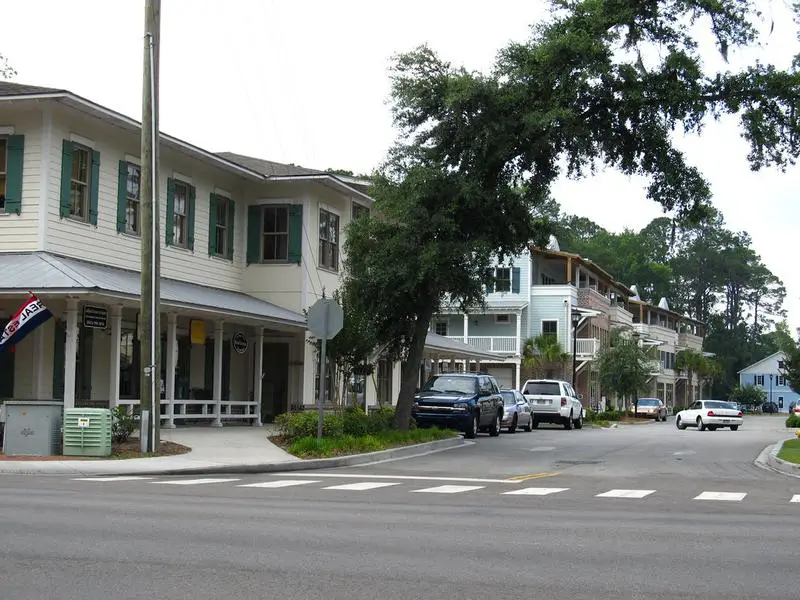
| Stat | Bluffton | South Carolina |
|---|---|---|
| Population | 33,157 | 5,296,225 |
| Rank Last Year | 4 | – |
| Median Home Value | $498,492 | $304,083 |
| Median Income | $111,281 | $69,324 |
| Unemployment Rate | 2.2% | 4.9% |
| Crime Per Capita | 0.0108 | 0.0249 |
More on Bluffton: Data | Crime | Cost Of Living | Movers
One of the fastest growing communities in South Carolina, Bluffton had just over 1,200 residents in 2000. Now? The population has swelled to 33,157. The influx of people comes as Bluffton ranks as the number 5 top place in the state to call home.
Built along the Atlantic Coast in the southern-most part of the state, Bluffton has an excellent location. It is about half hour north of Savannah, Georgia, the region’s major population center. It’s also about two hours south of Charleston. Want more of a resort experience? The famed Hilton Head Island sits just over the bridge.
Given these local draws, Bluffton boasts a thriving economy. It has the 4th highest median income in the state, with a figure of $111,281. The unemployment rate is similarly healthy. The local pace of 2.2% represents the 6th best rate in South Carolina.
Schools in the area are above average, with ratings of 7/10 from Great Schools. The crime rate is almost 50% below the national average. Living in Bluffton can get expensive, with a cost of living about 10% above the U.S. standard. Home prices are also high, with a median home value of $498,492.

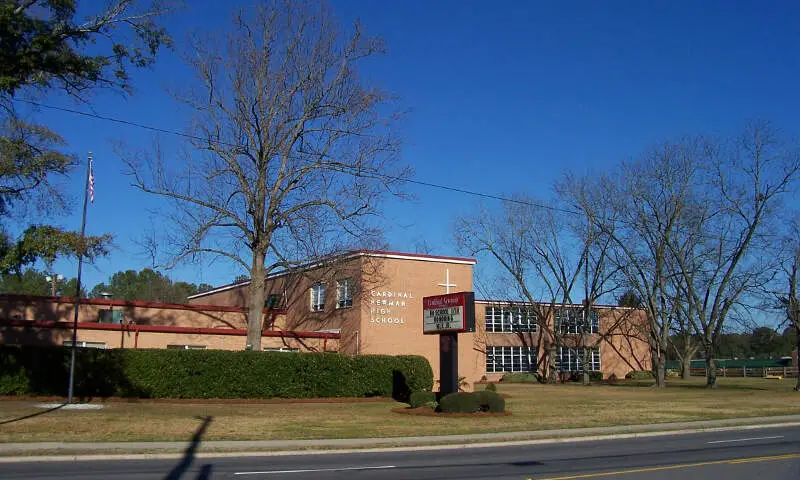
| Stat | Forest Acres | South Carolina |
|---|---|---|
| Population | 10,530 | 5,296,225 |
| Rank Last Year | 9 | – |
| Median Home Value | $335,524 | $304,083 |
| Median Income | $78,306 | $69,324 |
| Unemployment Rate | 4.1% | 4.9% |
| Crime Per Capita | 0.0362 | 0.0249 |
More on Forest Acres: Data | Crime | Cost Of Living | Movers
If you are looking for acres and acres of South Carolina’s 6th best place to live, Forest Acres, has this and more. Yes, Forest Acres scored an 8/10 on our SnackAbility scale with an emphasis in affordability, amenities, and commute times. One of only a few places to make our list from South Carolina’s interior, Forest Acres is a bedroom community of 10,530 residents just outside of Columbia. Forest Acres is not even 10 minutes from the “big city.”
And it’s true what they say about “all good things come in small cities.” Forest Acres has the 23rd lowest median home price in the state. The overall cost of living here is lower than the national average, and if you choose to live in Forest Acres you will save on most major living expenses.

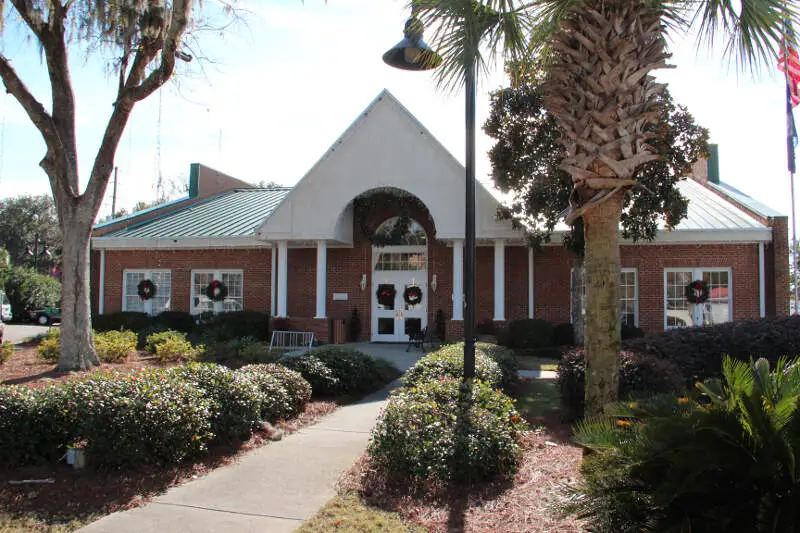
| Stat | Port Royal | South Carolina |
|---|---|---|
| Population | 15,579 | 5,296,225 |
| Rank Last Year | 7 | – |
| Median Home Value | $355,156 | $304,083 |
| Median Income | $74,870 | $69,324 |
| Unemployment Rate | 1.0% | 4.9% |
| Crime Per Capita | 0.0147 | 0.0249 |
More on Port Royal: Data | Crime | Cost Of Living | Movers
Port Royal, South Carolina is an island town about an hour northeast of Savannah. The island life transfer nicely to being one of the best places to live in South Carolina.
As you would expect, some of the best perks of living on island close to the water have to do with the outdoors. Those perks include access to the Cypress Wetlands, the Port Royal Farmer Market, and The Sands beaches and boardwalk. And after a day on the beach you can grab dinner at Fishcamp on 11th street for some seafood or the Old Burn Tavern if turf is more to your liking.
On the numbers side of things, Port Royal really shines for its best commute times and safety – the city has the 10th lowest levels of property crime in the state. So you’ll know your wallet is safe to keep on your beach towel at the beach.


| Stat | Lexington | South Carolina |
|---|---|---|
| Population | 24,585 | 5,296,225 |
| Rank Last Year | 5 | – |
| Median Home Value | $303,204 | $304,083 |
| Median Income | $87,126 | $69,324 |
| Unemployment Rate | 5.2% | 4.9% |
| Crime Per Capita | 0.0174 | 0.0249 |
More on Lexington: Data | Crime | Cost Of Living | Movers
No, this is not fake news, people, the 8th best city in South Carolina, Lexington, really is super affordable and super fun.
Folks, when we pulled Lexington’s housing numbers, we discovered that the median home price here is the 8th lowest in the state at $303,204. Lexington’s overall cost of living follows the same trend. Not to mention, the locals here make upwards of $87,126/year making it one of the wealthiest cities in the state as well. And in terms of fun, Lexington is located on the southeast banks of Lake Murray, so you can swim, boat, and bike here until your heart’s content.

| Stat | Mauldin | South Carolina |
|---|---|---|
| Population | 27,055 | 5,296,225 |
| Rank Last Year | 8 | – |
| Median Home Value | $297,318 | $304,083 |
| Median Income | $82,331 | $69,324 |
| Unemployment Rate | 4.9% | 4.9% |
| Crime Per Capita | 0.0173 | 0.0249 |
More on Mauldin: Data | Crime | Cost Of Living | Movers
So, you’re tired of paying South Carolina’s rental prices and now you want to buy a home? Well, you’ve come to the right place. Mauldin is not only The Palmetto State’s 9th best place to live, it has the 34th lowest median home price in the state at $297,318.
With the number of people who currently live here, it’s obvious that Mauldin must be pretty great. Heck, anyone who wants a job here can have one as the unemployment rate is the 33rd lowest in the state at 4.9%. Not to mention, the median income here is one of the highest in South Carolina at $82,331/year. It’s also super safe here; in fact, Mauldin’s crime rate is below the national average with a majority of the crimes reported property related.


| Stat | Hanahan | South Carolina |
|---|---|---|
| Population | 21,452 | 5,296,225 |
| Rank Last Year | 13 | – |
| Median Home Value | $404,451 | $304,083 |
| Median Income | $87,984 | $69,324 |
| Unemployment Rate | 2.5% | 4.9% |
| Crime Per Capita | 0.0170 | 0.0249 |
More on Hanahan: Data | Crime | Cost Of Living | Movers
Are you looking for a change of pace? Do you want to live close to water? Are you working with a budget? If you answered “yes” to any of these questions, the 10th best place to live in South Carolina is for you.
Hanahan is one of the most affordable places to make our list and the youngsters have taken notice as this city has the youngest population. They seem to be gravitating to Hanahan for its low cost of living, affordable housing options, and amenities. To put this in perspective, if you choose to buy your forever home for the city’s median home price of $404,451, living expenses like groceries, health services, and transportation won’t break your bank. It’s also helpful that the median household income here is $87,984/year.
Mapping The Best And Worst Places To Live in South Carolina
Best Places To Live In South Carolina Size Requirement
Before we even started to collect data on the best places to live in South Carolina, we had to answer a tough question: Is it fair to pit Columbia, with a population of 139,643, against places with a population of 18?
We firmly decided no, that just isn’t fair.
So, to create our ranking, we broke the best places to live into three tiers:
- Cities — Populations over 5,000
- Towns — Populations between 1,000 and 5,000
- Small Towns — Populations below 1,000
This filter left 63 cities, 141 towns, and 130 small towns.
We then decided no matter how much anyone loves their town, the best cities to live in South Carolina have more of everything, and therefore, you need over 5,000 people to truly be ‘the best.’
Methodology: How We Calculated The Best Cities To Live In South Carolina
Now that we had our set of the best possible cities, it was time to rank them using Saturday Night Science.
We ranked each place in South Carolina across a number of criteria from one to 63, with one being the best.
We then took the average rank across all criteria, crowning the city posting the lowest overall score, the “Best Place To Live In South Carolina.”
The criteria we looked to determine the best places were:
- Median Home Values
- Median Income
- Population Density (Higher is better)
- Unemployment Rate
- Commute Time
- Crime
- Education Levels
- Health Insurance Coverage
- Poverty rates
Sources of criteria include the New Census Data, FBI Crime Data, and Zillow. We updated this article for 2026. This report is our eleventh time ranking South Carolina’s best places to live.
If your city or town isn’t among the top 10, jump down to the bottom of the post to see a detailed chart of the best places in South Carolina. Otherwise, buckle up for a ride down good living lane with Tega Cay at the end of the cul-de-sac.
Summary: The Best Places In South Carolina
If you’re looking at areas in South Carolina with the best economic situations, where there’s lower than average crime, and a lot to do, this is an accurate list.
The best places to live in South Carolina are Tega Cay, Mount Pleasant, Fort Mill, James Island, Bluffton, Forest Acres, Port Royal, Lexington, Mauldin, and Hanahan.
Tega Cay made a strong showing to take in the overall number one spot for the best place to live in South Carolina for 2026.
If you’re curious enough, here are the worst places to live in South Carolina according to the data:
- Orangeburg (Pop. 13,253)
- Union (Pop. 8,079)
- Dillon (Pop. 6,354)
For more South Carolina reading, check out:
- Cheapest Places To Live In South Carolina
- Most Dangerous Cities In South Carolina
- Best Places To Raise A Family In South Carolina
- Best Places To Retire In South Carolina
- Richest Cities In South Carolina
- Safest Places In South Carolina
- Worst Places To Live In South Carolina
Best Places To Live In South Carolina Table
| Rank | City | Population | Unemployment Rate | Home Value | Median Income | Rent | Crime Per Capita |
|---|---|---|---|---|---|---|---|
| 1 | Tega Cay | 13,615 | 2.2% | $611,048 | $142,000 | $1,408 | 0.0035 |
| 2 | Mount Pleasant | 93,993 | 3.3% | $875,092 | $124,755 | $2,159 | 0.0134 |
| 3 | Fort Mill | 30,775 | 2.3% | $527,208 | $121,823 | $1,503 | 0.0082 |
| 4 | James Island | 12,198 | 1.2% | $597,130 | $104,217 | $1,695 | 0.0426 |
| 5 | Bluffton | 33,157 | 2.2% | $498,492 | $111,281 | $2,256 | 0.0108 |
| 6 | Forest Acres | 10,530 | 4.1% | $335,524 | $78,306 | $1,263 | 0.0362 |
| 7 | Port Royal | 15,579 | 1.0% | $355,156 | $74,870 | $1,726 | 0.0147 |
| 8 | Lexington | 24,585 | 5.2% | $303,204 | $87,126 | $1,545 | 0.0174 |
| 9 | Mauldin | 27,055 | 4.9% | $297,318 | $82,331 | $1,490 | 0.0173 |
| 10 | Hanahan | 21,452 | 2.5% | $404,451 | $87,984 | $1,412 | 0.0170 |
| 11 | Charleston | 154,338 | 3.4% | $589,607 | $92,414 | $1,722 | 0.0242 |
| 12 | North Augusta | 25,653 | 3.8% | $265,723 | $86,092 | $1,169 | 0.0046 |
| 13 | Simpsonville | 26,144 | 4.1% | $377,969 | $82,457 | $1,415 | 0.0312 |
| 14 | Lyman | 6,547 | 3.4% | $303,650 | $75,653 | $1,081 | 0.0101 |
| 15 | Fountain Inn | 12,020 | 4.7% | $305,625 | $73,585 | $1,184 | 0.0123 |
| 16 | Goose Creek | 48,078 | 2.7% | $318,055 | $88,178 | $1,690 | 0.0180 |
| 17 | Irmo | 11,813 | 8.4% | $281,254 | $80,489 | $1,477 | 0.0186 |
| 18 | Clover | 7,234 | 4.8% | $413,527 | $85,450 | $841 | 0.0119 |
| 19 | Summerville | 51,654 | 4.9% | $376,903 | $81,046 | $1,526 | 0.0201 |
| 20 | Hilton Head Island | 37,911 | 3.0% | $787,678 | $94,657 | $1,479 | 0.0467 |
| 21 | Clemson | 18,072 | 4.5% | $396,340 | $49,520 | $1,007 | 0.0212 |
| 22 | Moncks Corner | 15,485 | 3.6% | $360,390 | $91,500 | $1,307 | 0.0272 |
| 23 | North Myrtle Beach | 19,855 | 4.0% | $390,621 | $72,722 | $1,263 | 0.0375 |
| 24 | Beaufort | 13,747 | 3.6% | $412,455 | $61,220 | $1,212 | 0.0433 |
| 25 | Central | 5,320 | 4.4% | $284,220 | $60,258 | $876 | 0.0132 |
| 26 | Greer | 41,536 | 2.4% | $348,460 | $82,626 | $1,198 | 0.0238 |
| 27 | Greenville | 72,935 | 4.4% | $327,592 | $71,472 | $1,312 | 0.0414 |
| 28 | Blythewood | 5,731 | 5.0% | $340,026 | $94,167 | $1,107 | 0.0331 |
| 29 | Easley | 24,841 | 3.2% | $315,979 | $66,299 | $947 | 0.0226 |
| 30 | Rock Hill | 75,259 | 5.8% | $326,184 | $68,771 | $1,341 | 0.0282 |
| 31 | Aiken | 32,521 | 5.4% | $272,072 | $76,746 | $1,180 | 0.0462 |
| 32 | Hardeeville | 10,871 | 7.3% | $426,444 | $78,365 | $1,406 | 0.0211 |
| 33 | Travelers Rest | 8,370 | 6.2% | $353,915 | $54,583 | $1,033 | 0.0299 |
| 34 | Florence | 40,408 | 5.4% | $219,285 | $56,143 | $992 | 0.0477 |
| 35 | West Columbia | 17,963 | 4.8% | $226,049 | $56,912 | $1,201 | 0.0537 |
| 36 | Hollywood | 5,382 | 2.5% | $519,342 | $73,693 | $1,625 | 0.0426 |
| 37 | Cayce | 13,741 | 5.3% | $210,164 | $62,045 | $1,360 | 0.0349 |
| 38 | York | 8,969 | 2.2% | $356,168 | $56,176 | $896 | 0.0396 |
| 39 | Columbia | 139,643 | 7.5% | $229,067 | $55,529 | $1,204 | 0.0414 |
| 40 | Myrtle Beach | 38,371 | 5.4% | $320,925 | $60,394 | $1,261 | 0.0723 |
| 41 | Sumter | 43,053 | 6.6% | $213,462 | $55,592 | $1,076 | 0.0475 |
| 42 | Seneca | 8,993 | 8.9% | $304,236 | $52,022 | $807 | 0.0237 |
| 43 | Georgetown | 8,565 | 9.4% | $250,504 | $56,981 | $780 | 0.0459 |
| 44 | North Charleston | 119,913 | 4.3% | $309,521 | $62,956 | $1,430 | 0.0491 |
| 45 | Anderson | 30,051 | 6.8% | $272,108 | $46,933 | $975 | 0.0629 |
| 46 | Greenwood | 22,536 | 8.7% | $183,962 | $41,150 | $839 | 0.0380 |
| 47 | Conway | 27,263 | 8.3% | $286,177 | $56,650 | $866 | 0.0257 |
| 48 | Hartsville | 7,419 | 7.2% | $179,198 | $49,272 | $874 | 0.0656 |
| 49 | Laurens | 9,336 | 1.9% | $180,131 | $49,246 | $833 | 0.0390 |
| 50 | Spartanburg | 38,910 | 7.4% | $233,686 | $51,964 | $1,099 | 0.0676 |
| 51 | Gaffney | 12,596 | 10.6% | $185,840 | $41,089 | $887 | 0.0433 |
| 52 | Camden | 8,267 | 8.2% | $237,602 | $63,576 | $956 | 0.0503 |
| 53 | Clinton | 7,676 | 4.9% | $163,865 | $44,522 | $899 | 0.0535 |
| 54 | Marion | 6,206 | 4.7% | $145,562 | $30,662 | $651 | 0.0611 |
| 55 | Newberry | 10,790 | 6.9% | $166,454 | $51,260 | $831 | 0.0374 |
| 56 | Darlington | 6,120 | 7.1% | $153,322 | $33,952 | $840 | 0.0690 |
| 57 | Walterboro | 5,480 | 6.1% | $210,403 | $56,457 | $965 | 0.0637 |
| 58 | Chester | 5,218 | 7.6% | $128,679 | $46,138 | $902 | 0.0483 |
| 59 | Lancaster | 8,921 | 9.6% | $291,062 | $46,311 | $868 | 0.0756 |
| 60 | Bennettsville | 7,751 | 12.5% | $81,007 | $37,115 | $671 | 0.0378 |
| 61 | Orangeburg | 13,253 | 11.8% | $162,436 | $38,635 | $848 | 0.0749 |
| 62 | Union | 8,079 | 11.4% | $136,356 | $31,914 | $832 | 0.0727 |
| 63 | Dillon | 6,354 | 8.0% | $100,984 | $35,891 | $630 | 0.0888 |
jQuery(document).ready(function($) { create_map(‘https://www.homesnacks.com/graphs/maps/best/sc.html’); });