South Boston, VA
Demographics And Statistics
Living In South Boston, Virginia Summary
Life in South Boston research summary. HomeSnacks has been using Saturday Night Science to research the quality of life in South Boston over the past nine years using Census, FBI, Zillow, and other primary data sources. Based on the most recently available data, we found the following about life in South Boston:
The population in South Boston is 7,896.
The median home value in South Boston is $144,257.
The median income in South Boston is $41,102.
The cost of living in South Boston is 86 which is 0.9x lower than the national average.
The median rent in South Boston is $756.
The unemployment rate in South Boston is 5.0%.
The poverty rate in South Boston is 26.3%.
The average high in South Boston is 69.6° and the average low is 45.2°.
South Boston SnackAbility
Overall SnackAbility
South Boston, VA Crime Report
Crime in South Boston summary. We use data from the FBI to determine the crime rates in South Boston. Key points include:
There were 231 total crimes in South Boston in the last reporting year.
The overall crime rate per 100,000 people in South Boston is 2,978.0 / 100k people.
The violent crime rate per 100,000 people in South Boston is 464.1 / 100k people.
The property crime rate per 100,000 people in South Boston is 2,513.9 / 100k people.
Overall, crime in South Boston is 40.52% above the national average.
Total Crimes
Above National Average
Crime In South Boston Comparison Table
| Statistic | Count Raw |
South Boston / 100k People |
Virginia / 100k People |
National / 100k People |
|---|---|---|---|---|
| Total Crimes Per 100K | 231 | 2,978.0 | 1,787.6 | 2,119.2 |
| Violent Crime | 36 | 464.1 | 217.9 | 359.0 |
| Murder | 1 | 12.9 | 4.8 | 5.0 |
| Robbery | 3 | 38.7 | 33.1 | 61.0 |
| Aggravated Assault | 28 | 361.0 | 152.2 | 256.0 |
| Property Crime | 195 | 2,513.9 | 1,569.7 | 1,760.0 |
| Burglary | 28 | 361.0 | 108.7 | 229.0 |
| Larceny | 151 | 1,946.6 | 1,315.9 | 1,272.0 |
| Car Theft | 16 | 206.3 | 145.1 | 259.0 |
South Boston, VA Cost Of Living
Cost of living in South Boston summary. We use data on the cost of living to determine how expensive it is to live in South Boston. Real estate prices drive most of the variance in cost of living around Virginia. Key points include:
The cost of living in South Boston is 86 with 100 being average.
The cost of living in South Boston is 0.9x lower than the national average.
The median home value in South Boston is $144,257.
The median income in South Boston is $41,102.
South Boston's Overall Cost Of Living
Lower Than The National Average
Cost Of Living In South Boston Comparison Table
| Living Expense | South Boston | Virginia | National Average | |
|---|---|---|---|---|
| Overall | 86 | 110 | 100 | |
| Services | 92 | 101 | 100 | |
| Groceries | 98 | 99 | 100 | |
| Health | 101 | 98 | 100 | |
| Housing | 70 | 130 | 100 | |
| Transportation | 91 | 94 | 100 | |
| Utilities | 98 | 104 | 100 | |
South Boston, VA Weather
The average high in South Boston is 69.6° and the average low is 45.2°.
There are 72.0 days of precipitation each year.
Expect an average of 44.6 inches of precipitation each year with 4.3 inches of snow.
| Stat | South Boston |
|---|---|
| Average Annual High | 69.6 |
| Average Annual Low | 45.2 |
| Annual Precipitation Days | 72.0 |
| Average Annual Precipitation | 44.6 |
| Average Annual Snowfall | 4.3 |
Average High
Days of Rain
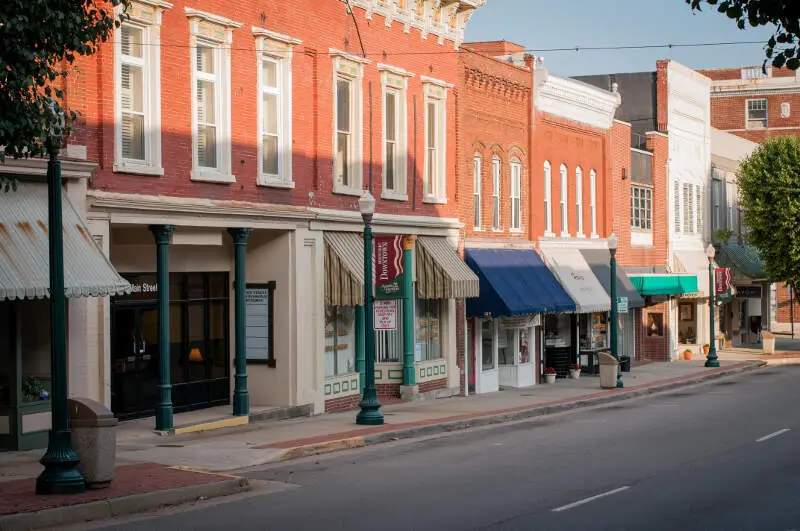
South Boston, VA Photos
2 Reviews & Comments About South Boston
/5

Jade Wolf - None
I'm from South Boston Va it's pretty bad there. You can't live there without getting into some kind of trouble
HomeSnacks User - 2019-02-28 12:24:30.445460
t's just a crack head town with a huge MS 13 problem.
Watch out for the run down neighborhoods because that's where the gang and drug problems are. Believe me I'm from South Boston
Rankings for South Boston in Virginia


Locations Around South Boston
Map Of South Boston, VA
Best Places Around South Boston
Hillsborough, NC
Population 9,656
Mebane, NC
Population 18,899
Butner, NC
Population 7,996
Lynchburg, VA
Population 79,255
Timberlake, VA
Population 12,833
Henderson, NC
Population 14,922
Oxford, NC
Population 8,897
Roxboro, NC
Population 8,144
Danville, VA
Population 42,239
Reidsville, NC
Population 14,547
South Boston Demographics And Statistics
Population over time in South Boston
The current population in South Boston is 7,896. The population has decreased -3.7% from 2010.
| Year | Population | % Change |
|---|---|---|
| 2023 | 7,896 | -0.6% |
| 2022 | 7,942 | -0.9% |
| 2021 | 8,011 | 4.4% |
| 2020 | 7,676 | -1.1% |
| 2019 | 7,762 | -0.8% |
| 2018 | 7,828 | -0.7% |
| 2017 | 7,887 | -1.4% |
| 2016 | 8,000 | -0.5% |
| 2015 | 8,037 | -0.4% |
| 2014 | 8,069 | -0.4% |
| 2013 | 8,104 | -0.3% |
| 2012 | 8,127 | -0.5% |
| 2011 | 8,169 | -0.4% |
| 2010 | 8,202 | - |
Race / Ethnicity in South Boston
South Boston is:
40.9% White with 3,227 White residents.
55.6% African American with 4,394 African American residents.
0.0% American Indian with 0 American Indian residents.
1.5% Asian with 115 Asian residents.
0.0% Hawaiian with 0 Hawaiian residents.
0.0% Other with 0 Other residents.
1.6% Two Or More with 124 Two Or More residents.
0.5% Hispanic with 36 Hispanic residents.
| Race | South Boston | VA | USA |
|---|---|---|---|
| White | 40.9% | 59.0% | 58.2% |
| African American | 55.6% | 18.4% | 12.0% |
| American Indian | 0.0% | 0.1% | 0.5% |
| Asian | 1.5% | 6.8% | 5.7% |
| Hawaiian | 0.0% | 0.1% | 0.2% |
| Other | 0.0% | 0.5% | 0.5% |
| Two Or More | 1.6% | 4.3% | 3.9% |
| Hispanic | 0.5% | 10.7% | 19.0% |
Gender in South Boston
South Boston is 56.2% female with 4,438 female residents.
South Boston is 43.8% male with 3,458 male residents.
| Gender | South Boston | VA | USA |
|---|---|---|---|
| Female | 56.2% | 50.6% | 50.5% |
| Male | 43.8% | 49.4% | 49.5% |
Highest level of educational attainment in South Boston for adults over 25
4.0% of adults in South Boston completed < 9th grade.
11.0% of adults in South Boston completed 9-12th grade.
36.0% of adults in South Boston completed high school / ged.
23.0% of adults in South Boston completed some college.
7.0% of adults in South Boston completed associate's degree.
13.0% of adults in South Boston completed bachelor's degree.
5.0% of adults in South Boston completed master's degree.
1.0% of adults in South Boston completed professional degree.
0.0% of adults in South Boston completed doctorate degree.
| Education | South Boston | VA | USA |
|---|---|---|---|
| < 9th Grade | 4.0% | 4.0% | 5.0% |
| 9-12th Grade | 11.0% | 5.0% | 6.0% |
| High School / GED | 36.0% | 24.0% | 26.0% |
| Some College | 23.0% | 18.0% | 19.0% |
| Associate's Degree | 7.0% | 8.0% | 9.0% |
| Bachelor's Degree | 13.0% | 23.0% | 21.0% |
| Master's Degree | 5.0% | 13.0% | 10.0% |
| Professional Degree | 1.0% | 3.0% | 2.0% |
| Doctorate Degree | 0.0% | 2.0% | 2.0% |
Household Income For South Boston, Virginia
9.9% of households in South Boston earn Less than $10,000.
9.1% of households in South Boston earn $10,000 to $14,999.
16.1% of households in South Boston earn $15,000 to $24,999.
9.0% of households in South Boston earn $25,000 to $34,999.
13.6% of households in South Boston earn $35,000 to $49,999.
13.5% of households in South Boston earn $50,000 to $74,999.
10.3% of households in South Boston earn $75,000 to $99,999.
12.6% of households in South Boston earn $100,000 to $149,999.
4.5% of households in South Boston earn $150,000 to $199,999.
1.6% of households in South Boston earn $200,000 or more.
| Income | South Boston | VA | USA |
|---|---|---|---|
| Less than $10,000 | 9.9% | 4.2% | 4.9% |
| $10,000 to $14,999 | 9.1% | 2.9% | 3.6% |
| $15,000 to $24,999 | 16.1% | 5.5% | 6.6% |
| $25,000 to $34,999 | 9.0% | 5.9% | 6.8% |
| $35,000 to $49,999 | 13.6% | 9.1% | 10.4% |
| $50,000 to $74,999 | 13.5% | 14.6% | 15.7% |
| $75,000 to $99,999 | 10.3% | 12.1% | 12.7% |
| $100,000 to $149,999 | 12.6% | 18.2% | 17.4% |
| $150,000 to $199,999 | 4.5% | 10.7% | 9.3% |
| $200,000 or more | 1.6% | 16.9% | 12.6% |


