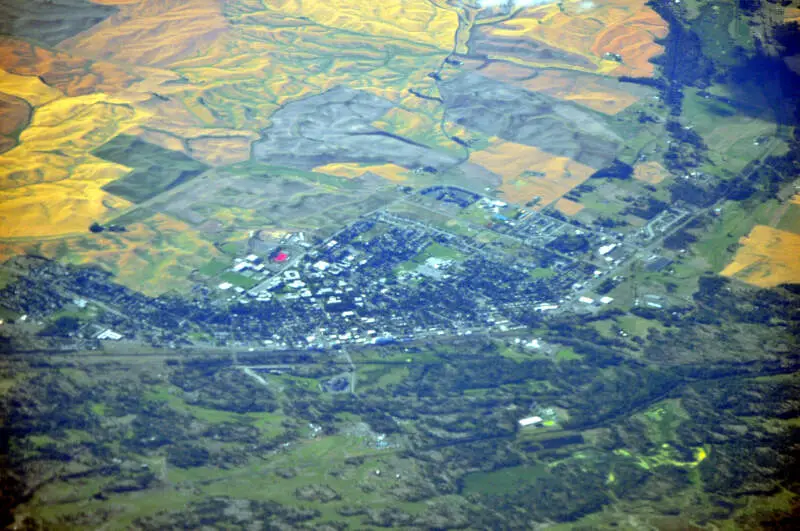
Cheney, WA
Demographics And Statistics
Living In Cheney, Washington Summary
Life in Cheney research summary. HomeSnacks has been using Saturday Night Science to research the quality of life in Cheney over the past nine years using Census, FBI, Zillow, and other primary data sources. Based on the most recently available data, we found the following about life in Cheney:
The population in Cheney is 12,830.
The median home value in Cheney is $419,818.
The median income in Cheney is $47,039.
The cost of living in Cheney is 108 which is 1.1x higher than the national average.
The median rent in Cheney is $1,075.
The unemployment rate in Cheney is 12.7%.
The poverty rate in Cheney is 34.6%.
The average high in Cheney is 57.1° and the average low is 36.1°.
Cheney SnackAbility
Overall SnackAbility
Cheney, WA Crime Report
Crime in Cheney summary. We use data from the FBI to determine the crime rates in Cheney. Key points include:
There were 253 total crimes in Cheney in the last reporting year.
The overall crime rate per 100,000 people in Cheney is 2,041.5 / 100k people.
The violent crime rate per 100,000 people in Cheney is 371.2 / 100k people.
The property crime rate per 100,000 people in Cheney is 1,670.3 / 100k people.
Overall, crime in Cheney is -3.67% below the national average.
Total Crimes
Below National Average
Crime In Cheney Comparison Table
| Statistic | Count Raw |
Cheney / 100k People |
Washington / 100k People |
National / 100k People |
|---|---|---|---|---|
| Total Crimes Per 100K | 253 | 2,041.5 | 2,792.6 | 2,119.2 |
| Violent Crime | 46 | 371.2 | 326.1 | 359.0 |
| Murder | 0 | 0.0 | 3.8 | 5.0 |
| Robbery | 5 | 40.3 | 67.5 | 61.0 |
| Aggravated Assault | 26 | 209.8 | 217.0 | 256.0 |
| Property Crime | 207 | 1,670.3 | 2,466.5 | 1,760.0 |
| Burglary | 26 | 209.8 | 398.8 | 229.0 |
| Larceny | 163 | 1,315.3 | 1,634.2 | 1,272.0 |
| Car Theft | 18 | 145.2 | 433.5 | 259.0 |
Cheney, WA Cost Of Living
Cost of living in Cheney summary. We use data on the cost of living to determine how expensive it is to live in Cheney. Real estate prices drive most of the variance in cost of living around Washington. Key points include:
The cost of living in Cheney is 108 with 100 being average.
The cost of living in Cheney is 1.1x higher than the national average.
The median home value in Cheney is $419,818.
The median income in Cheney is $47,039.
Cheney's Overall Cost Of Living
Higher Than The National Average
Cost Of Living In Cheney Comparison Table
| Living Expense | Cheney | Washington | National Average | |
|---|---|---|---|---|
| Overall | 108 | 118 | 100 | |
| Services | 100 | 111 | 100 | |
| Groceries | 112 | 112 | 100 | |
| Health | 111 | 122 | 100 | |
| Housing | 117 | 135 | 100 | |
| Transportation | 119 | 124 | 100 | |
| Utilities | 98 | 91 | 100 | |
Cheney, WA Weather
The average high in Cheney is 57.1° and the average low is 36.1°.
There are 53.0 days of precipitation each year.
Expect an average of 17.4 inches of precipitation each year with 44.5 inches of snow.
| Stat | Cheney |
|---|---|
| Average Annual High | 57.1 |
| Average Annual Low | 36.1 |
| Annual Precipitation Days | 53.0 |
| Average Annual Precipitation | 17.4 |
| Average Annual Snowfall | 44.5 |
Average High
Days of Rain
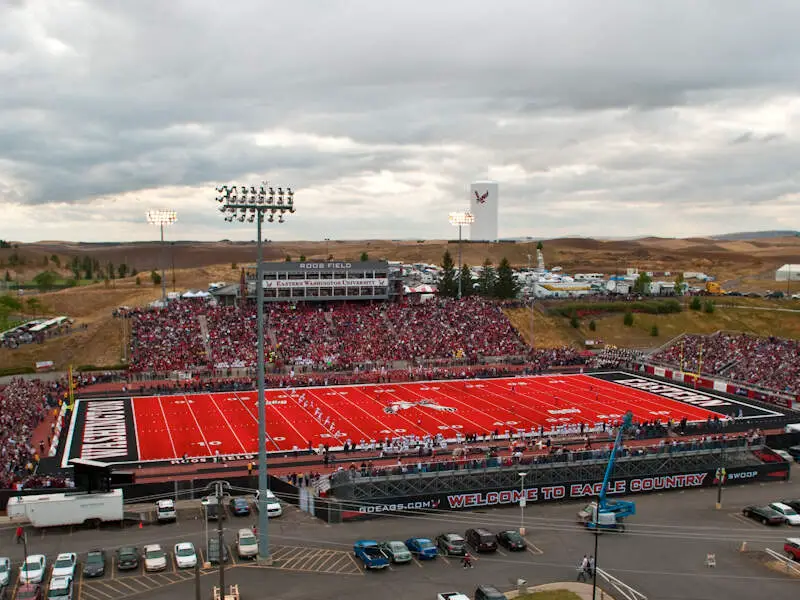
Cheney, WA Photos
Rankings for Cheney in Washington


Locations Around Cheney
Map Of Cheney, WA
Best Places Around Cheney
Airway Heights, WA
Population 10,766
Spokane, WA
Population 229,228
Spokane Valley, WA
Population 105,460
Liberty Lake, WA
Population 12,435
Country Homes, WA
Population 5,979
Mead, WA
Population 7,184
Otis Orchards-East Farms, WA
Population 5,486
Hayden, ID
Population 16,021
Post Falls, ID
Population 41,716
Town and Country, WA
Population 5,398
Cheney Demographics And Statistics
Population over time in Cheney
The current population in Cheney is 12,830. The population has increased 24.8% from 2010.
| Year | Population | % Change |
|---|---|---|
| 2023 | 12,830 | -0.1% |
| 2022 | 12,848 | 0.8% |
| 2021 | 12,743 | 2.3% |
| 2020 | 12,455 | 2.4% |
| 2019 | 12,165 | 1.7% |
| 2018 | 11,962 | 1.9% |
| 2017 | 11,735 | 2.2% |
| 2016 | 11,479 | 2.8% |
| 2015 | 11,171 | 1.4% |
| 2014 | 11,014 | 1.7% |
| 2013 | 10,828 | 1.9% |
| 2012 | 10,631 | 2.0% |
| 2011 | 10,422 | 1.4% |
| 2010 | 10,283 | - |
Race / Ethnicity in Cheney
Cheney is:
74.5% White with 9,557 White residents.
2.7% African American with 341 African American residents.
1.0% American Indian with 125 American Indian residents.
2.1% Asian with 270 Asian residents.
0.5% Hawaiian with 66 Hawaiian residents.
0.5% Other with 68 Other residents.
8.3% Two Or More with 1,059 Two Or More residents.
10.5% Hispanic with 1,344 Hispanic residents.
| Race | Cheney | WA | USA |
|---|---|---|---|
| White | 74.5% | 64.3% | 58.2% |
| African American | 2.7% | 3.8% | 12.0% |
| American Indian | 1.0% | 0.8% | 0.5% |
| Asian | 2.1% | 9.3% | 5.7% |
| Hawaiian | 0.5% | 0.7% | 0.2% |
| Other | 0.5% | 0.5% | 0.5% |
| Two Or More | 8.3% | 6.5% | 3.9% |
| Hispanic | 10.5% | 14.1% | 19.0% |
Gender in Cheney
Cheney is 55.7% female with 7,148 female residents.
Cheney is 44.3% male with 5,682 male residents.
| Gender | Cheney | WA | USA |
|---|---|---|---|
| Female | 55.7% | 49.6% | 50.5% |
| Male | 44.3% | 50.4% | 49.5% |
Highest level of educational attainment in Cheney for adults over 25
1.0% of adults in Cheney completed < 9th grade.
4.0% of adults in Cheney completed 9-12th grade.
18.0% of adults in Cheney completed high school / ged.
28.0% of adults in Cheney completed some college.
11.0% of adults in Cheney completed associate's degree.
24.0% of adults in Cheney completed bachelor's degree.
12.0% of adults in Cheney completed master's degree.
1.0% of adults in Cheney completed professional degree.
1.0% of adults in Cheney completed doctorate degree.
| Education | Cheney | WA | USA |
|---|---|---|---|
| < 9th Grade | 1.0% | 3.0% | 5.0% |
| 9-12th Grade | 4.0% | 4.0% | 6.0% |
| High School / GED | 18.0% | 22.0% | 26.0% |
| Some College | 28.0% | 22.0% | 19.0% |
| Associate's Degree | 11.0% | 10.0% | 9.0% |
| Bachelor's Degree | 24.0% | 24.0% | 21.0% |
| Master's Degree | 12.0% | 11.0% | 10.0% |
| Professional Degree | 1.0% | 2.0% | 2.0% |
| Doctorate Degree | 1.0% | 2.0% | 2.0% |
Household Income For Cheney, Washington
18.9% of households in Cheney earn Less than $10,000.
5.4% of households in Cheney earn $10,000 to $14,999.
9.0% of households in Cheney earn $15,000 to $24,999.
8.4% of households in Cheney earn $25,000 to $34,999.
10.7% of households in Cheney earn $35,000 to $49,999.
15.8% of households in Cheney earn $50,000 to $74,999.
10.3% of households in Cheney earn $75,000 to $99,999.
10.0% of households in Cheney earn $100,000 to $149,999.
2.9% of households in Cheney earn $150,000 to $199,999.
8.7% of households in Cheney earn $200,000 or more.
| Income | Cheney | WA | USA |
|---|---|---|---|
| Less than $10,000 | 18.9% | 3.8% | 4.9% |
| $10,000 to $14,999 | 5.4% | 2.7% | 3.6% |
| $15,000 to $24,999 | 9.0% | 4.9% | 6.6% |
| $25,000 to $34,999 | 8.4% | 5.3% | 6.8% |
| $35,000 to $49,999 | 10.7% | 8.6% | 10.4% |
| $50,000 to $74,999 | 15.8% | 14.6% | 15.7% |
| $75,000 to $99,999 | 10.3% | 12.6% | 12.7% |
| $100,000 to $149,999 | 10.0% | 19.2% | 17.4% |
| $150,000 to $199,999 | 2.9% | 11.3% | 9.3% |
| $200,000 or more | 8.7% | 17.2% | 12.6% |


