Whitest cities in New York research summary. We analyzed New York’s most recent Census data to determine the whitest cities in New York based on the percentage of White residents.
96.7% White · #1 whitest in New York
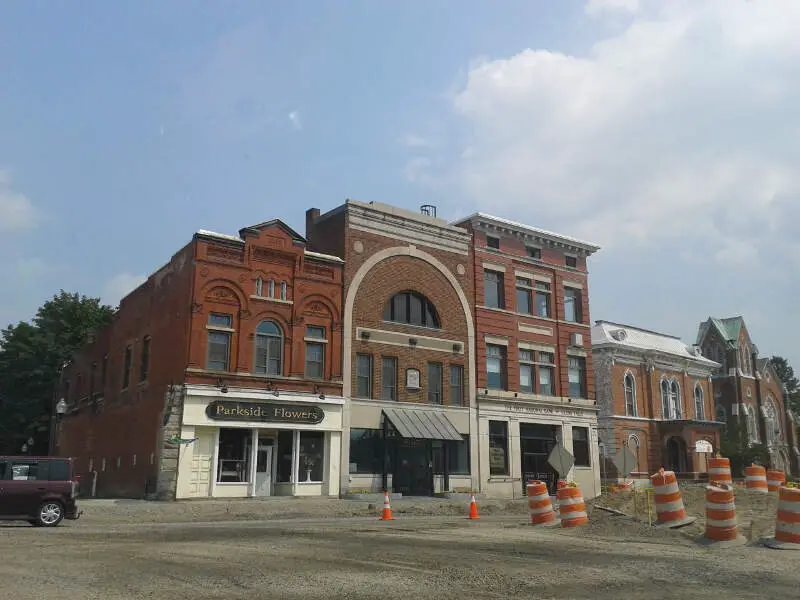
Lancaster is a town in Erie County, New York, United States, centered 14 miles east of downtown Buffalo. As of the 2010 census, the town population was 41,604.
Data | Crime | Cost of living | Movers
95.7% White · #2 whitest in New York
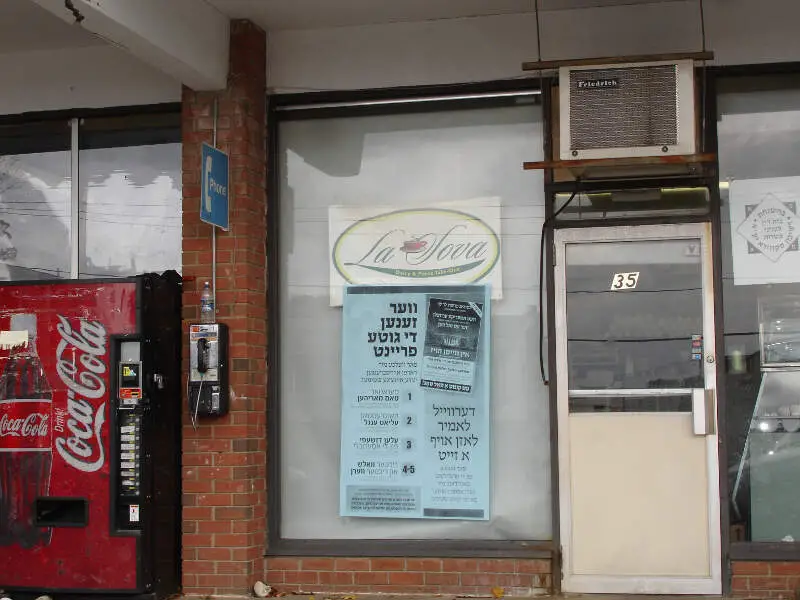
Kiryas Joel is a village within the town of Monroe in Orange County, New York, United States. The majority of its residents are Yiddish-speaking Hasidic Jews who belong to the worldwide Satmar Hasidic sect.
Data | Crime | Cost of living | Movers
95.6% White · #3 whitest in New York
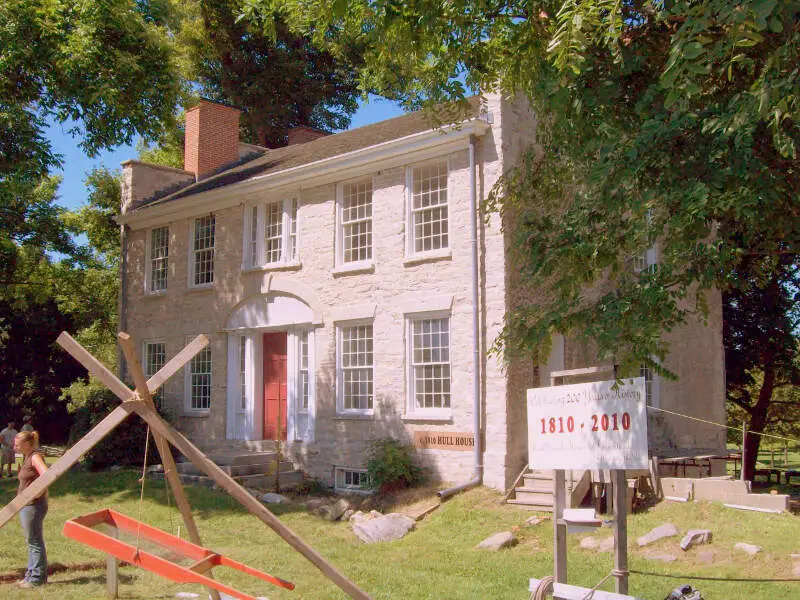
Malone is a town in Franklin County, New York, United States. The population was 14,545 at the 2010 census. The town contains a village also named Malone, which is the county seat. The town is an interior town located in the north-central part of the county.
Data | Crime | Cost of living | Movers
94.5% White · #4 whitest in New York
East Aurora is a village in Erie County, New York, United States, southeast of Buffalo. It lies in the eastern half of the town of Aurora. The village population was 6,236 at the 2010 census. It is part of the Buffalo-Niagara Falls Metropolitan Statistical Area. In 2015, East Aurora was rated the third-best town to raise a family in New York State by Niche.
Data | Crime | Cost of living | Movers
94.5% White · #5 whitest in New York
New Square is an all-Hasidic village in the town of Ramapo, Rockland County, New York, United States. It is located north of Hillcrest, east of Viola, south of New Hempstead, and west of New City. As of the 2010 census, it had a population of 6,944. Its inhabitants are predominantly members of the Skverer Hasidic movement who seek to maintain a Hasidic lifestyle disconnected from the secular world.
Data | Crime | Cost of living | Movers
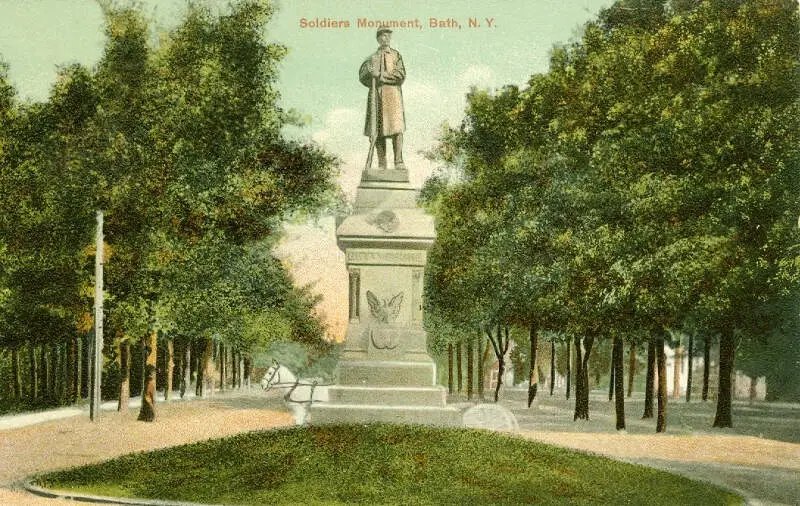
93.6% White · #6 whitest in New York
Bath is a town in Steuben County, New York, United States. The Town of Bath has an area of 96.3 sq mi and a population of 12,097. Its largest settlement is the Village of Bath, which has an area of 2.9 sq mi and a population of 5,641. The Town is located in the central part of the county, northwest of Elmira, New York. The Town are either named after the city in England or after Lady Bath, daughter of a landowner.
Data | Crime | Cost of living | Movers
93.2% White · #7 whitest in New York
Data | Crime | Cost of living | Movers
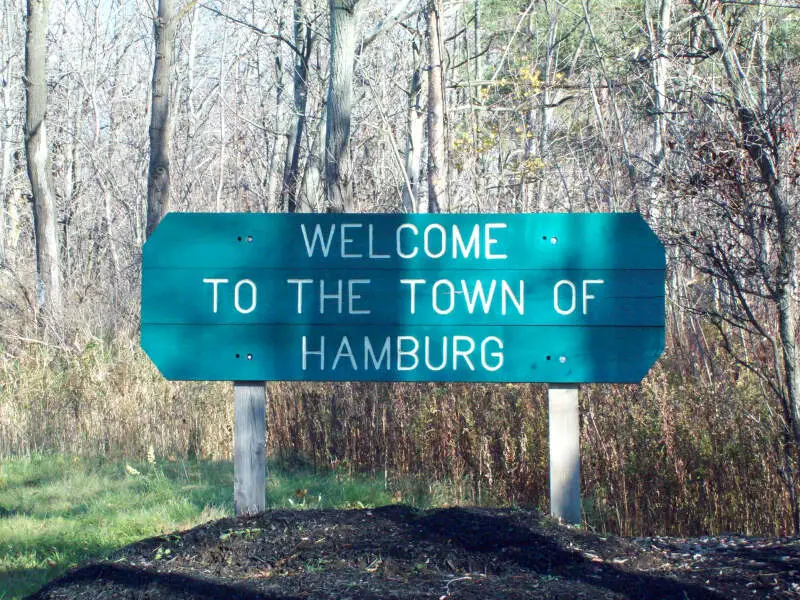
93.2% White · #8 whitest in New York
Hamburg is a town in Erie County, New York, United States. As of the 2010 census, the town had a population of 56,936. It is named after the city of Hamburg, in Germany. The town is on the western border of the county and is south of Buffalo. Hamburg is one of the Southtowns in Erie County. The villages of Hamburg and Blasdell are in the town.
Data | Crime | Cost of living | Movers
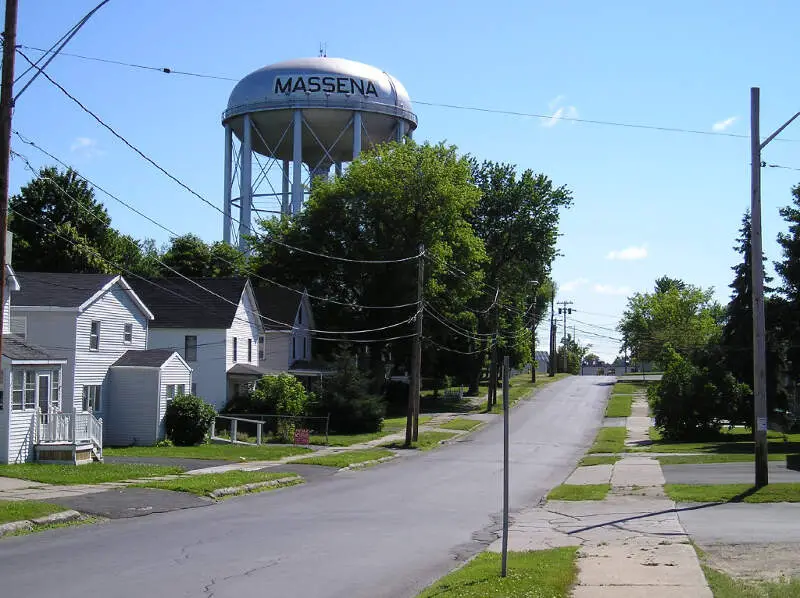
93.1% White · #9 whitest in New York
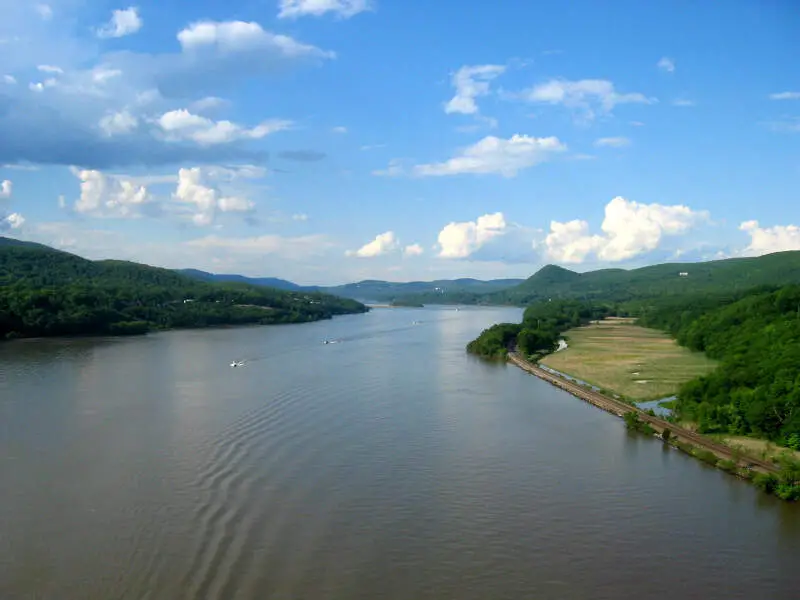
Massena is a town in St. Lawrence County, New York, United States. Massena is located along the northern border of the county, just south of the St. Lawrence River and the Canada-US border. The population was 12,883 at the 2010 census. The town of Massena contains a village also named Massena. The town and its village are named after Andr Massna, a general and Marshal of France during the Napoleonic Wars.
Data | Crime | Cost of living | Movers
93.0% White · #10 whitest in New York
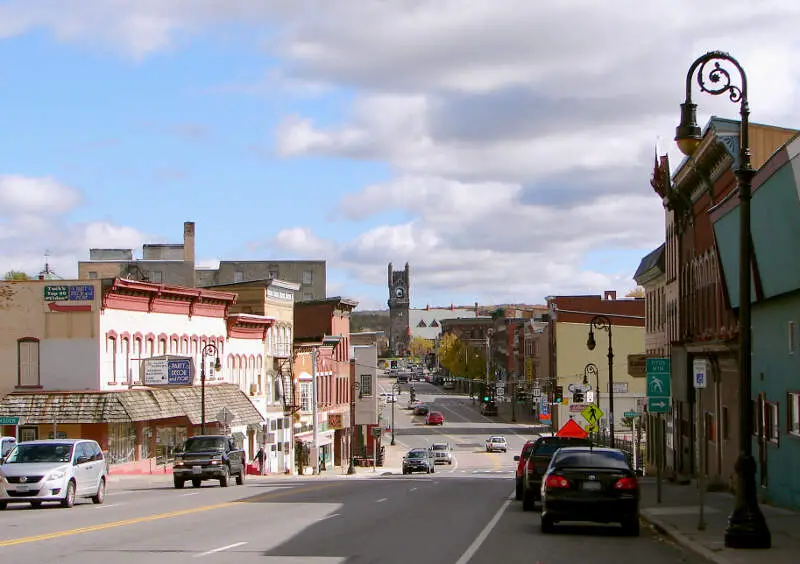
Hudson Falls is a village located in Washington County, New York, USA. The village is in the southwest of the town of Kingsbury, on US Route 4. Hudson Falls is part of the Glens Falls Metropolitan Statistical Area. As of the 2000 census, the village had a population of 6,927. It was the county seat of Washington County until 1994, when the county seat was moved to Fort Edward.
Data | Crime | Cost of living | Movers
The receipts
Compare the top ten
Pick a metric. The bars rescale. The red line is New York’s statewide median.
On the map
Where New York’s White population is concentrated
Saturday Night Science
Methodology: How we determined the whitest places in New York for 2026
To rank the whitest places in New York, we used Saturday Night Science to look at Census demographic data.
We had to look at the number of white people living in each city in New York on a per capita basis. In other words, the percentage of white people living in each city in New York.
We looked at table B03002: Hispanic OR LATINO ORIGIN BY RACE. Here are the category names as defined by the Census:
- Hispanic or Latino
- White alone*
- Black or African American alone*
- American Indian and Alaska Native alone*
- Asian alone*
- Native Hawaiian and Other Pacific Islander alone*
- Some other race alone*
- Two or more races*
Our particular column of interest here was the number of people who identified as White alone.
We limited our analysis to places with a population greater than 5,000 people. That left us with 162 cities.
We then calculated the percentage of residents that are White. The percentages ranked from 96.7% to 4.5%.
Finally, we ranked each city based on the percentage of the White population, with a higher percentage being more White. Lancaster took the distinction of being the most White, while Hempstead was the least White city.
We updated this article for 2026. This report represents our eleventh time ranking the whitest cities in New York.
The full plate
Cities In New York By White Population
Click any column to sort. Search by city name.
| Rank | City | Population | White Population | % White |
|---|---|---|---|---|
| 1 | Lancaster | 10,113 | 9,778 | 96.7% |
| 2 | Kiryas Joel | 38,916 | 37,261 | 95.7% |
| 3 | Malone | 5,429 | 5,191 | 95.6% |
| 4 | East Aurora | 5,993 | 5,664 | 94.5% |
| 5 | New Square | 9,803 | 9,260 | 94.5% |
| 6 | Bath | 5,560 | 5,206 | 93.6% |
| 7 | Lawrence | 6,778 | 6,317 | 93.2% |
| 8 | Hamburg | 9,792 | 9,122 | 93.2% |
| 9 | Massena | 10,238 | 9,528 | 93.1% |
| 10 | Hudson Falls | 7,395 | 6,875 | 93.0% |
| 11 | Fairport | 5,403 | 4,947 | 91.6% |
| 12 | Baldwinsville | 7,715 | 7,031 | 91.1% |
| 13 | Williamsville | 5,469 | 4,975 | 91.0% |
| 14 | Medina | 5,770 | 5,246 | 90.9% |
| 15 | Tonawanda | 15,030 | 13,627 | 90.7% |
| 16 | Oneida | 10,171 | 9,219 | 90.6% |
| 17 | Johnstown | 8,111 | 7,348 | 90.6% |
| 18 | Depew | 15,000 | 13,414 | 89.4% |
| 19 | North Tonawanda | 30,198 | 27,002 | 89.4% |
| 20 | Hornell | 8,152 | 7,283 | 89.3% |
| 21 | Hilton | 5,968 | 5,329 | 89.3% |
| 22 | Fulton | 11,272 | 10,064 | 89.3% |
| 23 | Massapequa Park | 16,963 | 15,126 | 89.2% |
| 24 | Wesley Hills | 6,196 | 5,519 | 89.1% |
| 25 | Corning | 10,643 | 9,468 | 89.0% |
| 26 | Northport | 7,322 | 6,489 | 88.6% |
| 27 | Scotia | 7,264 | 6,426 | 88.5% |
| 28 | Oswego | 17,033 | 15,009 | 88.1% |
| 29 | Ballston Spa | 5,027 | 4,424 | 88.0% |
| 30 | Herkimer | 7,566 | 6,649 | 87.9% |
| 31 | Bayville | 6,744 | 5,919 | 87.8% |
| 32 | Glens Falls | 14,609 | 12,806 | 87.7% |
| 33 | Ogdensburg | 9,455 | 8,247 | 87.2% |
| 34 | Ilion | 7,593 | 6,613 | 87.1% |
| 35 | Larchmont | 6,567 | 5,684 | 86.6% |
| 36 | Horseheads | 6,449 | 5,574 | 86.4% |
| 37 | Canandaigua | 10,514 | 9,037 | 86.0% |
| 38 | Olean | 13,738 | 11,784 | 85.8% |
| 39 | East Rochester | 6,218 | 5,328 | 85.7% |
| 40 | Cortland | 17,450 | 14,922 | 85.5% |
| 41 | Mechanicville | 5,124 | 4,381 | 85.5% |
| 42 | Norwich | 6,782 | 5,798 | 85.5% |
| 43 | Canton | 7,167 | 6,015 | 83.9% |
| 44 | Airmont | 10,205 | 8,538 | 83.7% |
| 45 | Webster | 5,718 | 4,780 | 83.6% |
| 46 | Saratoga Springs | 28,631 | 23,864 | 83.4% |
| 47 | Warwick | 6,585 | 5,479 | 83.2% |
| 48 | Plattsburgh | 19,830 | 16,462 | 83.0% |
| 49 | North Syracuse | 6,693 | 5,543 | 82.8% |
| 50 | Gloversville | 14,962 | 12,391 | 82.8% |
| 51 | Batavia | 15,097 | 12,431 | 82.3% |
| 52 | Babylon | 12,185 | 10,022 | 82.2% |
| 53 | Kenmore | 15,044 | 12,274 | 81.6% |
| 54 | Potsdam | 8,427 | 6,838 | 81.1% |
| 55 | Auburn | 26,285 | 21,327 | 81.1% |
| 56 | Garden City | 22,941 | 18,596 | 81.1% |
| 57 | Rome | 31,795 | 25,757 | 81.0% |
| 58 | Geneseo | 7,701 | 6,238 | 81.0% |
| 59 | Colonie | 7,702 | 6,191 | 80.4% |
| 60 | Solvay | 6,544 | 5,256 | 80.3% |
| 61 | Pleasantville | 7,371 | 5,890 | 79.9% |
| 62 | Oneonta | 15,045 | 12,020 | 79.9% |
| 63 | Hastings-on-Hudson | 8,434 | 6,733 | 79.8% |
| 64 | East Rockaway | 10,077 | 8,022 | 79.6% |
| 65 | Jamestown | 28,188 | 22,374 | 79.4% |
| 66 | Newark | 8,991 | 7,085 | 78.8% |
| 67 | Croton-on-Hudson | 8,202 | 6,456 | 78.7% |
| 68 | Brockport | 7,277 | 5,711 | 78.5% |
| 69 | Port Jefferson | 8,091 | 6,334 | 78.3% |
| 70 | Watertown | 24,375 | 19,076 | 78.3% |
| 71 | Bronxville | 6,510 | 5,094 | 78.2% |
| 72 | Lockport | 20,610 | 16,113 | 78.2% |
| 73 | East Hills | 7,257 | 5,656 | 77.9% |
| 74 | Fredonia | 9,467 | 7,362 | 77.8% |
| 75 | Rockville Centre | 25,765 | 19,843 | 77.0% |
| 76 | Rye | 16,428 | 12,558 | 76.4% |
| 77 | Albion | 5,506 | 4,195 | 76.2% |
| 78 | Cedarhurst | 7,320 | 5,554 | 75.9% |
| 79 | Rye Brook | 9,900 | 7,492 | 75.7% |
| 80 | Chestnut Ridge | 10,557 | 7,896 | 74.8% |
| 81 | Watervliet | 10,287 | 7,663 | 74.5% |
| 82 | Pelham Manor | 5,644 | 4,203 | 74.5% |
| 83 | Cohoes | 18,159 | 13,436 | 74.0% |
| 84 | Farmingdale | 8,474 | 6,196 | 73.1% |
| 85 | Goshen | 5,773 | 4,219 | 73.1% |
| 86 | Amityville | 9,588 | 7,001 | 73.0% |
| 87 | Long Beach | 34,756 | 25,141 | 72.3% |
| 88 | Briarcliff Manor | 7,519 | 5,416 | 72.0% |
| 89 | Lake Grove | 11,061 | 7,899 | 71.4% |
| 90 | Lindenhurst | 27,142 | 19,246 | 70.9% |
| 91 | Irvington | 6,531 | 4,625 | 70.8% |
| 92 | Endicott | 13,387 | 9,346 | 69.8% |
| 93 | Geneva | 12,512 | 8,717 | 69.7% |
| 94 | Elmira | 26,257 | 18,223 | 69.4% |
| 95 | Johnson City | 14,940 | 10,364 | 69.4% |
| 96 | Great Neck | 11,087 | 7,664 | 69.1% |
| 97 | Harrison | 29,961 | 20,338 | 67.9% |
| 98 | Floral Park | 16,169 | 10,920 | 67.5% |
| 99 | Dobbs Ferry | 11,443 | 7,711 | 67.4% |
| 100 | Williston Park | 7,542 | 5,042 | 66.9% |
Source: U.S. Census ACS 2020-2024. 162 cities with more than 5,000 residents.
Summary
Summary: White Populations Across New York
We measured the locations with the highest percentage of white people in New York. According to the most recent data, this list provides accurate information on the whitest places in New York.
The most White cities in New York are Lancaster, Kiryas Joel, Malone, East Aurora, New Square, Bath, Lawrence, Hamburg, Massena, and Hudson Falls. Not sold on New York? Take the two-minute Find Your Place quiz and see which state actually fits you.


