Little Chute, WI
Demographics And Statistics
Living In Little Chute, Wisconsin Summary
Life in Little Chute research summary. HomeSnacks has been using Saturday Night Science to research the quality of life in Little Chute over the past nine years using Census, FBI, Zillow, and other primary data sources. Based on the most recently available data, we found the following about life in Little Chute:
The population in Little Chute is 11,930.
The median home value in Little Chute is $288,667.
The median income in Little Chute is $79,260.
The cost of living in Little Chute is 94 which is 0.9x lower than the national average.
The median rent in Little Chute is $1,141.
The unemployment rate in Little Chute is 1.8%.
The poverty rate in Little Chute is 4.3%.
The average high in Little Chute is 54.9° and the average low is 35.9°.
Table Of Contents
Little Chute SnackAbility
Overall SnackAbility
Little Chute, WI Cost Of Living
Cost of living in Little Chute summary. We use data on the cost of living to determine how expensive it is to live in Little Chute. Real estate prices drive most of the variance in cost of living around Wisconsin. Key points include:
The cost of living in Little Chute is 94 with 100 being average.
The cost of living in Little Chute is 0.9x lower than the national average.
The median home value in Little Chute is $288,667.
The median income in Little Chute is $79,260.
Little Chute's Overall Cost Of Living
Lower Than The National Average
Cost Of Living In Little Chute Comparison Table
| Living Expense | Little Chute | Wisconsin | National Average | |
|---|---|---|---|---|
| Overall | 94 | 95 | 100 | |
| Services | 94 | 98 | 100 | |
| Groceries | 96 | 100 | 100 | |
| Health | 93 | 111 | 100 | |
| Housing | 90 | 88 | 100 | |
| Transportation | 101 | 100 | 100 | |
| Utilities | 99 | 102 | 100 | |
Little Chute, WI Weather
The average high in Little Chute is 54.9° and the average low is 35.9°.
There are 65.9 days of precipitation each year.
Expect an average of 30.7 inches of precipitation each year with 44.8 inches of snow.
| Stat | Little Chute |
|---|---|
| Average Annual High | 54.9 |
| Average Annual Low | 35.9 |
| Annual Precipitation Days | 65.9 |
| Average Annual Precipitation | 30.7 |
| Average Annual Snowfall | 44.8 |
Average High
Days of Rain
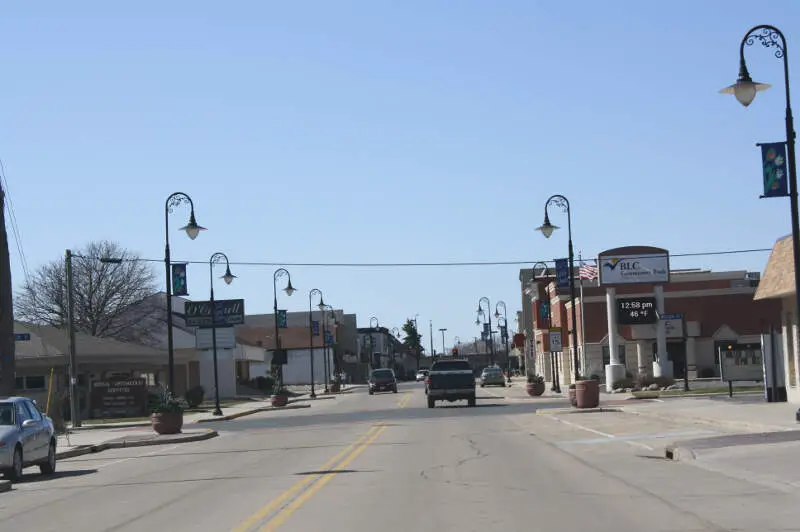
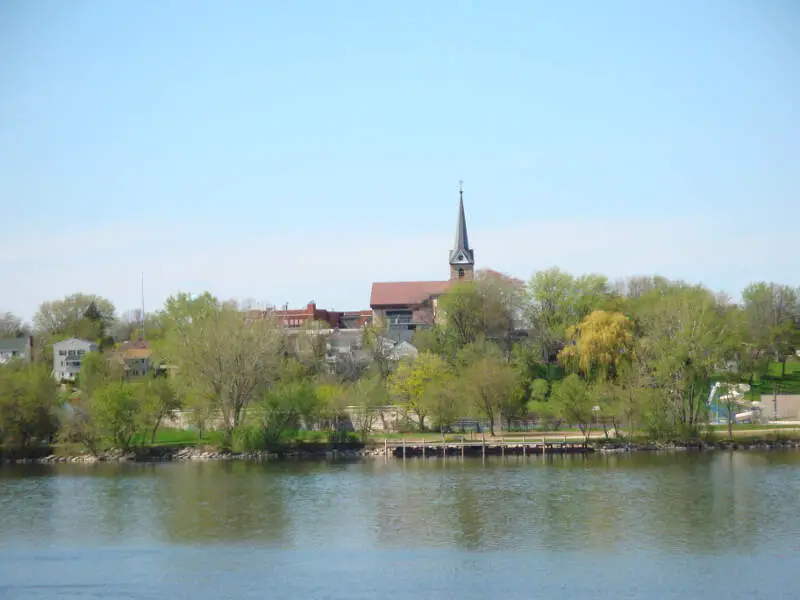
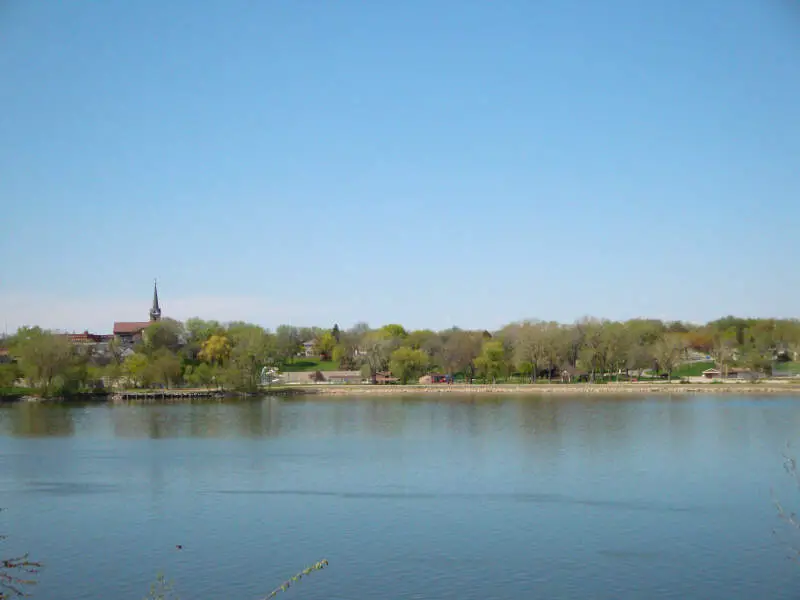
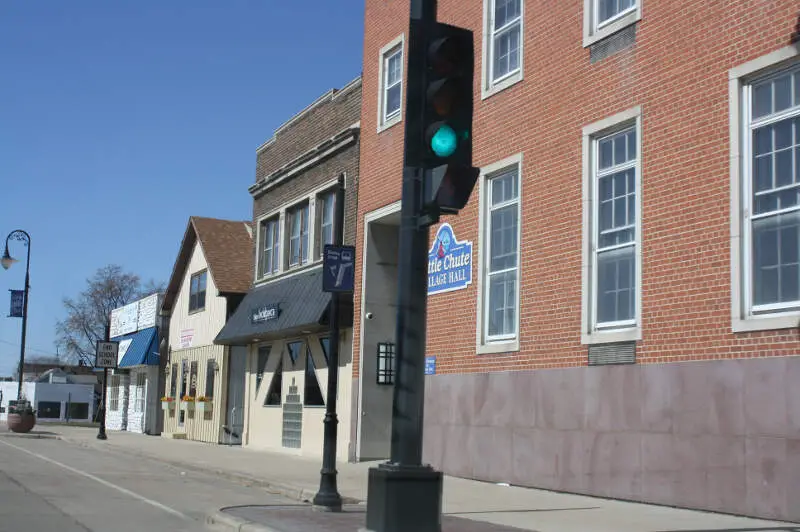
Little Chute, WI Photos


Rankings for Little Chute in Wisconsin


Locations Around Little Chute
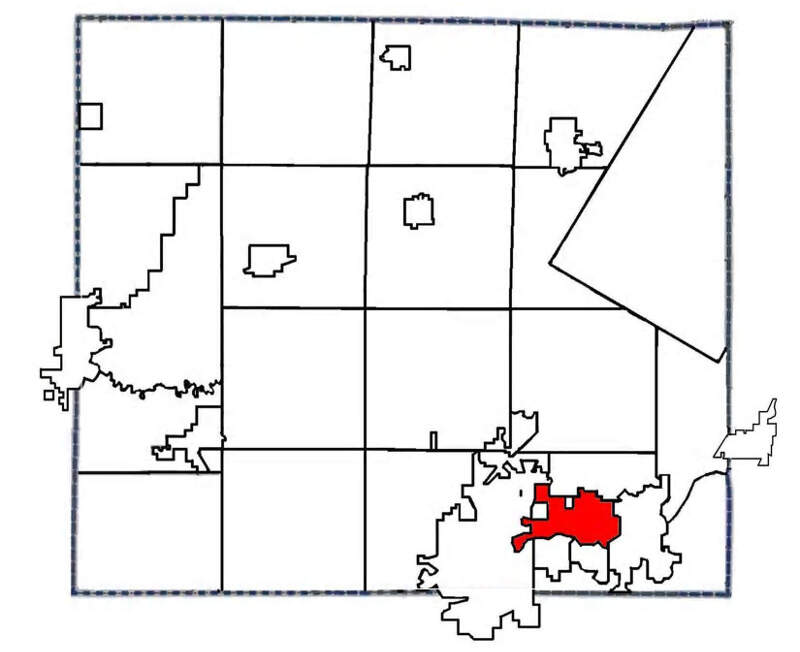
Map Of Little Chute, WI
Best Places Around Little Chute
Allouez, WI
Population 14,023
Hobart, WI
Population 10,418
Hobart, WI
Population 10,418
De Pere, WI
Population 25,368
Menasha, WI
Population 18,130
Kaukauna, WI
Population 17,237
Neenah, WI
Population 27,409
Ashwaubenon, WI
Population 16,931
Kimberly, WI
Population 7,432
Appleton, WI
Population 74,873
Little Chute Demographics And Statistics
Population over time in Little Chute
The current population in Little Chute is 11,930. The population has increased 13.7% from 2010.
| Year | Population | % Change |
|---|---|---|
| 2023 | 11,930 | 1.1% |
| 2022 | 11,798 | 1.3% |
| 2021 | 11,652 | -0.4% |
| 2020 | 11,704 | 1.9% |
| 2019 | 11,484 | 2.3% |
| 2018 | 11,225 | 2.0% |
| 2017 | 11,006 | 1.8% |
| 2016 | 10,815 | 1.6% |
| 2015 | 10,641 | 1.2% |
| 2014 | 10,520 | 0.5% |
| 2013 | 10,471 | 0.2% |
| 2012 | 10,447 | -0.5% |
| 2011 | 10,500 | 0.1% |
| 2010 | 10,493 | - |
Race / Ethnicity in Little Chute
Little Chute is:
89.9% White with 10,720 White residents.
0.9% African American with 104 African American residents.
0.6% American Indian with 72 American Indian residents.
1.2% Asian with 145 Asian residents.
0.0% Hawaiian with 0 Hawaiian residents.
0.1% Other with 13 Other residents.
3.0% Two Or More with 360 Two Or More residents.
4.3% Hispanic with 516 Hispanic residents.
| Race | Little Chute | WI | USA |
|---|---|---|---|
| White | 89.9% | 79.2% | 58.2% |
| African American | 0.9% | 6.0% | 12.0% |
| American Indian | 0.6% | 0.6% | 0.5% |
| Asian | 1.2% | 2.9% | 5.7% |
| Hawaiian | 0.0% | 0.0% | 0.2% |
| Other | 0.1% | 0.3% | 0.5% |
| Two Or More | 3.0% | 3.3% | 3.9% |
| Hispanic | 4.3% | 7.8% | 19.0% |
Gender in Little Chute
Little Chute is 48.8% female with 5,821 female residents.
Little Chute is 51.2% male with 6,108 male residents.
| Gender | Little Chute | WI | USA |
|---|---|---|---|
| Female | 48.8% | 49.9% | 50.5% |
| Male | 51.2% | 50.1% | 49.5% |
Highest level of educational attainment in Little Chute for adults over 25
2.0% of adults in Little Chute completed < 9th grade.
5.0% of adults in Little Chute completed 9-12th grade.
38.0% of adults in Little Chute completed high school / ged.
20.0% of adults in Little Chute completed some college.
10.0% of adults in Little Chute completed associate's degree.
20.0% of adults in Little Chute completed bachelor's degree.
5.0% of adults in Little Chute completed master's degree.
0.0% of adults in Little Chute completed professional degree.
0.0% of adults in Little Chute completed doctorate degree.
| Education | Little Chute | WI | USA |
|---|---|---|---|
| < 9th Grade | 2.0% | 2.0% | 5.0% |
| 9-12th Grade | 5.0% | 4.0% | 6.0% |
| High School / GED | 38.0% | 30.0% | 26.0% |
| Some College | 20.0% | 20.0% | 19.0% |
| Associate's Degree | 10.0% | 11.0% | 9.0% |
| Bachelor's Degree | 20.0% | 22.0% | 21.0% |
| Master's Degree | 5.0% | 8.0% | 10.0% |
| Professional Degree | 0.0% | 2.0% | 2.0% |
| Doctorate Degree | 0.0% | 1.0% | 2.0% |
Household Income For Little Chute, Wisconsin
2.1% of households in Little Chute earn Less than $10,000.
0.2% of households in Little Chute earn $10,000 to $14,999.
6.9% of households in Little Chute earn $15,000 to $24,999.
5.5% of households in Little Chute earn $25,000 to $34,999.
12.2% of households in Little Chute earn $35,000 to $49,999.
20.9% of households in Little Chute earn $50,000 to $74,999.
17.6% of households in Little Chute earn $75,000 to $99,999.
21.8% of households in Little Chute earn $100,000 to $149,999.
6.5% of households in Little Chute earn $150,000 to $199,999.
6.4% of households in Little Chute earn $200,000 or more.
| Income | Little Chute | WI | USA |
|---|---|---|---|
| Less than $10,000 | 2.1% | 4.0% | 4.9% |
| $10,000 to $14,999 | 0.2% | 3.2% | 3.6% |
| $15,000 to $24,999 | 6.9% | 6.2% | 6.6% |
| $25,000 to $34,999 | 5.5% | 7.4% | 6.8% |
| $35,000 to $49,999 | 12.2% | 10.9% | 10.4% |
| $50,000 to $74,999 | 20.9% | 17.8% | 15.7% |
| $75,000 to $99,999 | 17.6% | 14.0% | 12.7% |
| $100,000 to $149,999 | 21.8% | 18.9% | 17.4% |
| $150,000 to $199,999 | 6.5% | 8.9% | 9.3% |
| $200,000 or more | 6.4% | 8.6% | 12.6% |


