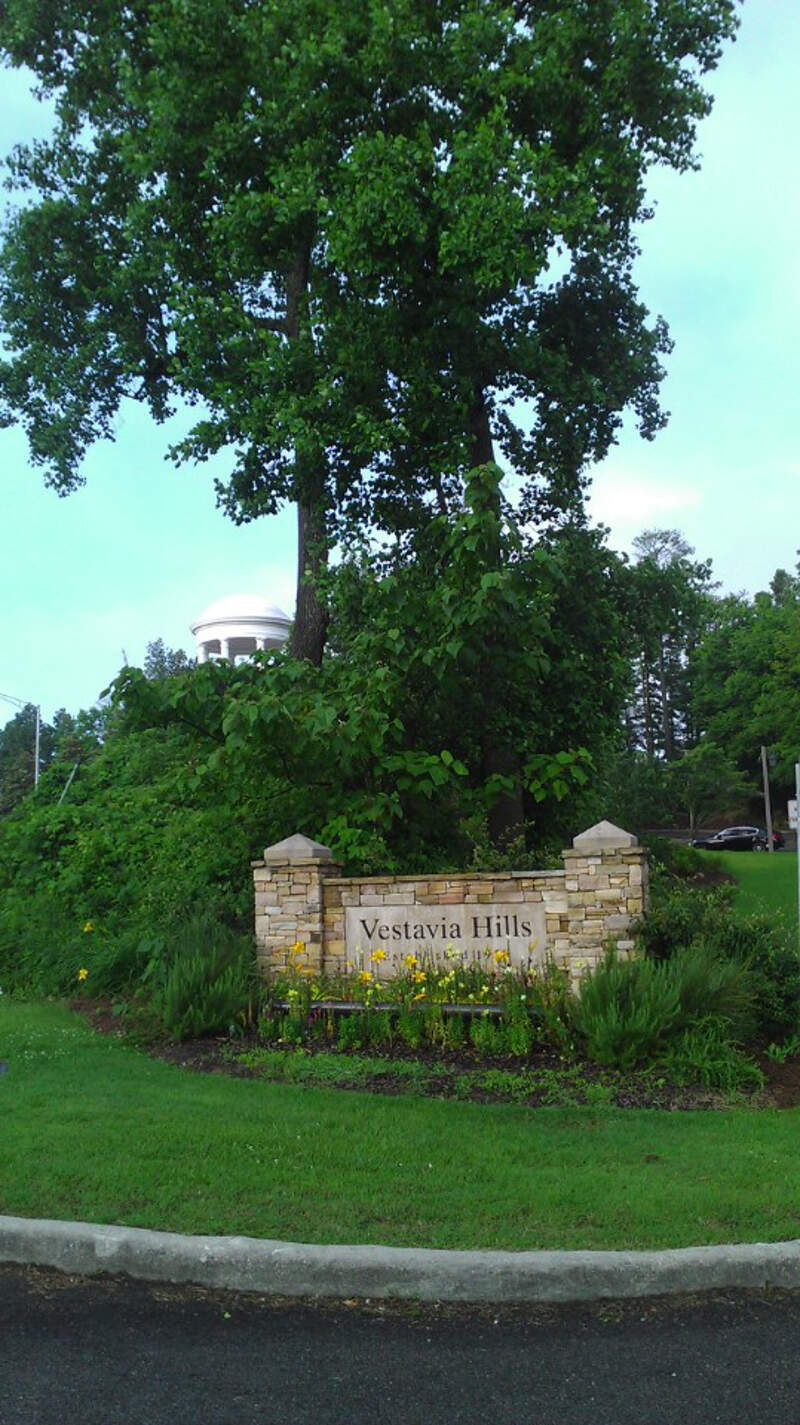
Vestavia Hills, AL
Demographics And Statistics
Living In Vestavia Hills, Alabama Summary
Life in Vestavia Hills research summary. HomeSnacks has been using Saturday Night Science to research the quality of life in Vestavia Hills over the past nine years using Census, FBI, Zillow, and other primary data sources. Based on the most recently available data, we found the following about life in Vestavia Hills:
The population in Vestavia Hills is 38,704.
The median home value in Vestavia Hills is $544,164.
The median income in Vestavia Hills is $129,171.
The cost of living in Vestavia Hills is 126 which is 1.3x higher than the national average.
The median rent in Vestavia Hills is $1,455.
The unemployment rate in Vestavia Hills is 1.7%.
The poverty rate in Vestavia Hills is 9.0%.
The average high in Vestavia Hills is 73.6° and the average low is 51.4°.
Vestavia Hills SnackAbility
Overall SnackAbility
Vestavia Hills, AL Crime Report
Crime in Vestavia Hills summary. We use data from the FBI to determine the crime rates in Vestavia Hills. Key points include:
There were 274 total crimes in Vestavia Hills in the last reporting year.
The overall crime rate per 100,000 people in Vestavia Hills is 727.6 / 100k people.
The violent crime rate per 100,000 people in Vestavia Hills is 82.3 / 100k people.
The property crime rate per 100,000 people in Vestavia Hills is 645.3 / 100k people.
Overall, crime in Vestavia Hills is -65.67% below the national average.
Total Crimes
Below National Average
Crime In Vestavia Hills Comparison Table
| Statistic | Count Raw |
Vestavia Hills / 100k People |
Alabama / 100k People |
National / 100k People |
|---|---|---|---|---|
| Total Crimes Per 100K | 274 | 727.6 | 1,924.9 | 2,119.2 |
| Violent Crime | 31 | 82.3 | 359.9 | 359.0 |
| Murder | 0 | 0.0 | 8.7 | 5.0 |
| Robbery | 0 | 0.0 | 34.0 | 61.0 |
| Aggravated Assault | 25 | 66.4 | 291.4 | 256.0 |
| Property Crime | 243 | 645.3 | 1,565.1 | 1,760.0 |
| Burglary | 24 | 63.7 | 243.5 | 229.0 |
| Larceny | 201 | 533.8 | 1,148.5 | 1,272.0 |
| Car Theft | 18 | 47.8 | 173.0 | 259.0 |
Vestavia Hills, AL Cost Of Living
Cost of living in Vestavia Hills summary. We use data on the cost of living to determine how expensive it is to live in Vestavia Hills. Real estate prices drive most of the variance in cost of living around Alabama. Key points include:
The cost of living in Vestavia Hills is 126 with 100 being average.
The cost of living in Vestavia Hills is 1.3x higher than the national average.
The median home value in Vestavia Hills is $544,164.
The median income in Vestavia Hills is $129,171.
Vestavia Hills's Overall Cost Of Living
Higher Than The National Average
Cost Of Living In Vestavia Hills Comparison Table
| Living Expense | Vestavia Hills | Alabama | National Average | |
|---|---|---|---|---|
| Overall | 126 | 90 | 100 | |
| Services | 99 | 97 | 100 | |
| Groceries | 99 | 98 | 100 | |
| Health | 95 | 86 | 100 | |
| Housing | 186 | 74 | 100 | |
| Transportation | 93 | 93 | 100 | |
| Utilities | 109 | 102 | 100 | |
Vestavia Hills, AL Weather
The average high in Vestavia Hills is 73.6° and the average low is 51.4°.
There are 78.6 days of precipitation each year.
Expect an average of 56.2 inches of precipitation each year with 1.3 inches of snow.
| Stat | Vestavia Hills |
|---|---|
| Average Annual High | 73.6 |
| Average Annual Low | 51.4 |
| Annual Precipitation Days | 78.6 |
| Average Annual Precipitation | 56.2 |
| Average Annual Snowfall | 1.3 |
Average High
Days of Rain
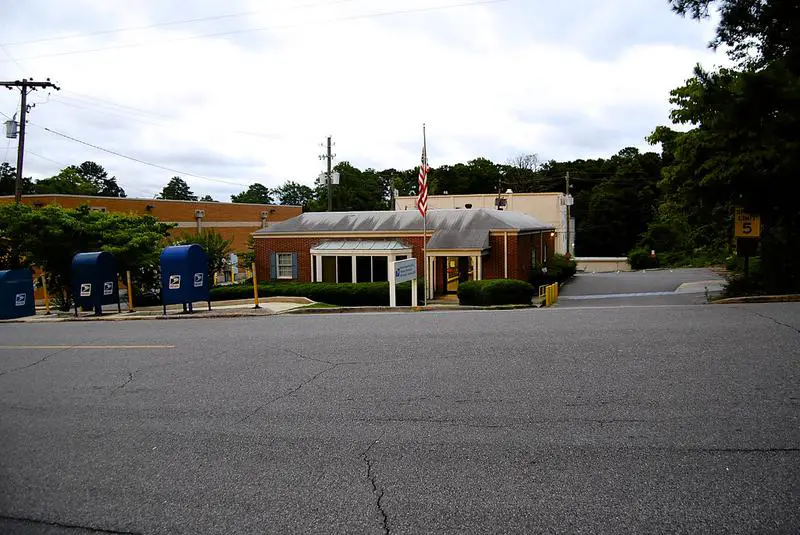
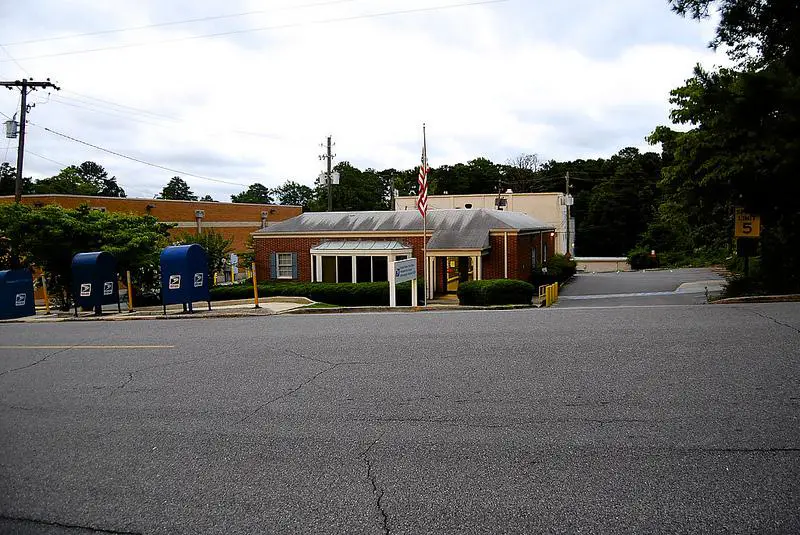
Vestavia Hills, AL Photos

Rankings for Vestavia Hills in Alabama


Locations Around Vestavia Hills
Map Of Vestavia Hills, AL
Best Places Around Vestavia Hills
Bessemer, AL
Population 25,655
Birmingham, AL
Population 199,322
Fairfield, AL
Population 9,846
Irondale, AL
Population 13,462
Moody, AL
Population 13,378
Leeds, AL
Population 12,221
Center Point, AL
Population 16,125
Hueytown, AL
Population 16,541
Trussville, AL
Population 26,182
Chelsea, AL
Population 15,731
Vestavia Hills Demographics And Statistics
Population over time in Vestavia Hills
The current population in Vestavia Hills is 38,704. The population has increased 16.2% from 2010.
| Year | Population | % Change |
|---|---|---|
| 2023 | 38,704 | 0.3% |
| 2022 | 38,600 | 0.2% |
| 2021 | 38,504 | 11.7% |
| 2020 | 34,482 | 0.5% |
| 2019 | 34,307 | 0.4% |
| 2018 | 34,163 | 0.5% |
| 2017 | 34,003 | -0.7% |
| 2016 | 34,243 | 0.4% |
| 2015 | 34,116 | 0.2% |
| 2014 | 34,061 | 0.2% |
| 2013 | 33,993 | 0.5% |
| 2012 | 33,831 | 0.7% |
| 2011 | 33,600 | 0.9% |
| 2010 | 33,305 | - |
Race / Ethnicity in Vestavia Hills
Vestavia Hills is:
83.2% White with 32,207 White residents.
5.8% African American with 2,246 African American residents.
0.1% American Indian with 45 American Indian residents.
5.1% Asian with 1,958 Asian residents.
0.0% Hawaiian with 0 Hawaiian residents.
0.4% Other with 171 Other residents.
1.8% Two Or More with 715 Two Or More residents.
3.5% Hispanic with 1,362 Hispanic residents.
| Race | Vestavia Hills | AL | USA |
|---|---|---|---|
| White | 83.2% | 63.8% | 58.2% |
| African American | 5.8% | 25.9% | 12.0% |
| American Indian | 0.1% | 0.3% | 0.5% |
| Asian | 5.1% | 1.4% | 5.7% |
| Hawaiian | 0.0% | 0.0% | 0.2% |
| Other | 0.4% | 0.3% | 0.5% |
| Two Or More | 1.8% | 2.9% | 3.9% |
| Hispanic | 3.5% | 5.4% | 19.0% |
Gender in Vestavia Hills
Vestavia Hills is 52.5% female with 20,310 female residents.
Vestavia Hills is 47.5% male with 18,394 male residents.
| Gender | Vestavia Hills | AL | USA |
|---|---|---|---|
| Female | 52.5% | 51.5% | 50.5% |
| Male | 47.5% | 48.5% | 49.5% |
Highest level of educational attainment in Vestavia Hills for adults over 25
0.0% of adults in Vestavia Hills completed < 9th grade.
5.0% of adults in Vestavia Hills completed 9-12th grade.
14.0% of adults in Vestavia Hills completed high school / ged.
13.0% of adults in Vestavia Hills completed some college.
5.0% of adults in Vestavia Hills completed associate's degree.
34.0% of adults in Vestavia Hills completed bachelor's degree.
18.0% of adults in Vestavia Hills completed master's degree.
7.0% of adults in Vestavia Hills completed professional degree.
4.0% of adults in Vestavia Hills completed doctorate degree.
| Education | Vestavia Hills | AL | USA |
|---|---|---|---|
| < 9th Grade | 0.0% | 4.0% | 5.0% |
| 9-12th Grade | 5.0% | 8.0% | 6.0% |
| High School / GED | 14.0% | 30.0% | 26.0% |
| Some College | 13.0% | 21.0% | 19.0% |
| Associate's Degree | 5.0% | 9.0% | 9.0% |
| Bachelor's Degree | 34.0% | 17.0% | 21.0% |
| Master's Degree | 18.0% | 8.0% | 10.0% |
| Professional Degree | 7.0% | 2.0% | 2.0% |
| Doctorate Degree | 4.0% | 1.0% | 2.0% |
Household Income For Vestavia Hills, Alabama
2.6% of households in Vestavia Hills earn Less than $10,000.
1.4% of households in Vestavia Hills earn $10,000 to $14,999.
2.1% of households in Vestavia Hills earn $15,000 to $24,999.
4.9% of households in Vestavia Hills earn $25,000 to $34,999.
6.3% of households in Vestavia Hills earn $35,000 to $49,999.
14.2% of households in Vestavia Hills earn $50,000 to $74,999.
8.8% of households in Vestavia Hills earn $75,000 to $99,999.
17.7% of households in Vestavia Hills earn $100,000 to $149,999.
11.9% of households in Vestavia Hills earn $150,000 to $199,999.
30.2% of households in Vestavia Hills earn $200,000 or more.
| Income | Vestavia Hills | AL | USA |
|---|---|---|---|
| Less than $10,000 | 2.6% | 6.3% | 4.9% |
| $10,000 to $14,999 | 1.4% | 5.0% | 3.6% |
| $15,000 to $24,999 | 2.1% | 9.2% | 6.6% |
| $25,000 to $34,999 | 4.9% | 8.7% | 6.8% |
| $35,000 to $49,999 | 6.3% | 12.2% | 10.4% |
| $50,000 to $74,999 | 14.2% | 16.8% | 15.7% |
| $75,000 to $99,999 | 8.8% | 12.5% | 12.7% |
| $100,000 to $149,999 | 17.7% | 15.2% | 17.4% |
| $150,000 to $199,999 | 11.9% | 7.1% | 9.3% |
| $200,000 or more | 30.2% | 7.2% | 12.6% |


