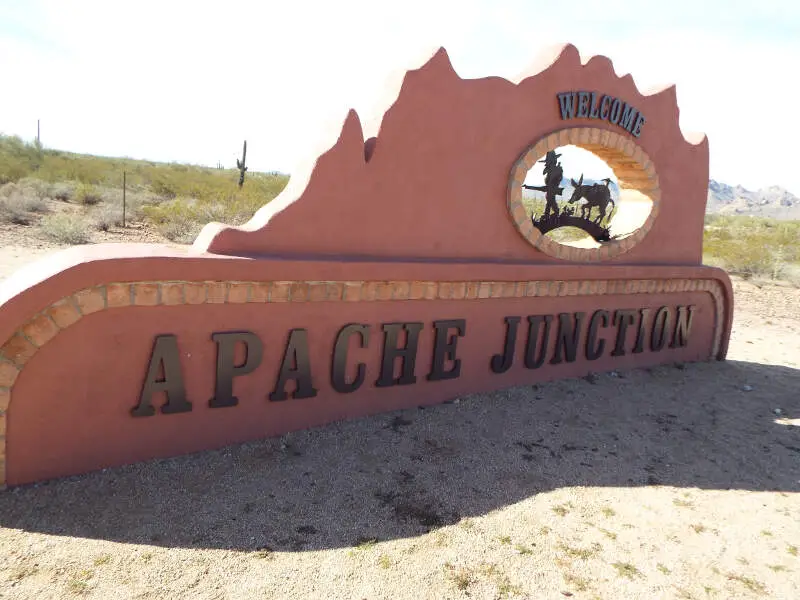
Apache Junction, AZ
Demographics And Statistics
Living In Apache Junction, Arizona Summary
Life in Apache Junction research summary. HomeSnacks has been using Saturday Night Science to research the quality of life in Apache Junction over the past nine years using Census, FBI, Zillow, and other primary data sources. Based on the most recently available data, we found the following about life in Apache Junction:
The population in Apache Junction is 39,746.
The median home value in Apache Junction is $369,232.
The median income in Apache Junction is $58,619.
The cost of living in Apache Junction is 98 which is 1.0x lower than the national average.
The median rent in Apache Junction is $1,019.
The unemployment rate in Apache Junction is 6.2%.
The poverty rate in Apache Junction is 11.0%.
The average high in Apache Junction is 85.1° and the average low is 55.8°.
Apache Junction SnackAbility
Overall SnackAbility
Apache Junction, AZ Crime Report
Crime in Apache Junction summary. We use data from the FBI to determine the crime rates in Apache Junction. Key points include:
There were 814 total crimes in Apache Junction in the last reporting year.
The overall crime rate per 100,000 people in Apache Junction is 1,938.4 / 100k people.
The violent crime rate per 100,000 people in Apache Junction is 426.3 / 100k people.
The property crime rate per 100,000 people in Apache Junction is 1,512.1 / 100k people.
Overall, crime in Apache Junction is -8.53% below the national average.
Total Crimes
Below National Average
Crime In Apache Junction Comparison Table
| Statistic | Count Raw |
Apache Junction / 100k People |
Arizona / 100k People |
National / 100k People |
|---|---|---|---|---|
| Total Crimes Per 100K | 814 | 1,938.4 | 2,214.0 | 2,119.2 |
| Violent Crime | 179 | 426.3 | 421.9 | 359.0 |
| Murder | 1 | 2.4 | 4.9 | 5.0 |
| Robbery | 4 | 9.5 | 64.6 | 61.0 |
| Aggravated Assault | 156 | 371.5 | 312.4 | 256.0 |
| Property Crime | 635 | 1,512.1 | 1,792.1 | 1,760.0 |
| Burglary | 70 | 166.7 | 217.8 | 229.0 |
| Larceny | 465 | 1,107.3 | 1,329.9 | 1,272.0 |
| Car Theft | 100 | 238.1 | 244.4 | 259.0 |
Apache Junction, AZ Cost Of Living
Cost of living in Apache Junction summary. We use data on the cost of living to determine how expensive it is to live in Apache Junction. Real estate prices drive most of the variance in cost of living around Arizona. Key points include:
The cost of living in Apache Junction is 98 with 100 being average.
The cost of living in Apache Junction is 1.0x lower than the national average.
The median home value in Apache Junction is $369,232.
The median income in Apache Junction is $58,619.
Apache Junction's Overall Cost Of Living
Lower Than The National Average
Cost Of Living In Apache Junction Comparison Table
| Living Expense | Apache Junction | Arizona | National Average | |
|---|---|---|---|---|
| Overall | 98 | 102 | 100 | |
| Services | 116 | 102 | 100 | |
| Groceries | 102 | 103 | 100 | |
| Health | 97 | 95 | 100 | |
| Housing | 70 | 99 | 100 | |
| Transportation | 122 | 107 | 100 | |
| Utilities | 98 | 96 | 100 | |
Apache Junction, AZ Weather
The average high in Apache Junction is 85.1° and the average low is 55.8°.
There are 24.0 days of precipitation each year.
Expect an average of 10.6 inches of precipitation each year with 0.7 inches of snow.
| Stat | Apache Junction |
|---|---|
| Average Annual High | 85.1 |
| Average Annual Low | 55.8 |
| Annual Precipitation Days | 24.0 |
| Average Annual Precipitation | 10.6 |
| Average Annual Snowfall | 0.7 |
Average High
Days of Rain
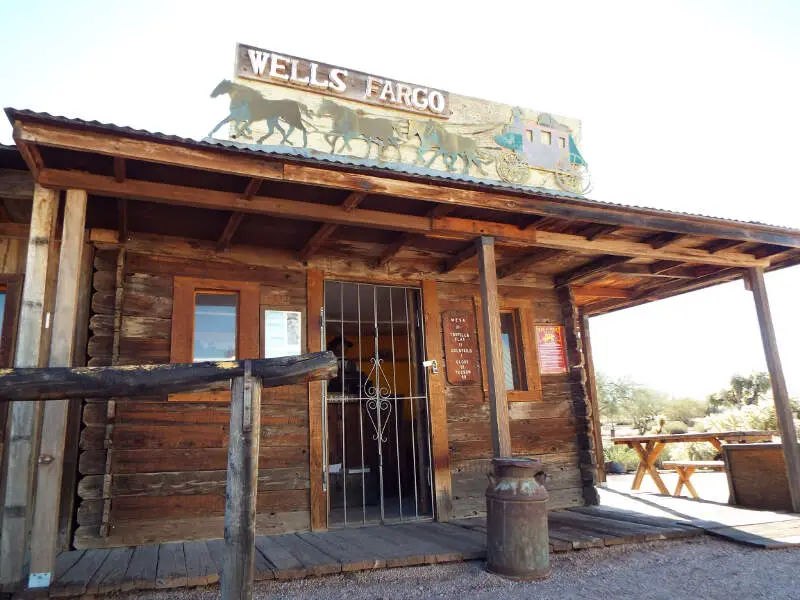
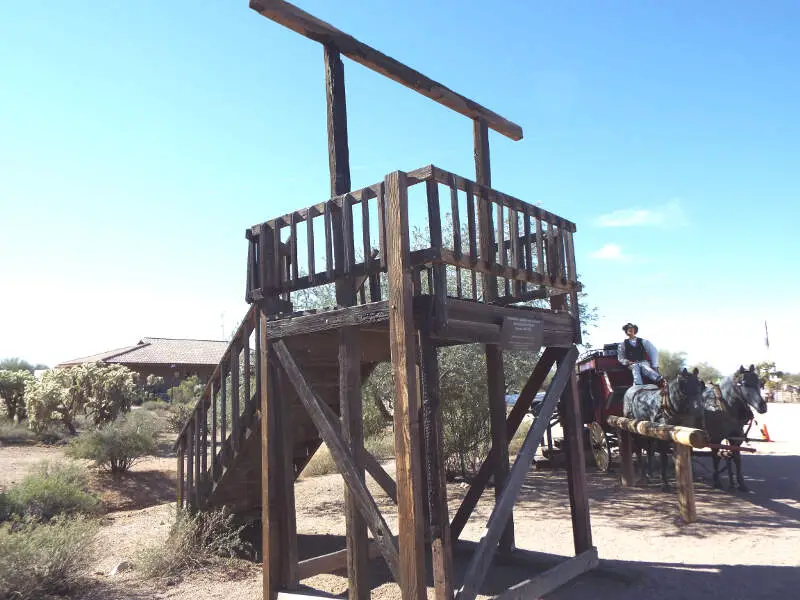
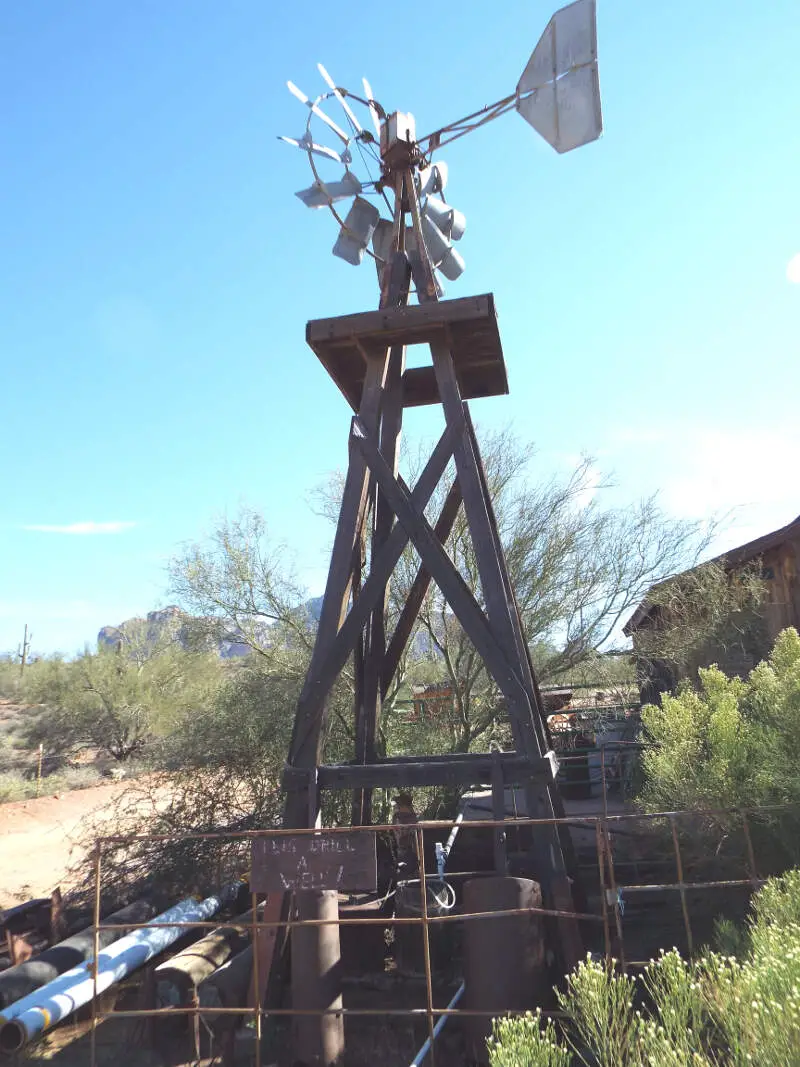
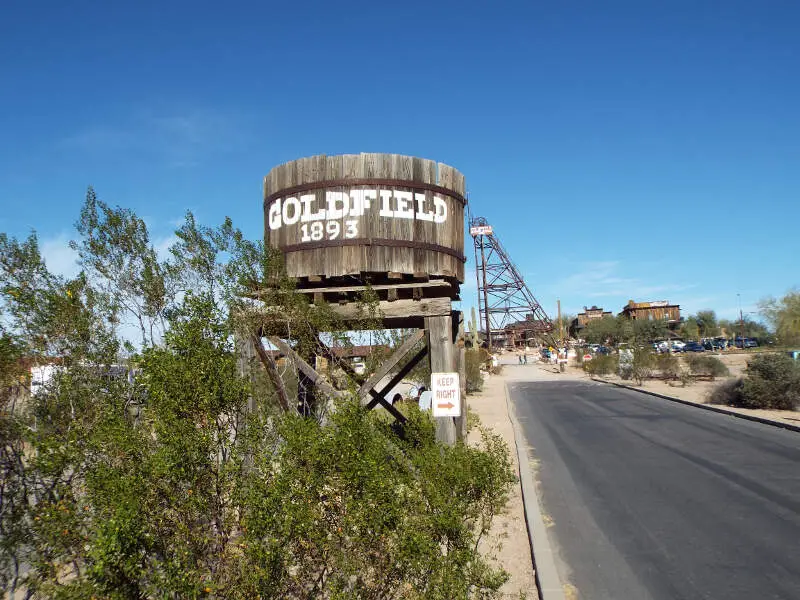
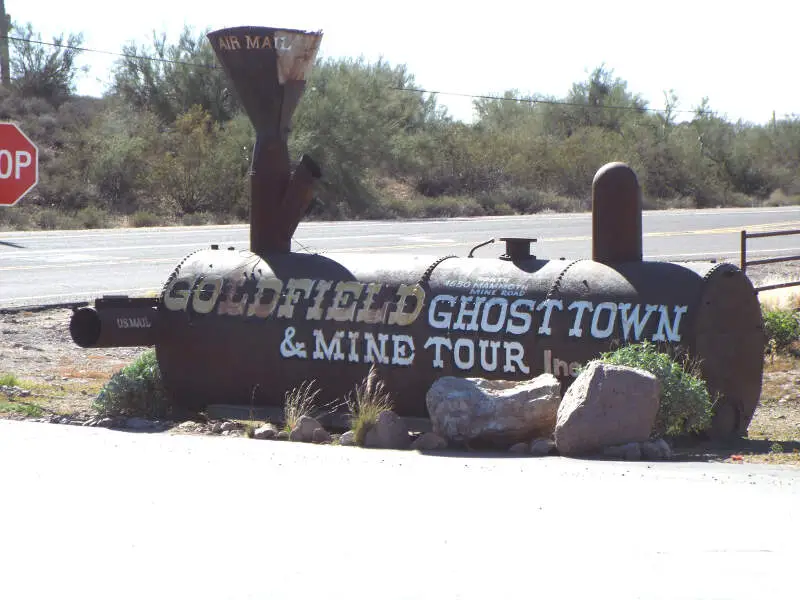
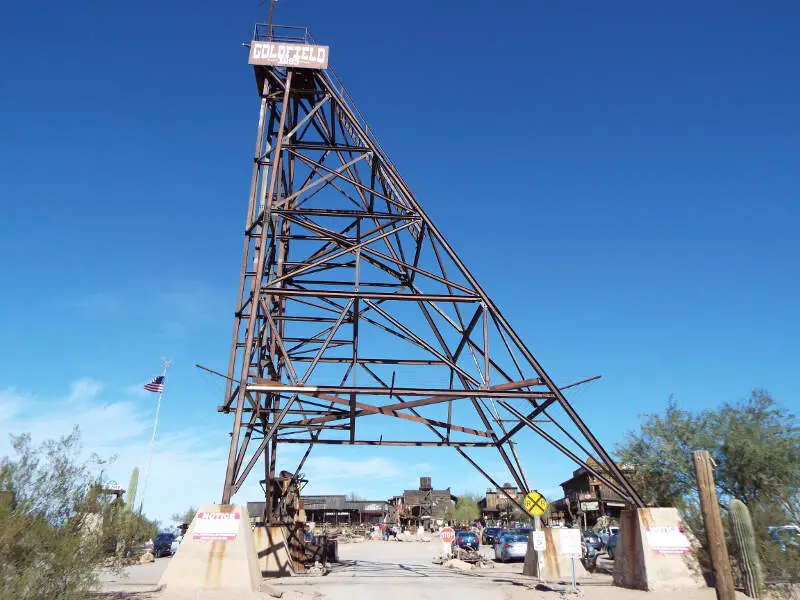
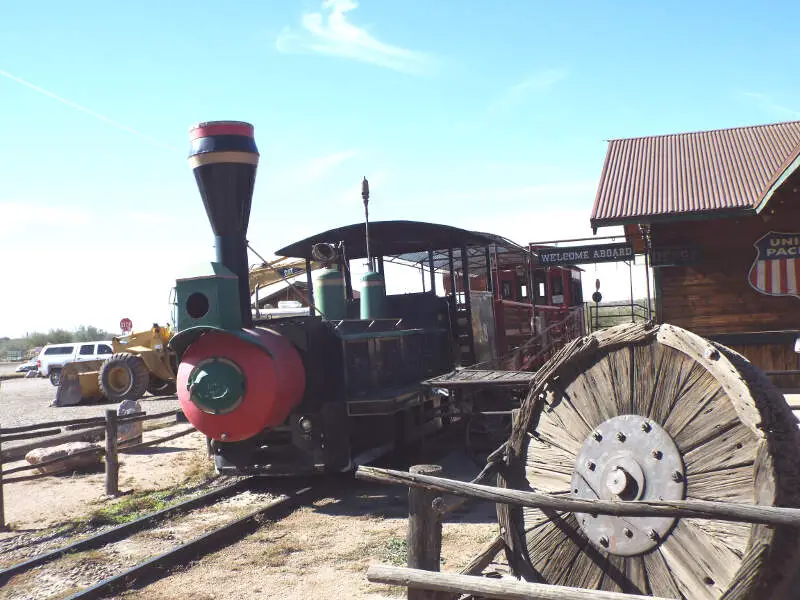
Apache Junction, AZ Photos
1 Reviews & Comments About Apache Junction
/5

HomeSnacks User - 2019-04-16 21:46:51.325568
Cops are on watch alot and am very grateful. You're allowed to have a gun for protection permitting you've no past record. Certain yrs the traffic is horrendous and- If you're a woman - Don't walk after dark anywhere foolishly without reason. Lock your doors at night. My husband is otr every 2 wks. I appreciate the police here. I sleep with my.22 by my bed.
Not alot of things close except malls for shopping.
Rankings for Apache Junction in Arizona


Locations Around Apache Junction
Map Of Apache Junction, AZ
Best Places Around Apache Junction
Gilbert, AZ
Population 271,118
Fountain Hills, AZ
Population 23,768
Queen Creek, AZ
Population 66,369
Gold Canyon, AZ
Population 12,488
Mesa, AZ
Population 507,478
San Tan Valley, AZ
Population 105,231
Apache Junction Demographics And Statistics
Population over time in Apache Junction
The current population in Apache Junction is 39,746. The population has increased 17.1% from 2010.
| Year | Population | % Change |
|---|---|---|
| 2023 | 39,746 | 2.3% |
| 2022 | 38,855 | 1.4% |
| 2021 | 38,311 | -8.5% |
| 2020 | 41,863 | 3.1% |
| 2019 | 40,592 | 2.3% |
| 2018 | 39,674 | 3.2% |
| 2017 | 38,452 | 1.8% |
| 2016 | 37,775 | 3.2% |
| 2015 | 36,586 | -1.0% |
| 2014 | 36,965 | 2.2% |
| 2013 | 36,181 | 1.5% |
| 2012 | 35,663 | 1.6% |
| 2011 | 35,100 | 3.4% |
| 2010 | 33,956 | - |
Race / Ethnicity in Apache Junction
Apache Junction is:
72.8% White with 28,937 White residents.
1.5% African American with 611 African American residents.
0.5% American Indian with 189 American Indian residents.
1.6% Asian with 628 Asian residents.
0.0% Hawaiian with 16 Hawaiian residents.
0.1% Other with 53 Other residents.
4.9% Two Or More with 1,955 Two Or More residents.
18.5% Hispanic with 7,357 Hispanic residents.
| Race | Apache Junction | AZ | USA |
|---|---|---|---|
| White | 72.8% | 53.4% | 58.2% |
| African American | 1.5% | 4.4% | 12.0% |
| American Indian | 0.5% | 3.4% | 0.5% |
| Asian | 1.6% | 3.3% | 5.7% |
| Hawaiian | 0.0% | 0.2% | 0.2% |
| Other | 0.1% | 0.4% | 0.5% |
| Two Or More | 4.9% | 3.9% | 3.9% |
| Hispanic | 18.5% | 31.0% | 19.0% |
Gender in Apache Junction
Apache Junction is 49.5% female with 19,668 female residents.
Apache Junction is 50.5% male with 20,078 male residents.
| Gender | Apache Junction | AZ | USA |
|---|---|---|---|
| Female | 49.5% | 50.1% | 50.5% |
| Male | 50.5% | 49.9% | 49.5% |
Highest level of educational attainment in Apache Junction for adults over 25
5.0% of adults in Apache Junction completed < 9th grade.
8.0% of adults in Apache Junction completed 9-12th grade.
34.0% of adults in Apache Junction completed high school / ged.
26.0% of adults in Apache Junction completed some college.
10.0% of adults in Apache Junction completed associate's degree.
11.0% of adults in Apache Junction completed bachelor's degree.
6.0% of adults in Apache Junction completed master's degree.
0.0% of adults in Apache Junction completed professional degree.
0.0% of adults in Apache Junction completed doctorate degree.
| Education | Apache Junction | AZ | USA |
|---|---|---|---|
| < 9th Grade | 5.0% | 6.0% | 5.0% |
| 9-12th Grade | 8.0% | 6.0% | 6.0% |
| High School / GED | 34.0% | 23.0% | 26.0% |
| Some College | 26.0% | 24.0% | 19.0% |
| Associate's Degree | 10.0% | 9.0% | 9.0% |
| Bachelor's Degree | 11.0% | 20.0% | 21.0% |
| Master's Degree | 6.0% | 9.0% | 10.0% |
| Professional Degree | 0.0% | 2.0% | 2.0% |
| Doctorate Degree | 0.0% | 1.0% | 2.0% |
Household Income For Apache Junction, Arizona
4.3% of households in Apache Junction earn Less than $10,000.
4.6% of households in Apache Junction earn $10,000 to $14,999.
8.9% of households in Apache Junction earn $15,000 to $24,999.
11.7% of households in Apache Junction earn $25,000 to $34,999.
13.5% of households in Apache Junction earn $35,000 to $49,999.
18.5% of households in Apache Junction earn $50,000 to $74,999.
13.9% of households in Apache Junction earn $75,000 to $99,999.
14.8% of households in Apache Junction earn $100,000 to $149,999.
5.4% of households in Apache Junction earn $150,000 to $199,999.
4.2% of households in Apache Junction earn $200,000 or more.
| Income | Apache Junction | AZ | USA |
|---|---|---|---|
| Less than $10,000 | 4.3% | 4.9% | 4.9% |
| $10,000 to $14,999 | 4.6% | 2.9% | 3.6% |
| $15,000 to $24,999 | 8.9% | 6.1% | 6.6% |
| $25,000 to $34,999 | 11.7% | 6.9% | 6.8% |
| $35,000 to $49,999 | 13.5% | 10.9% | 10.4% |
| $50,000 to $74,999 | 18.5% | 17.0% | 15.7% |
| $75,000 to $99,999 | 13.9% | 13.6% | 12.7% |
| $100,000 to $149,999 | 14.8% | 18.1% | 17.4% |
| $150,000 to $199,999 | 5.4% | 9.0% | 9.3% |
| $200,000 or more | 4.2% | 10.6% | 12.6% |


