Litchfield Park, AZ
Demographics And Statistics
Living In Litchfield Park, Arizona Summary
Life in Litchfield Park research summary. HomeSnacks has been using Saturday Night Science to research the quality of life in Litchfield Park over the past nine years using Census, FBI, Zillow, and other primary data sources. Based on the most recently available data, we found the following about life in Litchfield Park:
The population in Litchfield Park is 6,871.
The median home value in Litchfield Park is $526,015.
The median income in Litchfield Park is $124,973.
The cost of living in Litchfield Park is 128 which is 1.3x higher than the national average.
The median rent in Litchfield Park is $2,230.
The unemployment rate in Litchfield Park is 3.1%.
The poverty rate in Litchfield Park is 4.0%.
The average high in Litchfield Park is 85.8° and the average low is 58.1°.
Table Of Contents
Litchfield Park SnackAbility
Overall SnackAbility
Litchfield Park, AZ Cost Of Living
Cost of living in Litchfield Park summary. We use data on the cost of living to determine how expensive it is to live in Litchfield Park. Real estate prices drive most of the variance in cost of living around Arizona. Key points include:
The cost of living in Litchfield Park is 128 with 100 being average.
The cost of living in Litchfield Park is 1.3x higher than the national average.
The median home value in Litchfield Park is $526,015.
The median income in Litchfield Park is $124,973.
Litchfield Park's Overall Cost Of Living
Higher Than The National Average
Cost Of Living In Litchfield Park Comparison Table
| Living Expense | Litchfield Park | Arizona | National Average | |
|---|---|---|---|---|
| Overall | 128 | 102 | 100 | |
| Services | 104 | 102 | 100 | |
| Groceries | 99 | 103 | 100 | |
| Health | 87 | 95 | 100 | |
| Housing | 188 | 99 | 100 | |
| Transportation | 93 | 107 | 100 | |
| Utilities | 125 | 96 | 100 | |
Litchfield Park, AZ Weather
The average high in Litchfield Park is 85.8° and the average low is 58.1°.
There are 20.6 days of precipitation each year.
Expect an average of 9.3 inches of precipitation each year with 0.0 inches of snow.
| Stat | Litchfield Park |
|---|---|
| Average Annual High | 85.8 |
| Average Annual Low | 58.1 |
| Annual Precipitation Days | 20.6 |
| Average Annual Precipitation | 9.3 |
| Average Annual Snowfall | 0.0 |
Average High
Days of Rain
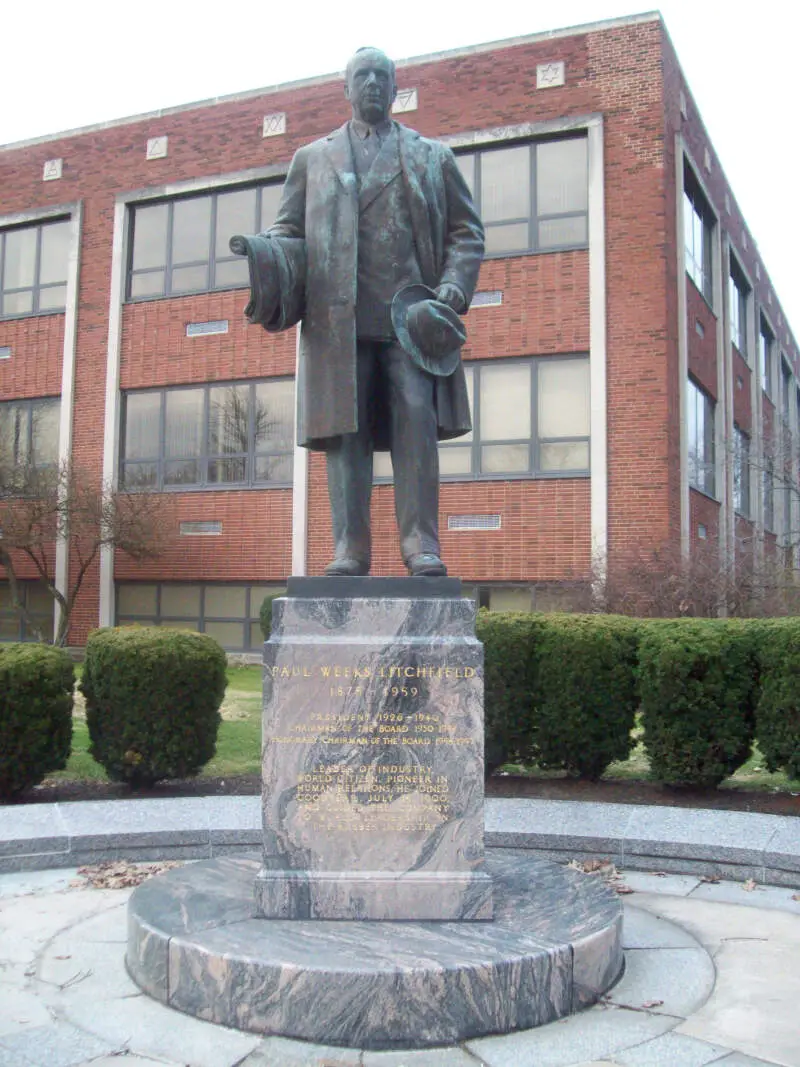
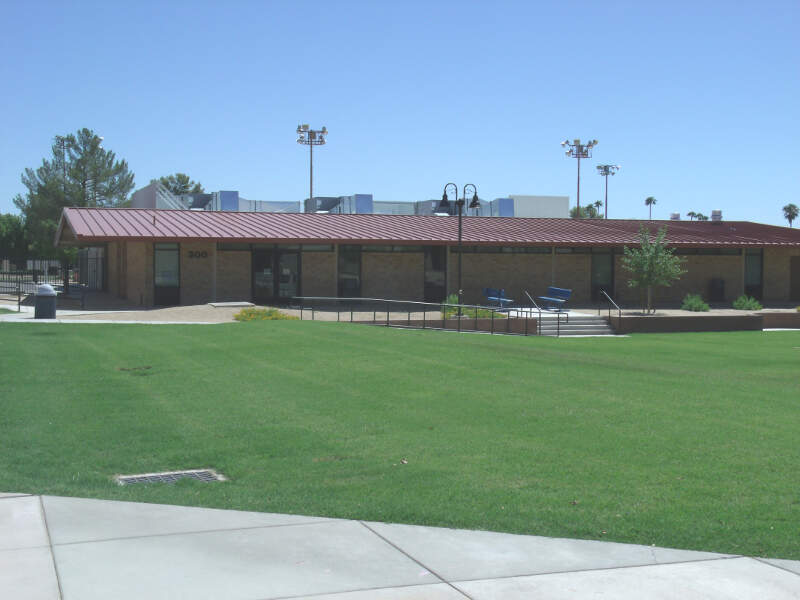
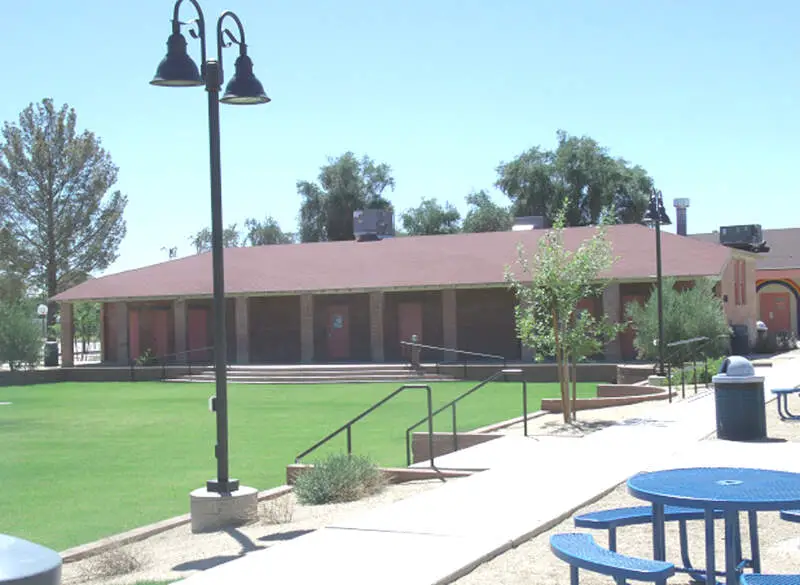
Litchfield Park, AZ Photos
Rankings for Litchfield Park in Arizona


Locations Around Litchfield Park
Map Of Litchfield Park, AZ
Best Places Around Litchfield Park
Peoria, AZ
Population 194,338
Surprise, AZ
Population 149,519
Glendale, AZ
Population 250,193
Goodyear, AZ
Population 102,891
Phoenix, AZ
Population 1,624,832
Avondale, AZ
Population 90,644
El Mirage, AZ
Population 35,823
Tolleson, AZ
Population 7,233
Litchfield Park Demographics And Statistics
Population over time in Litchfield Park
The current population in Litchfield Park is 6,871. The population has increased 30.4% from 2010.
| Year | Population | % Change |
|---|---|---|
| 2023 | 6,871 | 1.1% |
| 2022 | 6,794 | 2.1% |
| 2021 | 6,656 | 6.9% |
| 2020 | 6,228 | 2.6% |
| 2019 | 6,073 | 2.9% |
| 2018 | 5,899 | 3.7% |
| 2017 | 5,686 | 4.3% |
| 2016 | 5,449 | 3.7% |
| 2015 | 5,253 | 2.6% |
| 2014 | 5,122 | -0.4% |
| 2013 | 5,144 | -0.6% |
| 2012 | 5,173 | -4.0% |
| 2011 | 5,389 | 2.2% |
| 2010 | 5,271 | - |
Race / Ethnicity in Litchfield Park
Litchfield Park is:
65.1% White with 4,474 White residents.
2.0% African American with 136 African American residents.
0.1% American Indian with 6 American Indian residents.
6.7% Asian with 462 Asian residents.
0.4% Hawaiian with 25 Hawaiian residents.
0.8% Other with 57 Other residents.
3.9% Two Or More with 268 Two Or More residents.
21.0% Hispanic with 1,443 Hispanic residents.
| Race | Litchfield Park | AZ | USA |
|---|---|---|---|
| White | 65.1% | 53.4% | 58.2% |
| African American | 2.0% | 4.4% | 12.0% |
| American Indian | 0.1% | 3.4% | 0.5% |
| Asian | 6.7% | 3.3% | 5.7% |
| Hawaiian | 0.4% | 0.2% | 0.2% |
| Other | 0.8% | 0.4% | 0.5% |
| Two Or More | 3.9% | 3.9% | 3.9% |
| Hispanic | 21.0% | 31.0% | 19.0% |
Gender in Litchfield Park
Litchfield Park is 50.3% female with 3,454 female residents.
Litchfield Park is 49.7% male with 3,416 male residents.
| Gender | Litchfield Park | AZ | USA |
|---|---|---|---|
| Female | 50.3% | 50.1% | 50.5% |
| Male | 49.7% | 49.9% | 49.5% |
Highest level of educational attainment in Litchfield Park for adults over 25
2.0% of adults in Litchfield Park completed < 9th grade.
1.0% of adults in Litchfield Park completed 9-12th grade.
17.0% of adults in Litchfield Park completed high school / ged.
21.0% of adults in Litchfield Park completed some college.
8.0% of adults in Litchfield Park completed associate's degree.
29.0% of adults in Litchfield Park completed bachelor's degree.
18.0% of adults in Litchfield Park completed master's degree.
3.0% of adults in Litchfield Park completed professional degree.
1.0% of adults in Litchfield Park completed doctorate degree.
| Education | Litchfield Park | AZ | USA |
|---|---|---|---|
| < 9th Grade | 2.0% | 6.0% | 5.0% |
| 9-12th Grade | 1.0% | 6.0% | 6.0% |
| High School / GED | 17.0% | 23.0% | 26.0% |
| Some College | 21.0% | 24.0% | 19.0% |
| Associate's Degree | 8.0% | 9.0% | 9.0% |
| Bachelor's Degree | 29.0% | 20.0% | 21.0% |
| Master's Degree | 18.0% | 9.0% | 10.0% |
| Professional Degree | 3.0% | 2.0% | 2.0% |
| Doctorate Degree | 1.0% | 1.0% | 2.0% |
Household Income For Litchfield Park, Arizona
2.7% of households in Litchfield Park earn Less than $10,000.
3.3% of households in Litchfield Park earn $10,000 to $14,999.
1.3% of households in Litchfield Park earn $15,000 to $24,999.
3.6% of households in Litchfield Park earn $25,000 to $34,999.
4.9% of households in Litchfield Park earn $35,000 to $49,999.
16.9% of households in Litchfield Park earn $50,000 to $74,999.
7.1% of households in Litchfield Park earn $75,000 to $99,999.
22.3% of households in Litchfield Park earn $100,000 to $149,999.
15.3% of households in Litchfield Park earn $150,000 to $199,999.
22.5% of households in Litchfield Park earn $200,000 or more.
| Income | Litchfield Park | AZ | USA |
|---|---|---|---|
| Less than $10,000 | 2.7% | 4.9% | 4.9% |
| $10,000 to $14,999 | 3.3% | 2.9% | 3.6% |
| $15,000 to $24,999 | 1.3% | 6.1% | 6.6% |
| $25,000 to $34,999 | 3.6% | 6.9% | 6.8% |
| $35,000 to $49,999 | 4.9% | 10.9% | 10.4% |
| $50,000 to $74,999 | 16.9% | 17.0% | 15.7% |
| $75,000 to $99,999 | 7.1% | 13.6% | 12.7% |
| $100,000 to $149,999 | 22.3% | 18.1% | 17.4% |
| $150,000 to $199,999 | 15.3% | 9.0% | 9.3% |
| $200,000 or more | 22.5% | 10.6% | 12.6% |


