
Are you looking for love in Minnesota?
Or are you just hoping to hook up with a hot Minnesotan?
Either way, we’ve got you covered here.
If you live in Minnesota, there’s a pretty good chance there are a lot of singles in your area. The North Star State has plenty of people over 18 who aren’t married or in a serious relationship.
That’s great news for people who are single and looking to mingle.
So, where are the best cities for singles in Minnesota? We used Saturday Night Science to find out.
Table Of Contents: Top Ten | Methodology | Summary | Table
The 10 Best Cities For Singles In Minnesota For 2026
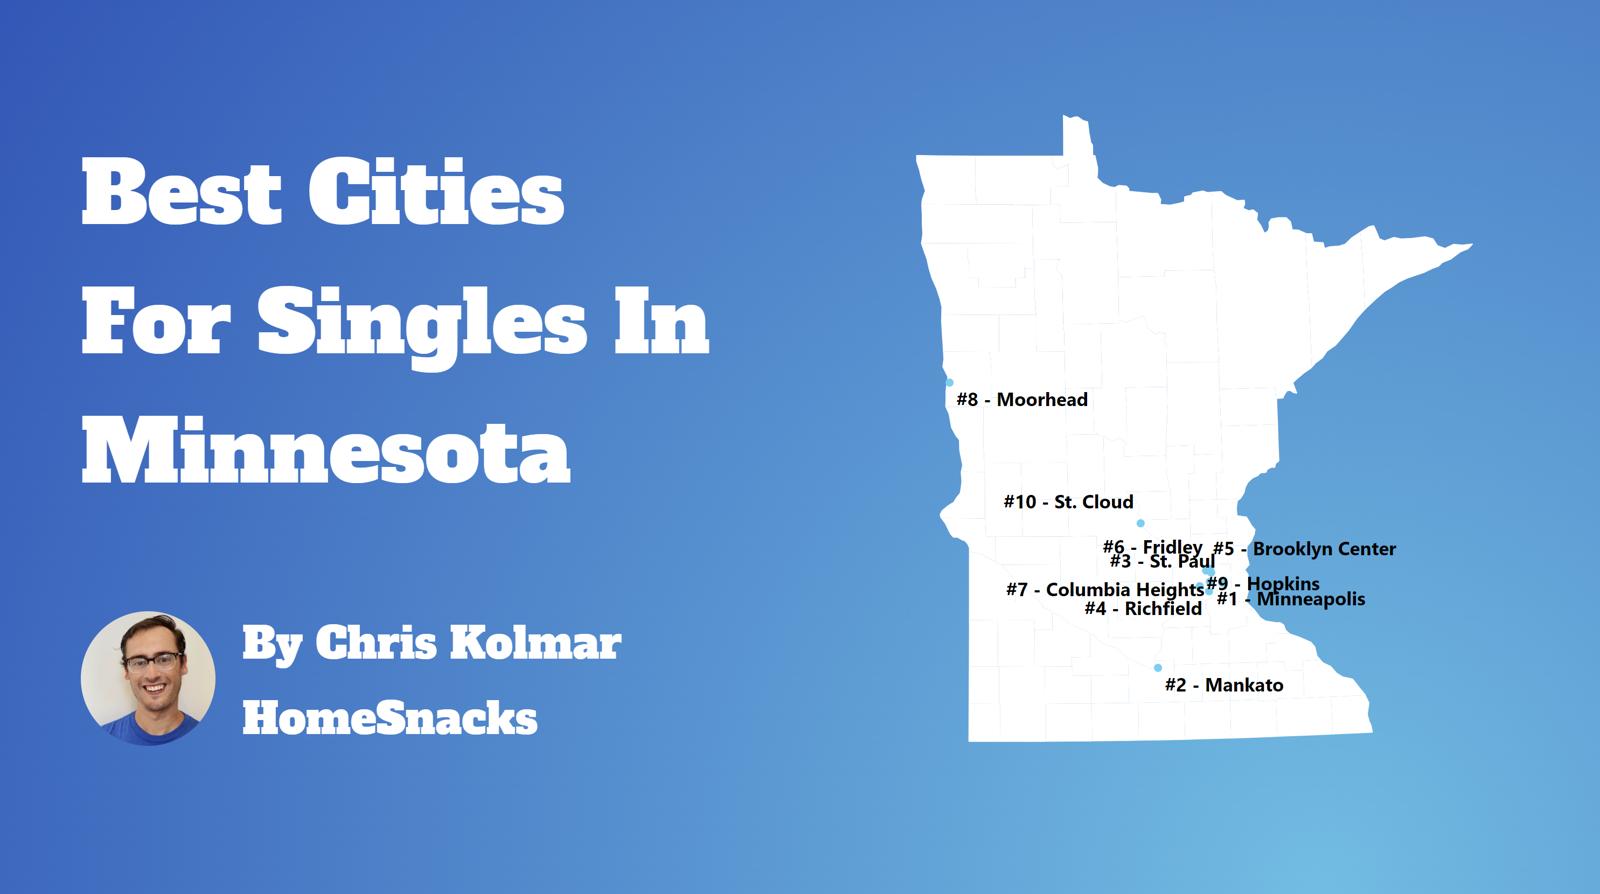
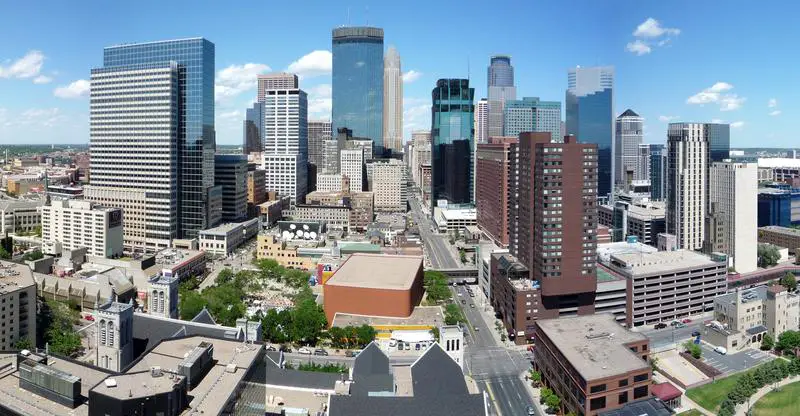
So, what was the best city for singles in Minnesota? Minneapolis ranks as the best place for singles in Minnesota if you care about things singles care about, like nightlife, affordable housing, and other singles.
Read below to see how we crunched the numbers and how each city ranked. If you live in or are close to one of these cities and are single, you should probably get out more often.
Just saying.
For more Minnesota reading, check out:
- Best Places To Live In Minnesota
- Cheapest Places To Live In Minnesota
- Most Dangerous Cities In Minnesota
The 10 Best Cities For Singles In Minnesota For 2026

/10
Population: 427,246
Median Age: 33.4
Married households: 14.0%
Households with kids: 20.6%
More on Minneapolis: Data | Crime | Cost Of Living | Movers

Minneapolis was great for big-city amenities with midwestern charm. I loved the green ways throughout the city for running and biking as well as the metro that was able to get to activities downtown. It was a great place for young professionals and graduate students.
My favorite places were downtown in between concerts, stadiums, restaurants, festivals, and food markets. The ease of getting around without a car if you lived around the green line stood out for me.

/10
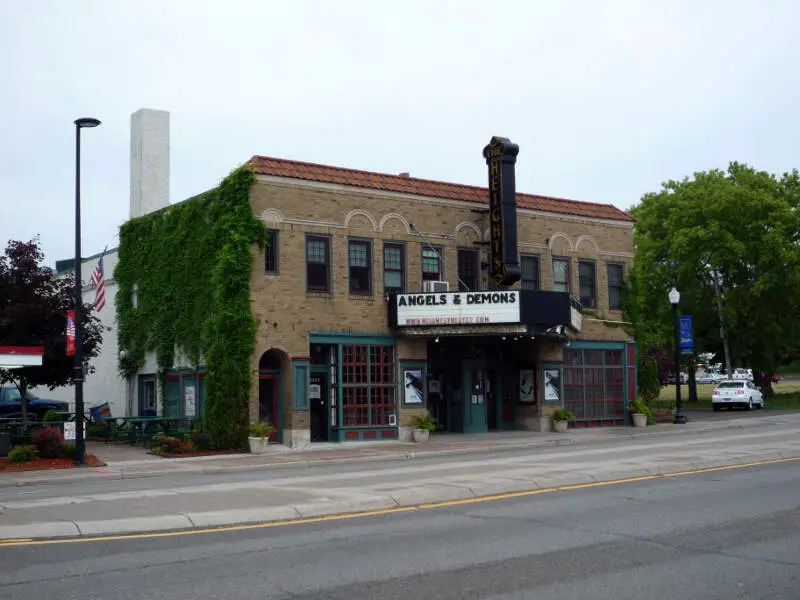
Population: 22,155
Median Age: 36.8
Married households: 17.0%
Households with kids: 26.1%
More on Columbia Heights: Data | Crime | Cost Of Living | Movers

/10
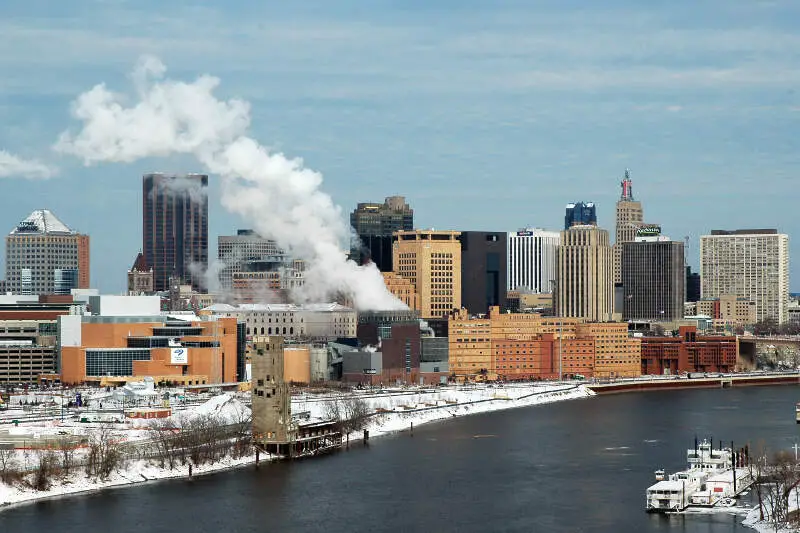
Population: 307,284
Median Age: 33.7
Married households: 15.0%
Households with kids: 26.3%
More on St. Paul: Data | Crime | Cost Of Living | Movers
The weather s***s! It’s now May, and we have snow up north-! Winters are freezing cold, summers are super hot with mosquitoes, the State bird! Taxes are ridiculous and the roads have potholes the size of Texas!
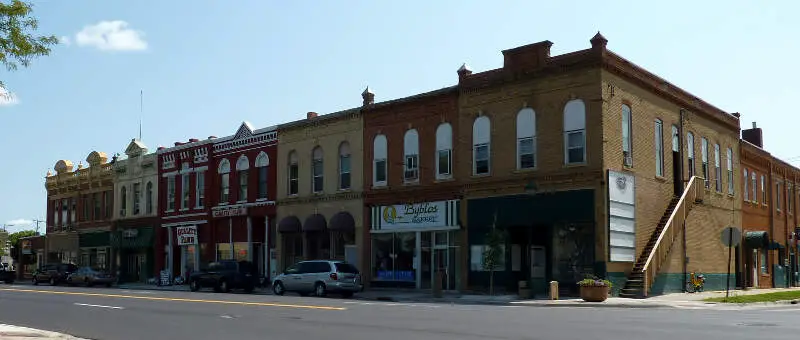
Stillwater is a beautiful city on the river, with lots of cute shops and restaurants, which is worth your trip!

/10
Population: 45,473
Median Age: 26.5
Married households: 21.0%
Households with kids: 21.9%
More on Mankato: Data | Crime | Cost Of Living | Movers

/10
Population: 36,642
Median Age: 39.4
Married households: 23.0%
Households with kids: 22.1%
More on Richfield: Data | Crime | Cost Of Living | Movers

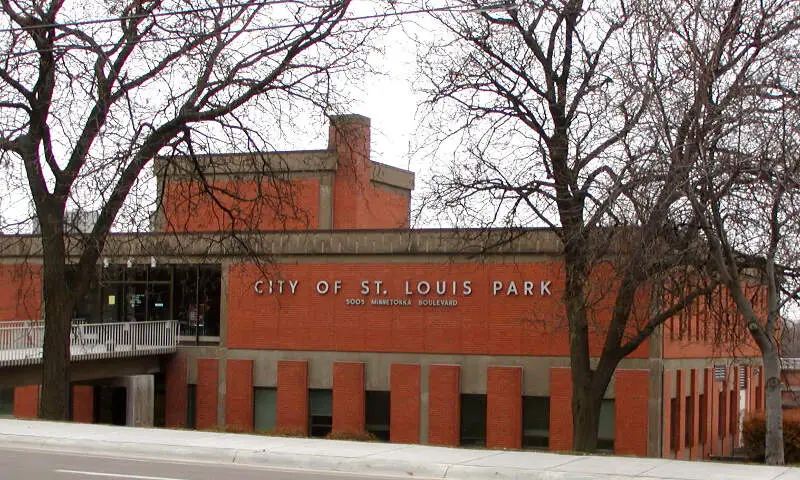
/10
Population: 49,594
Median Age: 36.1
Married households: 22.0%
Households with kids: 18.7%
More on St. Louis Park: Data | Crime | Cost Of Living | Movers

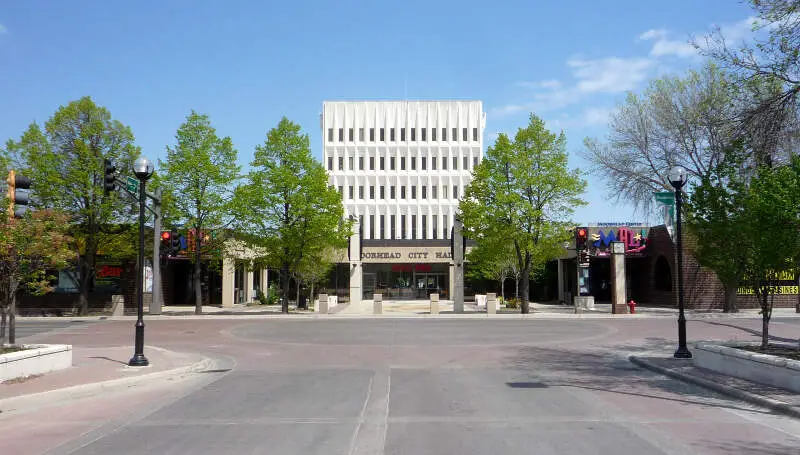
/10
Population: 45,036
Median Age: 31.3
Married households: 18.0%
Households with kids: 27.9%
More on Moorhead: Data | Crime | Cost Of Living | Movers

/10
Population: 14,234
Median Age: 39.4
Married households: 27.0%
Households with kids: 25.1%
More on Robbinsdale: Data | Crime | Cost Of Living | Movers

/10
Population: 22,476
Median Age: 37.7
Married households: 28.0%
Households with kids: 25.5%
More on Crystal: Data | Crime | Cost Of Living | Movers


/10
Population: 12,570
Median Age: 35.2
Married households: 25.0%
Households with kids: 32.0%
More on North St. Paul: Data | Crime | Cost Of Living | Movers
Methodology: How do you determine which city is best for singles in Minnesota anyways?
To give you the places in Minnesota which are best for singles to find one another, we used Saturday Night Science to look at a handful of metrics. Of course, we want to measure the type of people who live in each city and make some assumptions about what single people like.
So we researched the internet for a database that contains all that information.
We threw a lot of criteria at this one to get the best, most complete results possible. Using the 2020-2024 American Community Survey Census data produced for the state of Minnesota, we looked at every single city in the state. We paid particular attention to:
- Population density
- % of population that’s male vs. female (closer to a 50-50 ratio is better)
- % of households with kids
- Median age
- Number of unmarried people in each city
We then gave each city a “Singles Score.”
The higher the score, the better the city is for singles to find one another. We also limited our results to cities with over 10,000 people. For Minnesota, that meant a total of 101 cities.
We updated this article for 2026. This is our eleventh time ranking the best cities for singles in Minnesota.
Read on to see why Minneapolis is the talk of the town while Ham Lake is probably a bit on the bland side.
Summary: The Best Cities for Singles in Minnesota for 2026
If you’re looking for a breakdown of cities in Minnesota ranked by criteria that most agree make a place a great spot for finding a single person (and potentially love), this is an accurate list.
The best cities for singles in Minnesota are Minneapolis, Columbia Heights, St. Paul, Mankato, Richfield, St. Louis Park, Moorhead, Robbinsdale, Crystal, and North St. Paul.
Here’s a look at the most boring cities in Minnesota according to the data:
- Ham Lake
- Lino Lakes
- St. Michael
For more Minnesota reading, check out:
- Best Places To Raise A Family In Minnesota
- Safest Places In Minnesota
- Worst Places To Live In Minnesota
Best Cities For Singles In Minnesota
| Rank | City | Population | Median Age | % Married Households | % Households /w Kids |
|---|---|---|---|---|---|
| 1 | Minneapolis, MN | 427,246 | 33.4 | 14.0% | 20.6% |
| 2 | Columbia Heights, MN | 22,155 | 36.8 | 17.0% | 26.1% |
| 3 | St. Paul, MN | 307,284 | 33.7 | 15.0% | 26.3% |
| 4 | Mankato, MN | 45,473 | 26.5 | 21.0% | 21.9% |
| 5 | Richfield, MN | 36,642 | 39.4 | 23.0% | 22.1% |
| 6 | St. Louis Park, MN | 49,594 | 36.1 | 22.0% | 18.7% |
| 7 | Moorhead, MN | 45,036 | 31.3 | 18.0% | 27.9% |
| 8 | Robbinsdale, MN | 14,234 | 39.4 | 27.0% | 25.1% |
| 9 | Crystal, MN | 22,476 | 37.7 | 28.0% | 25.5% |
| 10 | North St. Paul, MN | 12,570 | 35.2 | 25.0% | 32.0% |
| 11 | Duluth, MN | 87,093 | 35.2 | 25.0% | 22.2% |
| 12 | Brooklyn Park, MN | 83,876 | 35.2 | 19.0% | 40.3% |
| 13 | Winona, MN | 26,009 | 31.3 | 18.0% | 15.4% |
| 14 | St. Cloud, MN | 70,629 | 30.6 | 20.0% | 28.4% |
| 15 | Hopkins, MN | 18,819 | 37.8 | 18.0% | 19.8% |
| 16 | St. Peter, MN | 12,185 | 35.6 | 20.0% | 26.8% |
| 17 | Little Canada, MN | 10,514 | 40.4 | 21.0% | 28.1% |
| 18 | Northfield, MN | 20,742 | 28.2 | 19.0% | 27.1% |
| 19 | New Brighton, MN | 22,710 | 37.0 | 26.0% | 29.5% |
| 20 | Fridley, MN | 30,241 | 34.7 | 24.0% | 30.7% |
| 21 | Brooklyn Center, MN | 32,479 | 33.5 | 14.0% | 35.5% |
| 22 | Austin, MN | 26,358 | 36.2 | 24.0% | 35.1% |
| 23 | Bemidji, MN | 15,569 | 30.0 | 18.0% | 24.6% |
| 24 | South St. Paul, MN | 20,611 | 37.2 | 29.0% | 28.1% |
| 25 | Oakdale, MN | 28,585 | 39.7 | 30.0% | 28.0% |
| 26 | Eagan, MN | 68,000 | 39.3 | 26.0% | 29.0% |
| 27 | Burnsville, MN | 64,463 | 36.7 | 21.0% | 27.8% |
| 28 | Rochester, MN | 122,330 | 36.3 | 22.0% | 28.5% |
| 29 | West St. Paul, MN | 21,382 | 39.8 | 24.0% | 22.4% |
| 30 | Worthington, MN | 13,780 | 33.5 | 13.0% | 34.7% |
| 31 | Roseville, MN | 35,802 | 41.1 | 26.0% | 22.7% |
| 32 | Coon Rapids, MN | 63,468 | 39.0 | 27.0% | 30.0% |
| 33 | Anoka, MN | 17,970 | 40.6 | 30.0% | 30.0% |
| 34 | Maplewood, MN | 40,695 | 39.5 | 24.0% | 26.8% |
| 35 | Albert Lea, MN | 18,330 | 44.3 | 28.0% | 24.3% |
| 36 | Bloomington, MN | 88,665 | 41.1 | 27.0% | 24.0% |
| 37 | White Bear Lake, MN | 23,908 | 41.9 | 29.0% | 23.9% |
| 38 | Stillwater, MN | 19,355 | 42.5 | 30.0% | 28.7% |
| 39 | Blaine, MN | 72,488 | 37.5 | 30.0% | 37.4% |
| 40 | New Hope, MN | 21,181 | 40.5 | 21.0% | 31.7% |
| 41 | Apple Valley, MN | 55,679 | 39.0 | 24.0% | 31.5% |
| 42 | Woodbury, MN | 78,305 | 38.0 | 26.0% | 36.5% |
| 43 | Mounds View, MN | 12,926 | 40.2 | 31.0% | 28.2% |
| 44 | New Ulm, MN | 14,056 | 39.3 | 35.0% | 25.6% |
| 45 | Cambridge, MN | 10,307 | 37.6 | 30.0% | 25.9% |
| 46 | Monticello, MN | 14,858 | 34.1 | 31.0% | 38.3% |
| 47 | Shakopee, MN | 46,012 | 36.6 | 26.0% | 41.4% |
| 48 | Minnetonka, MN | 53,064 | 42.9 | 30.0% | 25.9% |
| 49 | Willmar, MN | 21,378 | 35.5 | 26.0% | 29.4% |
| 50 | Vadnais Heights, MN | 12,838 | 39.6 | 30.0% | 28.3% |
| 51 | Faribault, MN | 24,631 | 38.7 | 22.0% | 28.0% |
| 52 | Savage, MN | 32,889 | 37.5 | 30.0% | 36.6% |
| 53 | Waconia, MN | 13,434 | 38.4 | 38.0% | 38.8% |
| 54 | Golden Valley, MN | 21,725 | 44.2 | 30.0% | 25.6% |
| 55 | Brainerd, MN | 14,468 | 35.1 | 31.0% | 26.5% |
| 56 | Prior Lake, MN | 28,016 | 39.6 | 31.0% | 38.6% |
| 57 | Detroit Lakes, MN | 10,025 | 41.6 | 29.0% | 24.3% |
| 58 | Owatonna, MN | 26,498 | 40.4 | 37.0% | 29.4% |
| 59 | Eden Prairie, MN | 63,051 | 41.3 | 25.0% | 32.5% |
| 60 | Edina, MN | 53,262 | 44.9 | 27.0% | 26.9% |
| 61 | Shoreview, MN | 26,714 | 43.6 | 30.0% | 28.5% |
| 62 | Plymouth, MN | 79,220 | 40.3 | 27.0% | 33.0% |
| 63 | North Mankato, MN | 14,211 | 38.5 | 34.0% | 32.8% |
| 64 | Sauk Rapids, MN | 13,852 | 35.3 | 35.0% | 31.1% |
| 65 | Mendota Heights, MN | 11,612 | 47.0 | 35.0% | 26.6% |
| 66 | Alexandria, MN | 14,735 | 40.8 | 34.0% | 23.6% |
| 67 | Cottage Grove, MN | 40,992 | 36.5 | 34.0% | 38.1% |
| 68 | Maple Grove, MN | 71,173 | 40.9 | 30.0% | 33.3% |
| 69 | Red Wing, MN | 16,758 | 42.0 | 28.0% | 25.3% |
| 70 | Fergus Falls, MN | 14,181 | 43.3 | 26.0% | 19.9% |
| 71 | Buffalo, MN | 16,499 | 38.6 | 35.0% | 33.7% |
| 72 | Marshall, MN | 13,896 | 35.9 | 31.0% | 30.7% |
| 73 | Chaska, MN | 28,706 | 37.5 | 30.0% | 37.8% |
| 74 | Chanhassen, MN | 26,006 | 41.5 | 30.0% | 34.8% |
| 75 | Lakeville, MN | 74,354 | 36.8 | 32.0% | 42.7% |
| 76 | Ramsey, MN | 28,421 | 36.9 | 40.0% | 35.1% |
| 77 | Rosemount, MN | 27,562 | 38.9 | 33.0% | 38.9% |
| 78 | Sartell, MN | 19,758 | 34.8 | 38.0% | 34.2% |
| 79 | Otsego, MN | 22,245 | 34.9 | 37.0% | 43.8% |
| 80 | Champlin, MN | 23,294 | 41.6 | 34.0% | 32.4% |
| 81 | Farmington, MN | 23,902 | 35.4 | 32.0% | 43.6% |
| 82 | Hastings, MN | 22,117 | 41.0 | 36.0% | 27.9% |
| 83 | Forest Lake, MN | 20,729 | 39.6 | 35.0% | 30.2% |
| 84 | Hibbing, MN | 16,057 | 45.7 | 32.0% | 19.2% |
| 85 | Hutchinson, MN | 14,680 | 41.9 | 36.0% | 26.2% |
| 86 | Inver Grove Heights, MN | 35,906 | 41.6 | 32.0% | 29.3% |
| 87 | Rogers, MN | 13,685 | 37.0 | 41.0% | 46.7% |
| 88 | Elk River, MN | 26,793 | 37.2 | 36.0% | 37.4% |
| 89 | East Bethel, MN | 12,115 | 40.9 | 45.0% | 29.4% |
| 90 | Andover, MN | 33,035 | 39.6 | 42.0% | 40.0% |
| 91 | Fairmont, MN | 10,296 | 46.6 | 34.0% | 22.7% |
| 92 | Cloquet, MN | 12,537 | 37.4 | 31.0% | 31.2% |
| 93 | Lake Elmo, MN | 13,140 | 40.8 | 42.0% | 40.0% |
| 94 | North Branch, MN | 11,565 | 39.5 | 36.0% | 30.1% |
| 95 | Victoria, MN | 11,295 | 41.2 | 37.0% | 42.1% |
| 96 | Grand Rapids, MN | 11,207 | 44.3 | 37.0% | 25.2% |
| 97 | Hugo, MN | 16,340 | 40.1 | 43.0% | 32.9% |
| 98 | Hermantown, MN | 10,218 | 38.7 | 40.0% | 33.5% |
| 99 | St. Michael, MN | 20,010 | 37.6 | 38.0% | 43.7% |
| 100 | Lino Lakes, MN | 22,113 | 41.5 | 41.0% | 32.8% |