Suppose real estate is the most significant investment a majority of people make in their lifetime. In that case, it’s best to understand the places in Indiana with best potential return on investment.
After working in real estate adjacent roles for over a decade, I had the hypothesis that the best place to buy for a return on investment would be up-and-coming cities. Smaller cities where crime might be high now, but people still move to.
To test my hypothesis, we are going to look at places in Indiana that are growing faster than average, but where home prices are below average, and crime rates are higher than average.
In everyday terms, these might be “deals”. The best deal in Indiana at the moment according to Saturday Night Science? That would be Pendleton.
Table Of Contents: Top Ten | Methodology | Summary | Table
The 10 Best Places To Buy A Home In Indiana For 2026
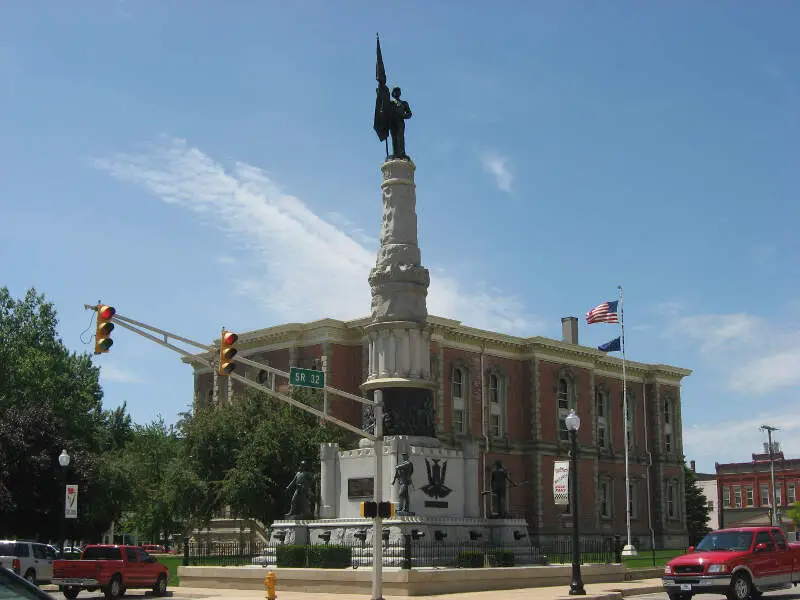
- Pendleton
- Whiteland
- Winchester
- Porter
- Winona Lake
- Cicero
- Tipton
- Alexandria
- Lawrenceburg
- Monticello
The methodology that wen’t into this can be a bit complicated, so we’ll break it down for you in as much detail as we can below.
For more Indiana reading:
- Best Counties To Live In Indiana
- Best Places To Raise A Family In Indiana
- Best Places To Retire In Indiana
The 10 Best Cities To Buy A House In Indiana For 2026
/10
Population: 5,321
Median Home Price: $334,738
Population Change: 4.0%
Home Price Change: 0.6%
More on Pendleton: Data | Movers
/10
/10
/10
/10
/10
7. Tipton
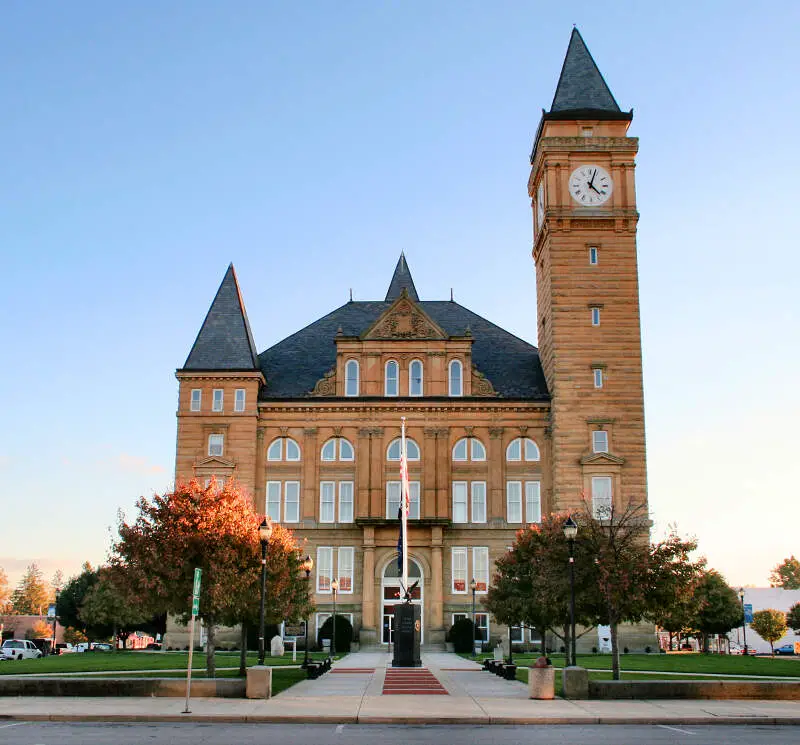
/10
Population: 5,280
Median Home Price: $237,894
Population Change: 0.5%
Home Price Change: 1.8%
More on Tipton: Movers
8. Alexandria
/10
Population: 5,155
Median Home Price: $182,198
Population Change: 0.2%
Home Price Change: 1.4%
More on Alexandria: Movers
/10
Population: 5,179
Median Home Price: $248,400
Population Change: 0.5%
Home Price Change: 1.1%
More on Lawrenceburg: Data | Cost Of Living | Movers
/10
Population: 5,496
Median Home Price: $235,504
Population Change: -0.1%
Home Price Change: 0.3%
More on Monticello: Data | Cost Of Living | Movers
Methodology: How do you determine the best places to buy a home in Indiana for 2026?
We were in real estate for almost five years and have worked on this site for another 11. Suffice it to say we’ve put a lot of thought into finding an excellent place to buy a home.
So all that thinking has come to this moment where we get to spell out how we’d approach finding an up-and-coming place to live in Indiana. Put differently, the analysis will try to find places in Indiana with undervalued homes relative to pent-up demand using Saturday Night Science.
To do that, we looked at the most recent American Community Survey Census data for 2020-2024 and compared it to the previous vintage. Specifically, we used the following criteria:
- Y-o-Y Change In Population (People want to live here)
- Y-o-Y Change In Median Home Prices (People are willing to pay for it)
- Home Prices Relative To The State Average (It’s still kinda cheap)
We want places that are growing, have seen home prices increase in recent years, and are still “cheap” for Indiana with the following caveats:
- Home prices had to be within 20% of the state average (Much lower than that, and you get to some of the more dangerous places)
- Home prices increased in the last year, and
- Above 5,000 people (Bigger cities have more data points)
So of the 0 cities and towns in Indiana, only 125 places made it through our initial filters to even be considered.
We then ranked each place from 1 to 125 for the above criteria, with 1 being the best. We averaged the rankings to create a “best place to buy” index, with the place having the lowest index being the best.
Turns out that Pendleton is the best potential gem in the not-so-rough in the Hoosier State.
Summary: The Best Places To Purchase A House In Indiana for 2026
There’s our analysis of the best places to buy a house in Indiana. And, to be clear, we aren’t necessarily saying these places are the best places to live, just that it looks like they might be in a couple of years based on the data.
In fact, every place in the following table meets our criteria, so even though it may not look super long, remember we started off with all 0 places in the state.
The best cities to buy a house in Indiana are Pendleton, Whiteland, Winchester, Porter, Winona Lake, Cicero, Tipton, Alexandria, Lawrenceburg, and Monticello.
So if we’d could rent or buy in these cities, we’d definitely buy.
For more Indiana reading, check out:
Best Places To Buy A Home In Indiana
| Rank | City | Population | Median Home Price | Population Change | Home Price Increase |
|---|---|---|---|---|---|
| 1 | Pendleton | 5,321 | $334,738 | 4.0% | 0.6% |
| 2 | Whiteland | 5,173 | $296,965 | 18.4% | 0.6% |
| 3 | Winchester | 5,284 | $152,402 | 7.6% | 6.3% |
| 4 | Porter | 5,217 | $297,622 | 0.2% | 1.3% |
| 5 | Winona Lake | 5,080 | $297,378 | 0.1% | 0.7% |
| 6 | Cicero | 5,509 | $401,399 | 1.2% | -0.2% |
| 7 | Tipton | 5,280 | $237,894 | 0.5% | 1.8% |
| 8 | Alexandria | 5,155 | $182,198 | 0.2% | 1.4% |
| 9 | Lawrenceburg | 5,179 | $248,400 | 0.5% | 1.1% |
| 10 | Monticello | 5,496 | $235,504 | -0.1% | 0.3% |
| 11 | Linton | 5,260 | $171,818 | 2.1% | 3.7% |
| 12 | Gas City | 6,076 | $157,193 | -0.3% | -0.5% |
| 13 | Hartford City | 5,794 | $139,703 | 1.9% | 4.4% |
| 14 | Westville | 5,279 | $357,284 | -0.2% | 1.1% |
| 15 | Cumberland | 6,267 | $289,408 | 1.8% | 0.1% |
| 16 | Winfield | 7,816 | $476,915 | 4.2% | -4.6% |
| 17 | Portland | 6,416 | $162,774 | 1.2% | -0.9% |
| 18 | Rochester | 6,215 | $210,468 | -0.5% | 1.5% |
| 19 | Rensselaer | 5,573 | $242,740 | 3.8% | 0.6% |
| 20 | New Whiteland | 5,704 | $228,046 | 1.1% | 0.6% |
| 21 | Salem | 6,489 | $208,086 | 0.1% | 1.4% |
| 22 | Rushville | 6,036 | $202,258 | -2.4% | 0.5% |
| 23 | Huntingburg | 6,396 | $240,497 | -1.7% | 3.7% |
| 24 | Garrett | 6,642 | $187,133 | 1.6% | 3.2% |
| 25 | Boonville | 6,702 | $230,216 | 0.3% | 3.9% |
| 26 | Mount Vernon | 6,400 | $221,083 | -0.5% | 1.2% |
| 27 | Ellettsville | 6,698 | $274,445 | 0.7% | 1.6% |
| 28 | Scottsburg | 7,362 | $187,043 | 0.3% | 0.8% |
| 29 | Batesville | 7,282 | $317,504 | 6.4% | 1.1% |
| 30 | Nappanee | 6,815 | $288,904 | -3.2% | 1.6% |
| 31 | North Vernon | 7,078 | $212,243 | -1.9% | 2.5% |
| 32 | Hunte | 11,379 | $347,292 | 3.6% | 8.9% |
| 33 | Mccordsville | 10,329 | $375,788 | 6.5% | 0.3% |
| 34 | Tell City | 7,505 | $181,284 | 0.2% | 2.0% |
| 35 | Bargersville | 10,752 | $442,137 | 5.8% | -1.3% |
| 36 | Brazil | 7,831 | $188,386 | -2.9% | 2.8% |
| 37 | Charlestown | 8,294 | $302,063 | 2.2% | -0.2% |
| 38 | Elwood | 8,356 | $148,428 | 0.4% | 6.2% |
| 39 | Angola | 9,408 | $302,980 | 0.3% | 0.3% |
| 40 | Princeton | 8,372 | $187,282 | 0.3% | 1.3% |
| 41 | White | 12,466 | $434,988 | 10.6% | 1.5% |
| 42 | Columbia City | 9,897 | $279,168 | -0.8% | -0.0% |
| 43 | Sellersburg | 10,137 | $296,867 | -0.8% | -0.0% |
| 44 | Kendallville | 10,556 | $220,523 | 4.6% | 2.3% |
| 45 | Decatur | 9,811 | $229,668 | 0.4% | 2.1% |
| 46 | Mooresville | 9,751 | $308,098 | 1.5% | 0.2% |
| 47 | Lowell | 11,073 | $329,211 | 1.5% | 0.8% |
| 48 | Wabash | 10,358 | $179,808 | -0.2% | 1.8% |
| 49 | Plymouth | 10,664 | $238,868 | 1.5% | 0.1% |
| 50 | Bluffton | 10,529 | $183,602 | -0.1% | 1.0% |
| 51 | Greencastle | 9,864 | $243,386 | 0.0% | 1.3% |
| 52 | Danville | 11,714 | $337,029 | 6.0% | 0.5% |
| 53 | Yor | 11,699 | $217,436 | 0.7% | -4.2% |
| 54 | Greensburg | 12,229 | $261,665 | 5.6% | 1.8% |
| 55 | Peru | 10,901 | $149,303 | 0.6% | 2.3% |
| 56 | Madison | 12,223 | $240,679 | -0.4% | 1.4% |
| 57 | Martinsville | 11,933 | $288,805 | 0.2% | 0.4% |
| 58 | Lake Station | 13,185 | $151,774 | 0.6% | -1.0% |
| 59 | Speedway | 13,968 | $236,684 | 2.5% | 0.0% |
| 60 | Washington | 12,367 | $147,888 | 1.4% | 0.8% |
| 61 | Cedar Lake | 15,295 | $328,155 | 4.1% | -0.8% |
| 62 | Connersville | 13,109 | $157,813 | -1.0% | 1.8% |
| 63 | Auburn | 13,565 | $275,151 | 0.8% | 2.2% |
| 64 | Bedford | 13,837 | $207,924 | 0.1% | 2.8% |
| 65 | Chesterton | 14,446 | $340,855 | 0.8% | 0.9% |
| 66 | Beech Grove | 14,913 | $191,935 | -1.1% | -0.2% |
| 67 | Frankfort | 15,917 | $209,855 | 2.5% | 4.1% |
| 68 | Jasper | 15,991 | $266,264 | -2.6% | 3.4% |
| 69 | Warsaw | 16,768 | $271,690 | 1.1% | 2.2% |
| 70 | Dyer | 16,400 | $355,530 | 0.0% | -0.6% |
| 71 | New Haven | 15,698 | $240,072 | 2.3% | 2.5% |
| 72 | Crawfordsville | 16,491 | $219,772 | 0.5% | -0.6% |
| 73 | Griffith | 16,273 | $247,098 | 0.3% | 0.7% |
| 74 | Lebanon | 17,812 | $299,031 | 1.3% | 3.0% |
| 75 | Huntington | 17,030 | $192,024 | 0.0% | 0.3% |
| 76 | Vincennes | 16,586 | $164,630 | -0.5% | 1.6% |
| 77 | New Castle | 17,367 | $164,335 | 0.1% | 0.9% |
| 78 | Logansport | 17,790 | $153,142 | 0.1% | -1.2% |
| 79 | Avon | 23,437 | $352,859 | 3.3% | 1.5% |
| 80 | St. John | 22,567 | $450,805 | 4.3% | -0.3% |
| 81 | Shelbyville | 20,296 | $222,048 | 2.2% | 0.4% |
| 82 | Seymour | 22,371 | $230,828 | 3.9% | 0.6% |
| 83 | La Porte | 22,449 | $271,480 | 1.5% | 0.4% |
| 84 | Clarksville | 22,016 | $203,068 | -0.5% | 2.2% |
| 85 | Highland | 23,680 | $262,851 | -0.3% | -0.5% |
| 86 | Greenfield | 24,940 | $285,065 | 2.6% | 0.7% |
| 87 | Munster | 23,733 | $347,951 | 0.0% | -0.6% |
| 88 | Franklin | 26,168 | $279,167 | 0.7% | 1.6% |
| 89 | Brownsburg | 31,215 | $356,184 | 3.0% | 0.6% |
| 90 | Marion | 27,531 | $136,312 | 0.5% | 1.7% |
| 91 | Zionsville | 32,095 | $680,117 | 2.1% | 1.8% |
| 92 | East Chicago | 26,022 | $128,170 | -0.5% | -2.3% |
| 93 | Hobart | 29,558 | $238,195 | -0.3% | -0.2% |
| 94 | Schererville | 29,701 | $352,735 | 0.2% | 0.2% |
| 95 | Crown Point | 34,393 | $354,995 | 1.0% | 0.2% |
| 96 | Michigan City | 31,814 | $187,488 | -0.3% | 1.8% |
| 97 | Valparaiso | 34,733 | $355,844 | 1.0% | 0.4% |
| 98 | Plainfield | 36,369 | $331,617 | 1.6% | 1.2% |
| 99 | Goshen | 34,420 | $275,119 | 0.1% | 2.0% |
| 100 | Merrillville | 36,476 | $240,328 | 0.4% | 0.6% |