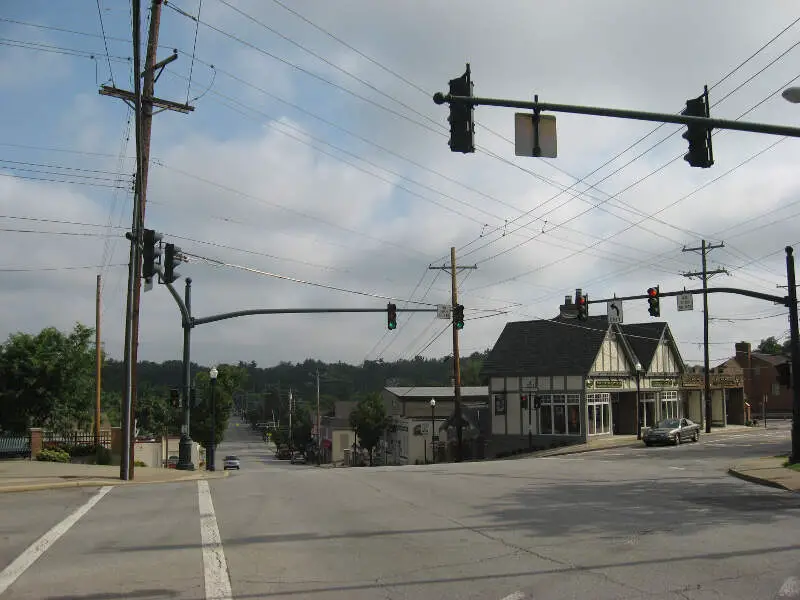
The best places in Ohio let you experience Tony Packo’s famous chili dog and a bowl of Jeni’s Splendid Ice Cream. Or you can explore places like the Hockey Hall of Fame in Toledo, the Cedar Point amusement park in Sandusky, or the Cincinnati Zoo.
So, narrowing down the top ten best places to live in Ohio was tough.
To determine the best places to live in Ohio, we used Saturday Night Scienceto compare data from the Census, FBI, and Zillow on things like incomes, safety, and home prices. We analyzed 245 cities over 5,000 people.
Here are Ohioâs outstanding offerings.
$167,653 median income · $531,046 median home · #1 best place in Ohio
Madeira is an awesome suburb of Cincinnati located about 15 miles northeast of the city. It’s the kind of city where you set down roots when your kids are in grade school and stay until they graduate from college. Niche gives the Madeira City Public School District an A+ rating, which is just part of the reason it’s one of the better places to live in Ohio.
Some of the other reasons Madeira ranks so well have to do with the economy. The city ranks 6th for unemployment and 10th for home values per the latest Census data. Add in top 10% finishes for every category we ranked in Ohio, and Madeira comes out as a well rounded city.
Data | Crime | Cost of living | Movers
$155,167 median income · $632,819 median home · #2 best place in Ohio
Next up on our trip to the best places in Ohio is Upper Arlington, a Columbus suburb of 36,293 and the most populous city on this list. Homes are quite costly in Upper Arlington, but residents can handle it seeing as the median household income here is $155,167/year, the 10th highest in the state.
The success of Upper Arlington is no coincidence. Over three quarters of residents have at least a bachelor’s degree, which has a tremendous impact on earning potential. Speaking of potential, Upper Arlington makes sure that its student population lives up to theirs. How do we know? Well, Upper Arlington High School has received a College Success Award from GreatSchools for the past two years, with an emphasis on top-ranking test scores and a perfect 10/10 for students’ college readiness.
Upper Arlington is also close to Columbus’ German Village, a historic district with old, three-story maximum architecture and brick streets that’s as good for a wholesome day out as it is for an exciting night on the town.
Data | Crime | Cost of living | Movers
$150,995 median income · $677,977 median home · #3 best place in Ohio
Montgomery is an affluent Cincinnati suburb of 10,855. While home prices in Montgomery are among the highest in the state, people here are paid enough to shoulder the burden. In fact, at $150,995/year, Montgomery residents enjoy the 11th highest median household income in Ohio.
Don’t think that Montgomery only caters to the 1% either. With a 3.3% poverty level and 98.8% of people covered by health insurance, everyone here can get by (and then some). Not to mention that, with a 10/10 SnackAbility score for education, Montgomery’s youth gets access to some of the best schools in the state.
And with the Cincinnati Zoo and Botanical Garden a short drive away, you’ve always got the perfect family (or date) activity right in your backyard. Even if you cap off your day with a walk around Smale Riverfront Park, you can still be back in Montgomery before dinnertime.
Data | Crime | Cost of living | Movers

$165,188 median income · $483,221 median home · #4 best place in Ohio
We’ll take a short drive west to another Cincy suburb to arrive at our 4th best city in Ohio, Wyoming. As one of the richest places in Ohio, with a median household income of $165,188/year, Wyoming has an unshakeable economy. And with the 6th lowest poverty level in Ohio, 2.7%, you can feel secure in knowing that all Wyoming’s residents are along for the ride. Add to that the 10th highest rate of health insurance coverage in the state, and you’ve got a city where unwelcome surprises are much less devastating.
Wyoming also has a crime rate about 60% below the national average, so the sound of police sirens should rarely be a part of your day-to-day life here.
Baseball fans might consider going in on season tickets, because from Wyoming, you can be at a Reds Game in just 20 minutes.
Data | Crime | Cost of living | Movers
$117,672 median income · $554,974 median home · #5 best place in Ohio
Let’s start our tour of the best places to live in Ohio with Grandview Heights, a suburb just minutes from downtown Columbus. Thanks to Grandview Heights’ proximity to the Ohio’s capital city, it ranks as the 13th most densely populated and has the 49th shortest commute (20 minutes) in the whole state. Both of which are the best of cities included on this list.
Besides being in the middle of the action, Grandview Heights has a lot going for it. Like a super smart population where over 30% of people have at least a master’s degree. And a poverty level and unemployment rate at 6.0% and 1.2% respectively, both among the lowest in Ohio. This rock solid economy with highly educated workers translates into big salaries, because the median household income in Grandview Heights is $117,672/year.
While there’s plenty to do in Grandview Heights itself, we think it’s extra cool that you can be at a Buckeyes’ game at Ohio Stadium with 100,000 of your closest friends in just ten minutes. Just be sure to make your move to Grandview Heights quickly, because the secret is out and its one of the fastest growing cities in Ohio.
Data | Crime | Cost of living | Movers

$122,863 median income · $418,478 median home · #6 best place in Ohio
Highland Heights claims the 6th spot among the best places to live in Ohio, and this quiet Cleveland suburb of 8,623 earns it. The poverty rate sits at just 3.4%, and unemployment clocks in at 2.6%, both well below what you’d find across most of the state.
Median household income here is $122,863, which goes a long way where homes run around $418,478 and the average commute to Cleveland is a manageable 21 minutes. Golf fans should know that StoneWater Golf Club has hosted multiple Nationwide Tour events right in this neighborhood. Not too shabby for a city of under 9,000 people.
Data | Crime | Cost of living | Movers
$94,026 median income · $393,092 median home · #7 best place in Ohio
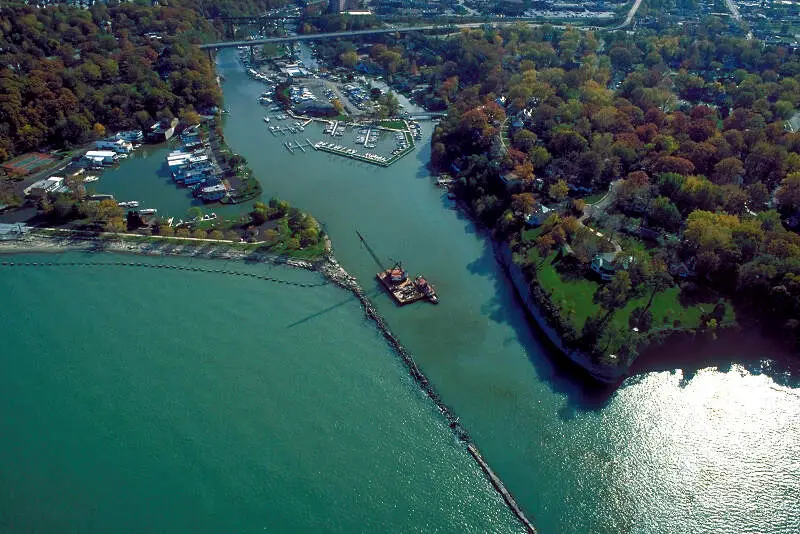
Rocky River is a Cleveland suburb of 21,490 located along the shore of Lake Erie. If you prefer the company of women, Rocky River might just be the place for you, because at 53.3%, it has the greatest percentage of women among the places listed here. And as the second most densely populated spot on this list, you’d better believe Rocky River is a hub of activity.
Rocky River also has the 2lowest crime rate in the state. So you won’t have to worry for your kiddos’ safety when they head off to school. Speaking of which, all levels of education in Rocky River (elementary, middle, and high school) got scores of 9/10 on GreatSchools, so from start to finish, kids get the best possible learning experience here.
And for folks who never change the radio from the classic rock station, being just 20 minutes down the road from the Rock & Roll Hall of Fame is a welcome bonus.
Data | Crime | Cost of living | Movers
$195,495 median income · $567,815 median home · #8 best place in Ohio
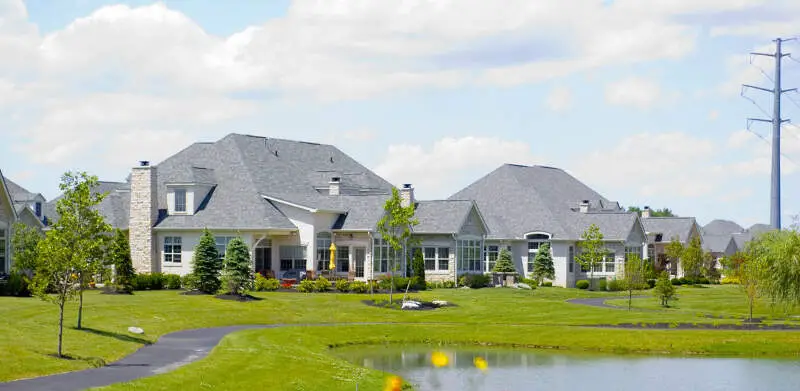
Clocking in as the 8th best place to call home in Ohio is Powell, one of Columbus’ best suburbs. You don’t have to worry about finding fun things to do in Powell because this city of 14,451 is chock full of exciting amenities.
Powell is home to the Columbus Zoo and Zoombezi Bay, a waterpark. Both are big hits with families, which makes sense considering that 45.34% of Powell’s households have kids. For nature lovers, there’s also the Emily Traphagen Preserve, where you can spot several types of birds.
GreatSchools gave Powell’s school district an average score of 8/10, most public schools score in the top 5% statewide, and the city has achieved the 18th lowest high school dropout rate in Ohio. No wonder Powell is one of Ohio’s fastest-growing cities.
Additionally, Powell has the lowest poverty rate and 25th highest rate of health-insured residents in Ohio, so everybody gets a piece of the pie here. The median household income in Powell is $195,495, the 3rd highest in Ohio. The median home value in Powell is the 6th highest statewide at $567,815.
Data | Crime | Cost of living | Movers

$111,643 median income · $330,761 median home · #9 best place in Ohio
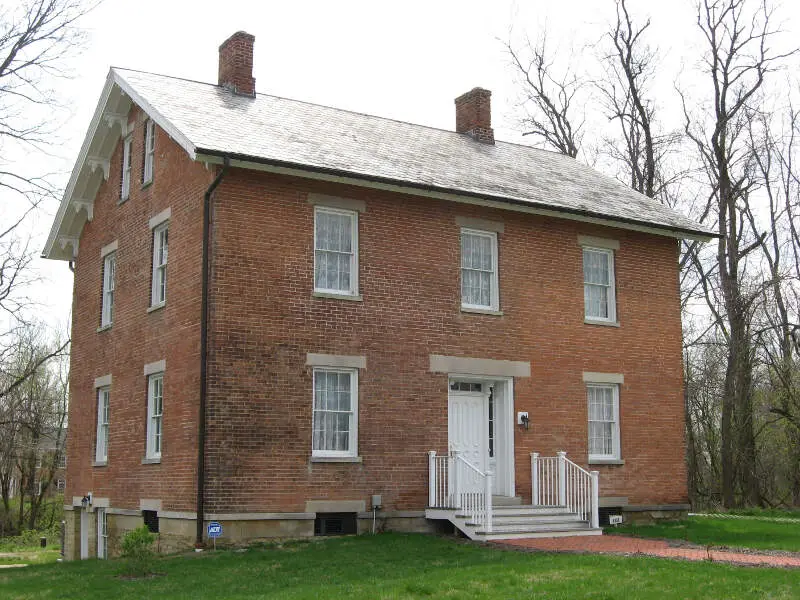
Located just south of the Maumee River from Toledo, Perrysburg ranks as the 9th best city to live in Ohio. We already named Perrysburg the best city for families in Ohio, and a lot of those same factors help land it here on this list. For instance, a 9.5/10 SnackAbility score for education, including a high school that consistently gets awarded for college success scores. And awesome interactive projects like the 577 Foundation, where beekeeping, fossil-digging, and rock wall-climbing are just a few of the goodies in store for a guaranteed successful family day out. Or if you’d prefer a day with the fam in the big city, the Toledo Zoo is another surefire option.
Perrysburg residents enjoy a median household income of $111,643/year and a relatively low cost of living.
Data | Crime | Cost of living | Movers
$238,250 median income · $632,192 median home · #10 best place in Ohio
We’ll stick around the Columbus ‘burbs for our 10th best city in Ohio, New Albany. Both home prices and incomes in New Albany are the 4th highest in the state by a substantial margin, so you know this city has plenty of cash on hand. Even better, taxes on all that money go to projects that the whole city can enjoy, like the newly developed (and developing) Village Center. And if New Albany’s downtown doesn’t have what you need yet, Columbus’ Easton Town Center is just 10 miles down the road.
New Albany residents know the importance of staying in school, because the city has the 24th lowest adult high school dropout rate in Ohio. Which, of course, helps explain the fact that New Albany also has the 2nd lowest poverty level in the state. And since educated, moneyed individuals don’t often go in for crime, New Albany’s crime rate being 70% below the national average is no surprise.
Data | Crime | Cost of living | Movers
The receipts
Compare the top ten
Pick a metric. The bars rescale. The red line is Ohio’s statewide median.
Ohio statewide median: $71,389
Ohio statewide median: $242,141
Ohio statewide median: 4.8%
On the map
Mapping The Best And Worst Places To Live in Ohio
Saturday Night Science
Methodology: How We Calculated The Best Cities To Live In Ohio
Before we even started to collect data on the best places to live in Ohio, we had to answer a tough question: Is it fair to pit cities with populations over 100,000 against places with a population of 18?
We firmly decided no, that just isn’t fair.
So, to create our ranking, we broke the best places to live into three tiers:
- Cities — Populations over 5,000
- Towns — Populations between 1,000 and 5,000
- Small Towns — Populations below 1,000
We then decided no matter how much anyone loves their town, the best cities to live in Ohio have more of everything, and therefore, you need over 5,000 people to truly be ‘the best.’
Now that we had our set of the best possible cities, it was time to rank them using Saturday Night Science.
We ranked each place in Ohio across a number of criteria from one to 245, with one being the best.
We then took the average rank across all criteria, crowning the city posting the lowest overall score, the “Best Place To Live In Ohio.”
The criteria we looked to determine the best places were:
- Median Home Values
- Median Income
- Population Density (Higher is better)
- Unemployment Rate
- Commute Time
- Crime
- Education Levels
- Health Insurance Coverage
- Poverty rates
Sources of criteria include the New Census Data, FBI Crime Data, and Zillow. We updated this article for 2026. This report is our eleventh time ranking Ohio’s best places to live.
If your city or town isn’t among the top 10, jump down to the bottom of the post to see a detailed chart of the best places in Ohio. Otherwise, buckle up for a ride down good living lane with Madeira at the end of the cul-de-sac.
The full plate
Best Places To Live In Ohio Table
Click any column to sort. Search by city name.
| Rank | City | Best Score | Population | Unemployment Rate | Home Value | Median Income | Rent | Total Crime /100k |
|---|---|---|---|---|---|---|---|---|
| 1 | Madeira | 19.90 | 9,484 | 1.2% | $531,046 | $167,653 | 369 | |
| 2 | Upper Arlington | 24.55 | 36,293 | 2.0% | $632,819 | $155,167 | 807 | |
| 3 | Montgomery | 39.60 | 10,855 | 2.7% | $677,977 | $150,995 | 691 | |
| 4 | Wyoming | 42.70 | 8,723 | 2.6% | $483,221 | $165,188 | 688 | |
| 5 | Grandview Heights | 43.00 | 8,647 | 1.2% | $554,974 | $117,672 | 2,244 | |
| 6 | Highland Heights | 43.30 | 8,623 | 2.6% | $418,478 | $122,863 | 441 | |
| 7 | Rocky River | 44.50 | 21,490 | 2.6% | $393,092 | $94,026 | 437 | |
| 8 | Powell | 44.95 | 14,451 | 2.0% | $567,815 | $195,495 | 927 | |
| 9 | Perrysburg | 45.95 | 25,181 | 3.7% | $330,761 | $111,643 | 477 | |
| 10 | New Albany | 46.72 | 10,896 | 0.9% | $632,192 | $238,250 | 1,322 | |
| 11 | Pepper Pike | 47.35 | 6,840 | 2.2% | $696,160 | $227,813 | 541 | |
| 12 | Bexley | 49.50 | 13,114 | 2.5% | $572,577 | $157,841 | 2,402 | |
| 13 | Avon Lake | 49.60 | 25,752 | 1.6% | $422,131 | $115,567 | 315 | |
| 14 | Bellbrook | 53.90 | 7,394 | 0.6% | $317,414 | $111,513 | 500 | |
| 15 | Hudson | 55.55 | 23,039 | 1.3% | $542,265 | $171,427 | 508 | |
| 16 | Worthington | 58.40 | 14,938 | 3.9% | $478,891 | $127,382 | 1,359 | |
| 17 | Springboro | 59.20 | 19,980 | 2.6% | $427,302 | $119,659 | 636 | |
| 18 | Mason | 61.10 | 35,509 | 2.0% | $510,362 | $125,401 | 572 | |
| 19 | North Canton | 61.60 | 17,727 | 1.7% | $283,608 | $72,544 | 1,140 | |
| 20 | Westerville | 62.70 | 38,645 | 2.2% | $446,095 | $109,404 | 1,892 | |
| 21 | Dublin | 62.85 | 49,294 | 2.5% | $559,786 | $160,296 | 1,014 | |
| 22 | Beachwood | 63.60 | 13,865 | 5.4% | $483,433 | $106,748 | 2,257 | |
| 23 | Sylvania | 63.60 | 19,055 | 3.9% | $319,899 | $100,189 | 803 | |
| 24 | Avon | 64.30 | 25,317 | 1.8% | $471,403 | $135,915 | 980 | |
| 25 | Solon | 65.90 | 23,943 | 2.4% | $452,828 | $139,089 | 848 | |
| 26 | Blue Ash | 67.40 | 13,455 | 1.2% | $447,598 | $115,313 | 1,970 | |
| 27 | Broadview Heights | 67.65 | 19,771 | 1.5% | $365,133 | $103,125 | 106 | |
| 28 | Gahanna | 68.50 | 35,486 | 2.6% | $374,129 | $109,061 | 2,043 | |
| 29 | Westlake | 68.55 | 34,104 | 3.5% | $414,010 | $112,200 | 680 | |
| 30 | Oakwood | 68.65 | 9,458 | 2.3% | $396,573 | $156,667 | 7,099 | |
| 31 | Aurora | 68.90 | 17,581 | 3.9% | $428,906 | $127,886 | 404 | |
| 32 | Lyndhurst | 69.60 | 13,801 | 2.0% | $230,587 | $91,238 | 1,174 | |
| 33 | Centerville | 70.15 | 25,205 | 3.4% | $383,031 | $85,492 | 1,091 | |
| 34 | Hilliard | 71.20 | 38,033 | 2.7% | $384,175 | $128,189 | 1,031 | |
| 35 | Independence | 71.35 | 7,534 | 1.5% | $354,545 | $115,733 | 1,354 | |
| 36 | Seven Hills | 71.95 | 11,603 | 2.5% | $299,505 | $97,222 | 965 | |
| 37 | Brecksville | 73.10 | 13,692 | 5.6% | $437,032 | $135,000 | 321 | |
| 38 | Loveland | 73.90 | 13,197 | 2.9% | $445,808 | $94,323 | 500 | |
| 39 | Olmsted Falls | 74.20 | 8,639 | 2.9% | $297,060 | $96,837 | 313 | |
| 40 | University Heights | 74.25 | 13,394 | 5.3% | $278,811 | $96,971 | 1,180 | |
| 41 | Twinsburg | 74.30 | 19,410 | 2.6% | $354,964 | $99,144 | 613 | |
| 42 | Mentor-on-the-Lake | 75.15 | 7,111 | 1.9% | $212,494 | $67,188 | 675 | |
| 43 | Deer Park | 76.95 | 5,384 | 1.6% | $259,931 | $83,371 | 854 | |
| 44 | Munroe Falls | 78.70 | 5,000 | 3.7% | $274,601 | $81,214 | 80 | |
| 45 | Brunswick | 78.75 | 35,246 | 2.0% | $313,497 | $90,663 | 445 | |
| 46 | Willowick | 79.15 | 14,162 | 3.8% | $191,619 | $77,228 | 353 | |
| 47 | Groveport | 79.33 | 5,900 | 4.2% | $311,011 | $93,586 | 1,136 | |
| 48 | Beavercreek | 80.20 | 47,126 | 3.6% | $332,151 | $110,088 | 2,080 | |
| 49 | Waterville | 81.22 | 6,017 | 3.2% | $340,488 | $104,114 | 715 | |
| 50 | Cortland | 81.25 | 7,080 | 1.0% | $225,250 | $71,563 | 537 | |
| 51 | Canfield | 81.40 | 7,649 | 6.0% | $319,365 | $97,439 | 392 | |
| 52 | Huron | 81.95 | 6,757 | 3.1% | $298,446 | $78,333 | 355 | |
| 53 | St. Marys | 82.10 | 8,301 | 1.8% | $204,181 | $79,516 | 1,172 | |
| 54 | Harrison | 82.80 | 13,084 | 1.5% | $316,154 | $100,000 | 879 | |
| 55 | Mentor | 82.90 | 47,171 | 2.9% | $269,569 | $88,949 | 1,461 | |
| 56 | Columbiana | 83.20 | 6,903 | 1.5% | $244,161 | $54,688 | 377 | |
| 57 | Granville | 83.50 | 5,999 | 2.9% | $507,108 | $124,408 | 4,594 | |
| 58 | Berea | 87.30 | 18,218 | 5.2% | $239,040 | $74,926 | 390 | |
| 59 | North Olmsted | 87.95 | 31,924 | 3.0% | $270,520 | $84,363 | 1,049 | |
| 60 | Strongsville | 88.20 | 45,983 | 2.7% | $360,031 | $103,253 | 1,344 | |
| 61 | Mayfield Heights | 88.30 | 20,022 | 5.7% | $228,639 | $66,524 | 315 | |
| 62 | Maumee | 88.65 | 13,715 | 1.6% | $277,737 | $80,833 | 2,567 | |
| 63 | St. Clairsville | 88.85 | 5,003 | 1.4% | $203,091 | $76,480 | 140 | |
| 64 | Celina | 89.15 | 10,903 | 1.4% | $234,400 | $62,849 | 1,018 | |
| 65 | Fairlawn | 89.70 | 7,711 | 2.2% | $309,743 | $97,055 | 3,755 | |
| 66 | Kettering | 89.90 | 57,206 | 3.8% | $243,733 | $74,681 | 1,526 | |
| 67 | Clayton | 91.20 | 13,277 | 2.5% | $253,570 | $92,879 | 1,235 | |
| 68 | Chardon | 92.30 | 5,249 | 3.2% | $363,602 | $86,613 | 457 | |
| 69 | Stow | 92.40 | 34,240 | 3.9% | $284,989 | $93,727 | 1,846 | |
| 70 | Pickerington | 93.40 | 24,477 | 3.5% | $419,073 | $111,833 | 1,307 | |
| 71 | Wickliffe | 94.40 | 12,659 | 3.8% | $193,210 | $81,750 | 893 | |
| 72 | Monroe | 95.05 | 15,401 | 3.2% | $352,114 | $105,250 | 1,922 | |
| 73 | Louisville | 95.10 | 9,602 | 2.4% | $240,230 | $64,375 | 864 | |
| 74 | Marysville | 95.25 | 27,518 | 3.1% | $364,500 | $92,619 | 1,261 | |
| 75 | Trenton | 96.45 | 13,583 | 4.3% | $279,523 | $80,635 | 250 | |
| 76 | Lebanon | 96.55 | 21,501 | 1.7% | $397,421 | $83,685 | 1,233 | |
| 77 | Shaker Heights | 97.55 | 28,922 | 4.6% | $342,442 | $104,073 | 5,933 | |
| 78 | New Franklin | 97.90 | 13,843 | 4.0% | $241,578 | $90,244 | 405 | |
| 79 | Hubbard | 99.80 | 7,598 | 3.2% | $164,705 | $62,593 | 1,474 | |
| 80 | Wadsworth | 100.45 | 24,492 | 2.9% | $311,603 | $79,490 | 1,131 | |
| 81 | Canal Winchester | 101.11 | 10,170 | 1.7% | $415,360 | $131,209 | 2,882 | |
| 82 | Willoughby | 101.30 | 24,046 | 4.1% | $239,414 | $71,309 | 1,048 | |
| 83 | Delaware | 103.00 | 44,589 | 2.6% | $407,929 | $99,786 | 1,182 | |
| 84 | Willoughby Hills | 104.25 | 9,975 | 3.7% | $349,448 | $67,214 | 1,898 | |
| 85 | Medina | 104.40 | 25,950 | 5.9% | $374,184 | $77,385 | 867 | |
| 86 | Lakewood | 106.40 | 50,007 | 5.0% | $286,113 | $68,954 | 1,264 | |
| 87 | Milford | 106.45 | 6,497 | 5.2% | $331,272 | $78,057 | 970 | |
| 88 | Brook Park | 106.95 | 18,284 | 3.7% | $191,188 | $71,332 | 623 | |
| 89 | Englewood | 107.25 | 13,356 | 3.4% | $234,832 | $80,030 | 2,763 | |
| 90 | Germantown | 107.56 | 5,825 | 6.9% | $265,382 | $90,125 | 876 | |
| 91 | North Ridgeville | 108.30 | 36,627 | 2.7% | $325,234 | $96,698 | 2,132 | |
| 92 | Napoleon | 108.95 | 8,802 | 2.1% | $209,535 | $76,639 | 2,011 | |
| 93 | Tallmadge | 110.50 | 18,335 | 4.1% | $282,064 | $89,410 | 1,058 | |
| 94 | Kirtland | 112.00 | 6,911 | 5.2% | $404,639 | $110,455 | 1,898 | |
| 95 | Middleburg Heights | 112.15 | 15,786 | 2.0% | $271,583 | $78,815 | 5,933 | |
| 96 | Oberlin | 112.25 | 8,329 | 5.6% | $238,965 | $81,308 | 1,357 | |
| 97 | Parma Heights | 113.20 | 20,581 | 4.1% | $214,164 | $61,009 | 360 | |
| 98 | Brookville | 113.25 | 5,779 | 2.6% | $265,951 | $63,598 | 969 | |
| 99 | Amherst | 113.35 | 12,906 | 4.8% | $274,430 | $90,725 | 1,247 | |
| 100 | Toronto | 113.60 | 5,293 | 2.9% | $133,234 | $55,972 | 397 |
Source: U.S. Census ACS 2020-2024, FBI UCR, Zillow research. 245 places with more than 5,000 residents.
Summary
Summary: The Best Places In Ohio
If you’re looking at areas in Ohio with the best economic situations, where there’s lower than average crime, and a lot to do, this is an accurate list.
The best places to live in Ohio are Madeira, Upper Arlington, Montgomery, Wyoming, Grandview Heights, Highland Heights, Rocky River, Powell, Perrysburg, and New Albany.
Madeira made a strong showing to take in the overall number one spot for the best place to live in Ohio for 2026.


