Breckenridge, CO
Demographics And Statistics
Living In Breckenridge, Colorado Summary
Life in Breckenridge research summary. HomeSnacks has been using Saturday Night Science to research the quality of life in Breckenridge over the past nine years using Census, FBI, Zillow, and other primary data sources. Based on the most recently available data, we found the following about life in Breckenridge:
The population in Breckenridge is 5,001.
The median home value in Breckenridge is $1,174,962.
The median income in Breckenridge is $132,666.
The cost of living in Breckenridge is 135 which is 1.4x higher than the national average.
The median rent in Breckenridge is $1,438.
The unemployment rate in Breckenridge is 0.7%.
The poverty rate in Breckenridge is 9.6%.
The average high in Breckenridge is 50.8° and the average low is 22.2°.
Breckenridge SnackAbility
Overall SnackAbility
Breckenridge, CO Crime Report
Crime in Breckenridge summary. We use data from the FBI to determine the crime rates in Breckenridge. Key points include:
There were 163 total crimes in Breckenridge in the last reporting year.
The overall crime rate per 100,000 people in Breckenridge is 3,325.2 / 100k people.
The violent crime rate per 100,000 people in Breckenridge is 326.4 / 100k people.
The property crime rate per 100,000 people in Breckenridge is 2,998.8 / 100k people.
Overall, crime in Breckenridge is 56.90% above the national average.
Total Crimes
Above National Average
Crime In Breckenridge Comparison Table
| Statistic | Count Raw |
Breckenridge / 100k People |
Colorado / 100k People |
National / 100k People |
|---|---|---|---|---|
| Total Crimes Per 100K | 163 | 3,325.2 | 3,069.1 | 2,119.2 |
| Violent Crime | 16 | 326.4 | 476.3 | 359.0 |
| Murder | 0 | 0.0 | 4.5 | 5.0 |
| Robbery | 0 | 0.0 | 63.0 | 61.0 |
| Aggravated Assault | 13 | 265.2 | 350.5 | 256.0 |
| Property Crime | 147 | 2,998.8 | 2,592.8 | 1,760.0 |
| Burglary | 10 | 204.0 | 348.0 | 229.0 |
| Larceny | 136 | 2,774.4 | 1,754.2 | 1,272.0 |
| Car Theft | 1 | 20.4 | 490.6 | 259.0 |
Breckenridge, CO Cost Of Living
Cost of living in Breckenridge summary. We use data on the cost of living to determine how expensive it is to live in Breckenridge. Real estate prices drive most of the variance in cost of living around Colorado. Key points include:
The cost of living in Breckenridge is 135 with 100 being average.
The cost of living in Breckenridge is 1.4x higher than the national average.
The median home value in Breckenridge is $1,174,962.
The median income in Breckenridge is $132,666.
Breckenridge's Overall Cost Of Living
Higher Than The National Average
Cost Of Living In Breckenridge Comparison Table
| Living Expense | Breckenridge | Colorado | National Average | |
|---|---|---|---|---|
| Overall | 135 | 111 | 100 | |
| Services | 105 | 102 | 100 | |
| Groceries | 95 | 103 | 100 | |
| Health | 90 | 101 | 100 | |
| Housing | 219 | 134 | 100 | |
| Transportation | 107 | 107 | 100 | |
| Utilities | 89 | 89 | 100 | |
Breckenridge, CO Weather
The average high in Breckenridge is 50.8° and the average low is 22.2°.
There are 51.8 days of precipitation each year.
Expect an average of 18.0 inches of precipitation each year with 146.6 inches of snow.
| Stat | Breckenridge |
|---|---|
| Average Annual High | 50.8 |
| Average Annual Low | 22.2 |
| Annual Precipitation Days | 51.8 |
| Average Annual Precipitation | 18.0 |
| Average Annual Snowfall | 146.6 |
Average High
Days of Rain
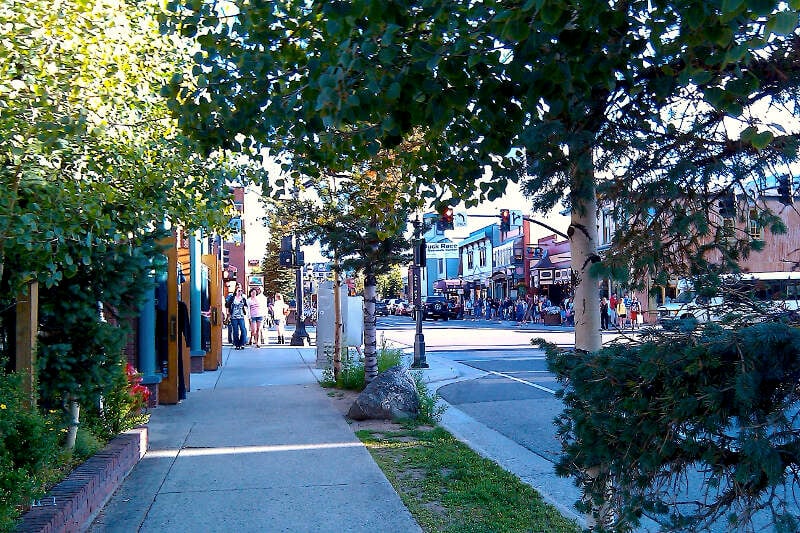
Breckenridge, CO Photos


Rankings for Breckenridge in Colorado


Locations Around Breckenridge
Map Of Breckenridge, CO
Best Places Around Breckenridge
Central, LA
Population 29,603
Golden, CO
Population 20,467
Vail, CO
Population 4,729
Edwards, CO
Population 10,415
Avon, CO
Population 6,057
Aspen, CO
Population 6,862
Evergreen, CO
Population 8,643
Applewood, CO
Population 8,120
Eagle, CO
Population 7,479
Gypsum, CO
Population 8,481
Breckenridge Demographics And Statistics
Population over time in Breckenridge
The current population in Breckenridge is 5,001. The population has increased 18.4% from 2010.
| Year | Population | % Change |
|---|---|---|
| 2023 | 5,001 | -0.3% |
| 2022 | 5,017 | -1.4% |
| 2021 | 5,086 | 0.6% |
| 2020 | 5,054 | 2.3% |
| 2019 | 4,938 | 0.0% |
| 2018 | 4,936 | 2.1% |
| 2017 | 4,833 | 2.1% |
| 2016 | 4,732 | 1.1% |
| 2015 | 4,682 | 1.7% |
| 2014 | 4,604 | 1.4% |
| 2013 | 4,542 | 2.0% |
| 2012 | 4,452 | 2.3% |
| 2011 | 4,351 | 3.0% |
| 2010 | 4,224 | - |
Race / Ethnicity in Breckenridge
Breckenridge is:
81.0% White with 4,051 White residents.
0.3% African American with 13 African American residents.
0.3% American Indian with 15 American Indian residents.
0.9% Asian with 46 Asian residents.
2.4% Hawaiian with 118 Hawaiian residents.
0.6% Other with 32 Other residents.
9.6% Two Or More with 482 Two Or More residents.
4.9% Hispanic with 244 Hispanic residents.
| Race | Breckenridge | CO | USA |
|---|---|---|---|
| White | 81.0% | 65.7% | 58.2% |
| African American | 0.3% | 3.8% | 12.0% |
| American Indian | 0.3% | 0.4% | 0.5% |
| Asian | 0.9% | 3.2% | 5.7% |
| Hawaiian | 2.4% | 0.1% | 0.2% |
| Other | 0.6% | 0.4% | 0.5% |
| Two Or More | 9.6% | 4.2% | 3.9% |
| Hispanic | 4.9% | 22.2% | 19.0% |
Gender in Breckenridge
Breckenridge is 44.3% female with 2,213 female residents.
Breckenridge is 55.7% male with 2,788 male residents.
| Gender | Breckenridge | CO | USA |
|---|---|---|---|
| Female | 44.3% | 49.4% | 50.5% |
| Male | 55.7% | 50.6% | 49.5% |
Highest level of educational attainment in Breckenridge for adults over 25
1.0% of adults in Breckenridge completed < 9th grade.
0.0% of adults in Breckenridge completed 9-12th grade.
13.0% of adults in Breckenridge completed high school / ged.
21.0% of adults in Breckenridge completed some college.
4.0% of adults in Breckenridge completed associate's degree.
40.0% of adults in Breckenridge completed bachelor's degree.
13.0% of adults in Breckenridge completed master's degree.
5.0% of adults in Breckenridge completed professional degree.
3.0% of adults in Breckenridge completed doctorate degree.
| Education | Breckenridge | CO | USA |
|---|---|---|---|
| < 9th Grade | 1.0% | 2.0% | 5.0% |
| 9-12th Grade | 0.0% | 4.0% | 6.0% |
| High School / GED | 13.0% | 20.0% | 26.0% |
| Some College | 21.0% | 20.0% | 19.0% |
| Associate's Degree | 4.0% | 8.0% | 9.0% |
| Bachelor's Degree | 40.0% | 28.0% | 21.0% |
| Master's Degree | 13.0% | 13.0% | 10.0% |
| Professional Degree | 5.0% | 3.0% | 2.0% |
| Doctorate Degree | 3.0% | 2.0% | 2.0% |
Household Income For Breckenridge, Colorado
2.8% of households in Breckenridge earn Less than $10,000.
0.0% of households in Breckenridge earn $10,000 to $14,999.
6.9% of households in Breckenridge earn $15,000 to $24,999.
4.9% of households in Breckenridge earn $25,000 to $34,999.
6.7% of households in Breckenridge earn $35,000 to $49,999.
18.4% of households in Breckenridge earn $50,000 to $74,999.
4.5% of households in Breckenridge earn $75,000 to $99,999.
17.6% of households in Breckenridge earn $100,000 to $149,999.
15.4% of households in Breckenridge earn $150,000 to $199,999.
22.9% of households in Breckenridge earn $200,000 or more.
| Income | Breckenridge | CO | USA |
|---|---|---|---|
| Less than $10,000 | 2.8% | 3.9% | 4.9% |
| $10,000 to $14,999 | 0.0% | 2.6% | 3.6% |
| $15,000 to $24,999 | 6.9% | 5.0% | 6.6% |
| $25,000 to $34,999 | 4.9% | 5.3% | 6.8% |
| $35,000 to $49,999 | 6.7% | 8.9% | 10.4% |
| $50,000 to $74,999 | 18.4% | 15.0% | 15.7% |
| $75,000 to $99,999 | 4.5% | 13.0% | 12.7% |
| $100,000 to $149,999 | 17.6% | 19.3% | 17.4% |
| $150,000 to $199,999 | 15.4% | 11.3% | 9.3% |
| $200,000 or more | 22.9% | 15.8% | 12.6% |


