Austinvs.Dallas Which City Is Right for You in 2026?
A head-to-head guide to cost of living, jobs, transportation, weather, crime, and quality of life — so you can decide where to live, work, or visit.
Updated 2026-05-26 · By HomeSnacks Editorial
Austin vs. Dallas at a glance
Austin, TX and Dallas, TX sit at very different points on the U.S. map — and the numbers reflect it. Austin is the capital city of the U.S. state of Texas. With a population of 961,855 at the 2020 census, it is the 12th-most populous city in the U.S., fifth-most populous city in Texas, and second-most populous U.S. Dallas is a city in the U.S. state of Texas. Located in the state's northern region, it is the ninth-most populous city in the United States and third-most populous city in Texas, with a population of 1.3 million at the 2020 census.
On cost of living, Dallas is the cheaper city: its overall index sits at 106 versus 124 in Austin (100 = national average). Median home values run $508,530 in Austin and $309,420 in Dallas, with median rents at $1,729 and $1,472 respectively. That puts the home-value-to-income ratio at 5.4x in Austin versus 4.4x in Dallas.
Crime data tells a different story. Austin reports 3,709 total crimes per 100,000 residents annually versus 4,010 in Dallas. Dallas is the more racially diverse of the two on a Herfindahl index basis — Austin skews 47% White while Dallas skews 43% Hispanic. On HomeSnacks' overall SnackAbility score, Austin edges ahead at 7/10 versus 5/10 for Dallas.
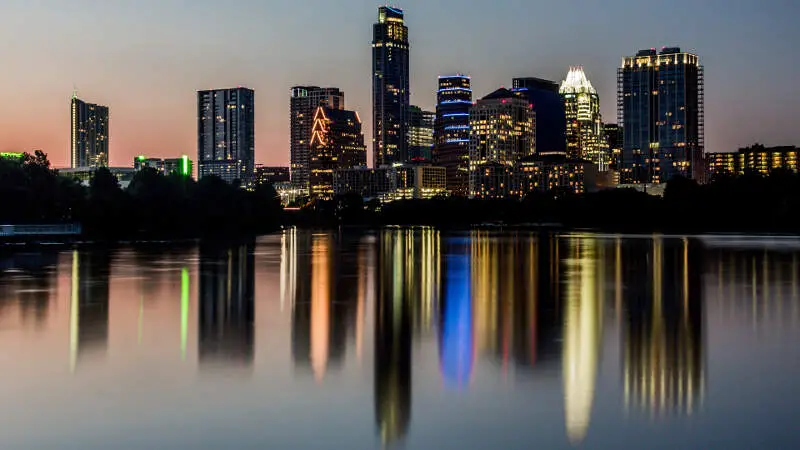
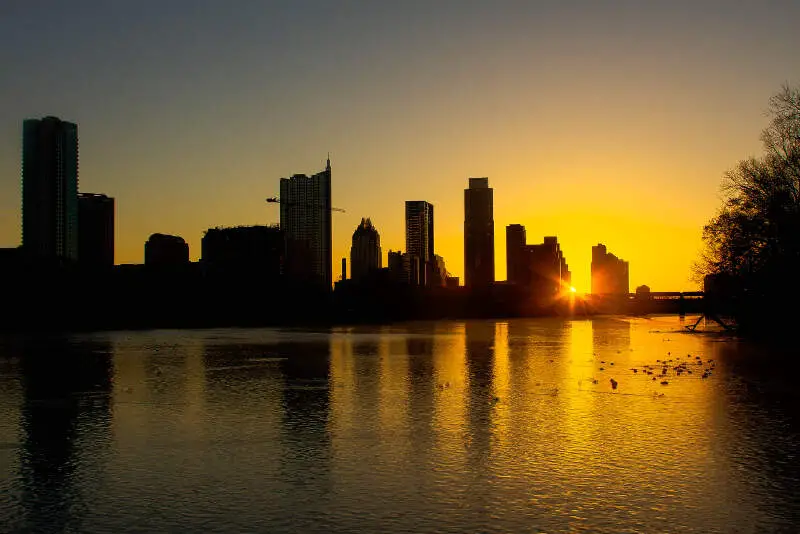
Austin vs. Dallas in photos
A side-by-side look at each city.


Cost of living
Dallas is the cheaper city overall — 17% higher in Austin than its rival. Index baseline: 100 = national average.
| Living expense | Austin | Dallas | US average |
|---|---|---|---|
| Overall | 124 | 106 | 100 |
| Services | 99 | 102 | 100 |
| Groceries | 101 | 103 | 100 |
| Health | 185 | 115 | 100 |
| Housing | 98 | 106 | 100 |
| Transportation | 109 | 108 | 100 |
| Utilities | 104 | 104 | 100 |
Lower index = cheaper. 100 = U.S. national average. Bar inside each cell scales relative to the highest value in the table.
Sources: HomeSnacks Cost of Living indices, normalized so 100 = U.S. national average. Drill in: Austin cost of living, Dallas cost of living, or the cheapest cities in America.
Housing breakdown
Home prices are higher in Austin. Compare absolute price and price-to-income — a $500k home in a $100k-income city is very different from one in a $50k-income city.
| Metric | Austin | Dallas | United States |
|---|---|---|---|
| Median Home Value | $508,530 | $309,420 | $332,700 |
| Median Rent | $1,729 | $1,472 | $1,413 |
| Median Income | $93,658 | $70,518 | $80,734 |
| Home Value To Income | 5.4x | 4.4x | 4.1x |
| Rent To Monthly Income | 0.22x | 0.25x | 0.21x |
Source: U.S. Census Bureau ACS 2020-2024. See also states with the highest rent in America.
Crime
Austin is the safer city — total crime rate of 3,709 per 100k people vs 4,010 for Dallas. US average: 2,119.
| Crime (per 100k) | Austin | Dallas | US average |
|---|---|---|---|
| Total crime | 3,709 | 4,010 | 2,119 |
| Murder | 7 | 14 | 5 |
| Robbery | 85 | 169 | 61 |
| Aggravated Assault | 307 | 440 | 256 |
| Violent Crime | 467 | 658 | 359 |
| Burglary | 445 | 464 | 229 |
| Larceny | 2,198 | 1,787 | 1,272 |
| Car Theft | 599 | 1,100 | 259 |
| Property Crime | 3,242 | 3,352 | 1,760 |
Lower = safer. Bar inside each cell scales relative to the highest crime rate in the table.
Source: FBI Uniform Crime Reporting (2024). All rates are per 100,000 people. City pages: Austin crime, Dallas crime. See also: safest cities in America.
Diversity
Dallas is more racially diverse — lower HHI (closer to 0) means a more even mix across groups.
| Group | Austin | Dallas | United States |
|---|---|---|---|
| White | 47.0% | 27.6% | 57.4% |
| African American | 7.3% | 22.9% | 11.9% |
| American Indian | 0.1% | 0.2% | 0.5% |
| Asian | 9.0% | 3.8% | 5.9% |
| Hawaiian | 0.0% | 0.1% | 0.2% |
| Other | 0.5% | 0.3% | 0.6% |
| Two Or More | 4.3% | 2.6% | 4.3% |
| Hispanic | 31.9% | 42.6% | 19.3% |
Source: U.S. Census ACS 2020-2024. Lower HHI = more even racial mix. See also: most diverse cities in America.
SnackAbility — overall quality of life
Austin scores higher overall — 7/10 vs 5/10. SnackAbility is our 1–10 quality-of-life score; the median U.S. city scores a 7.
SnackAbility is a HomeSnacks proprietary 1–10 score blending jobs, housing, education, commute, amenities, affordability, crime, and diversity. Median U.S. city ≈ 7. Data: Census, BLS, FBI. See also: best places to live in America.
Getting around: Austin vs. Dallas
How each city handles commuting, transit, walkability, and car culture — the day-to-day reality that shapes where you'd actually want to live.
Getting around Austin means you'll probably be in a car most of the time. Capital Metro runs buses and a single MetroRail line (the Red Line) connecting downtown to the northern suburbs, but the network is thin compared to larger metros.
I-35 cuts through the heart of the city and ranks among the most congested corridors in Texas. If you commute by car during rush hour, budget extra time: there's no easy shortcut through downtown.
Dallas has meaningfully more transit infrastructure. DART's light rail spans roughly 93 miles across four lines, connecting downtown to suburbs like Plano, Irving, and Garland, which is useful if you live and work near a station.
Dallas also sits on a more navigable highway grid. Traffic on I-635 and the LBJ Freeway gets ugly, but the city's sprawl gives you multiple routing options. Neither city is walkable by default, but Dallas edges Austin on getting around without a car.
Jobs and careers in Austin vs. Dallas
The local job market, dominant industries, and which city to choose based on your career.
Austin's job market has shifted heavily toward tech. Dell and Apple have long anchored the local economy, and Tesla, Oracle, Samsung, and Google have since added major campuses or relocated headquarters here.
That concentration of high-paying tech and engineering roles pushes the median household income to $93,658, well above the national average. The tradeoff is a cost of living index of 124, meaning your paycheck doesn't stretch as far as it looks at the grocery store or closing table.
Dallas runs a broader, more diversified economy: AT&T is headquartered here, along with American Airlines, Toyota's North American HQ, and a dense cluster of financial services, healthcare, and energy firms.
Median household income sits at $70,518, lower than Austin's, but a cost of living index of 106 (much closer to the national average) means purchasing power isn't as far apart as the raw numbers suggest. If your field is finance, logistics, or healthcare administration, Dallas tends to have more employers competing for that talent.
Weather and climate
What to expect day-to-day — sun, fog, heat, rain, and the seasonal extremes that shape the lifestyle.
Austin sits in Central Texas hill country, which gives it a slightly more temperate baseline than Dallas. Summers are brutally hot (triple digits from June through August are routine), but winters are generally mild, with only occasional ice storms that shut the city down when they hit.
Spring and fall are genuinely pleasant, and the area gets enough sun year-round to keep outdoor activity viable most months.
Dallas sits further north, deeper into the Southern Plains, which means more dramatic temperature swings. Summers are equally punishing, often reaching 100°F or above, and winters bring more frequent freezes.
The city is also within range of Tornado Alley, so severe spring storm season is real. Humidity is a factor in both cities during summer, though Dallas can feel stickier. Austin's position on the Edwards Plateau offers a slight buffer from extreme weather, but neither city is a refuge from Texas summer heat.
Culture, nightlife, and entertainment
Food, music, neighborhoods, and the city vibe that gives each place its personality.
Austin's reputation as the Live Music Capital of the World holds up. On any given weekend, 6th Street, Rainey Street, and the Red River Cultural District are packed with live performances across every genre. SXSW and the Austin City Limits Music Festival draw international crowds each year.
The city's "Keep Austin Weird" identity shapes everything from the independent restaurant scene on South Congress to its local brewery culture. The vibe skews younger and more countercultural, which you'll either love or find exhausting depending on your taste.
Dallas leans more cosmopolitan. The Arts District in Uptown is one of the largest contiguous arts districts in the country, anchored by the AT&T Performing Arts Center and the Dallas Museum of Art.
Deep Ellum is the main spot for live music and late-night bars, while Bishop Arts District draws a younger crowd with independent boutiques and cocktail bars. Dallas also has four major professional sports teams (the Cowboys, Mavericks, Rangers, and Stars), a sports-culture depth that Austin, without an NFL or NBA franchise, can't match.
Outdoor activities and day trips
Parks, beaches, hikes, and the weekend escapes that define life outside the city limits.
Austin's outdoor scene is defined by water. Barton Springs Pool, fed by natural springs in Zilker Park, is a local institution for summer swimming. Lady Bird Lake runs through the center of the city, lined with hike-and-bike trails used daily by commuters and recreational runners.
The Barton Creek Greenbelt offers miles of rugged trail with swimming holes just minutes from downtown. For bigger day trips, the Texas Hill Country is close: Enchanted Rock State Natural Area and Pedernales Falls State Park are both under two hours away.
Dallas works with flatter, drier terrain but makes good use of it. White Rock Lake anchors a popular 9-mile trail loop on the east side, and the Katy Trail cuts through Uptown for urban running and cycling.
Lake Lewisville and Lake Ray Hubbard are short drives away for boating and fishing. The best day trip from Dallas is Palo Duro Canyon, about 2.5 hours west: it's the second-largest canyon in the US and a legitimate hiking and camping destination that most people outside Texas have no idea exists.
Bottom line: which city is right for you?
Based on the head-to-head data above, here's the short version — pick the city that lines up with what you actually care about.
Choose Austin if you prioritize…
- lower crime — a safer place to live, work, and raise a family.
- more affordable housing relative to Dallas.
- a higher overall SnackAbility quality-of-life score.
Choose Dallas if you prioritize…
- a lower cost of living (cheaper groceries, services, and day-to-day expenses).
- a more racially diverse community (lower HHI on Census data).
Methodology: winners are picked from public data — U.S. Census Bureau ACS (income, home value, rent, race/HHI), FBI Uniform Crime Reporting (crime rates per 100k), and HomeSnacks' proprietary SnackAbility quality-of-life score, which blends Bureau of Labor Statistics data with the above.
More about Texas

Best Places To Live In Texas
Photo: Public domain
Cheapest Places To Live In Texas
Photo: Public domain
Most Dangerous Places In Texas
Photo: Public domain
Best Places To Raise A Family In Texas
Photo: Public domain
Best Places To Retire In Texas
Photo: Public domain
Richest Cities In Texas
Photo: Public domain
Safest Places In Texas
Photo: Public domain
Worst Places To Live In Texas
Photo: Public domain