Oaklandvs.San Francisco Which City Is Right for You in 2026?
A head-to-head guide to cost of living, jobs, transportation, weather, crime, and quality of life — so you can decide where to live, work, or visit.
Updated 2026-05-26 · By HomeSnacks Editorial
Oakland vs. San Francisco at a glance
If you're weighing Oakland, CA against San Francisco, CA, you're really weighing two different versions of American life. Oakland is a city in the East Bay region of the San Francisco Bay Area in the U.S. state of California. It is the county seat of and the most populous city in Alameda County, California, with a population of 440,646 in 2020. San Francisco, officially the City and County of San Francisco, is the fourth-most populous city in California and the 17th-most populous in the United States, with a population of 826,079 in 2025. Among U.S.
On cost of living, Oakland is the cheaper city: its overall index sits at 190 versus 247 in San Francisco (100 = national average). Median home values run $716,248 in Oakland and $1,356,661 in San Francisco, with median rents at $1,979 and $2,476 respectively. That puts the home-value-to-income ratio at 7.0x in Oakland versus 9.6x in San Francisco.
FBI crime data adds another wrinkle. San Francisco reports 4,526 total crimes per 100,000 residents annually versus 9,156 in Oakland. Oakland is the more racially diverse of the two on a Herfindahl index basis — Oakland skews 29% Hispanic while San Francisco skews 37% White. On HomeSnacks' overall SnackAbility score, San Francisco edges ahead at 8.5/10 versus 7/10 for Oakland.
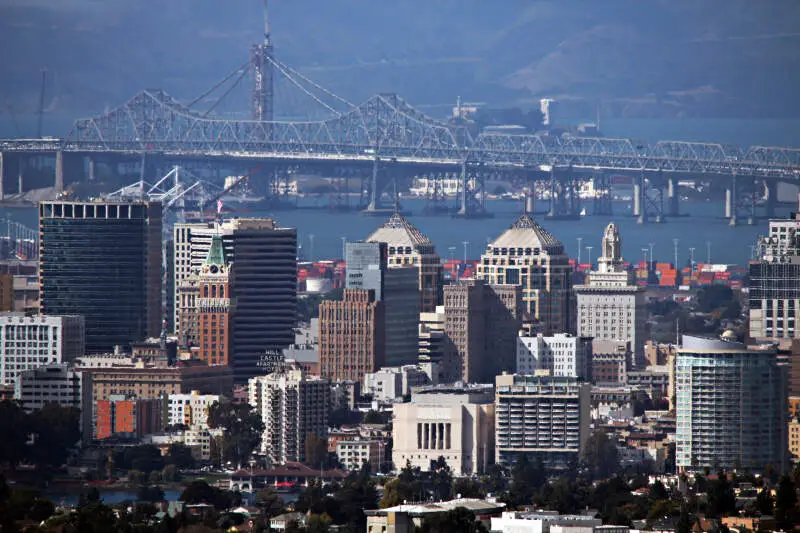
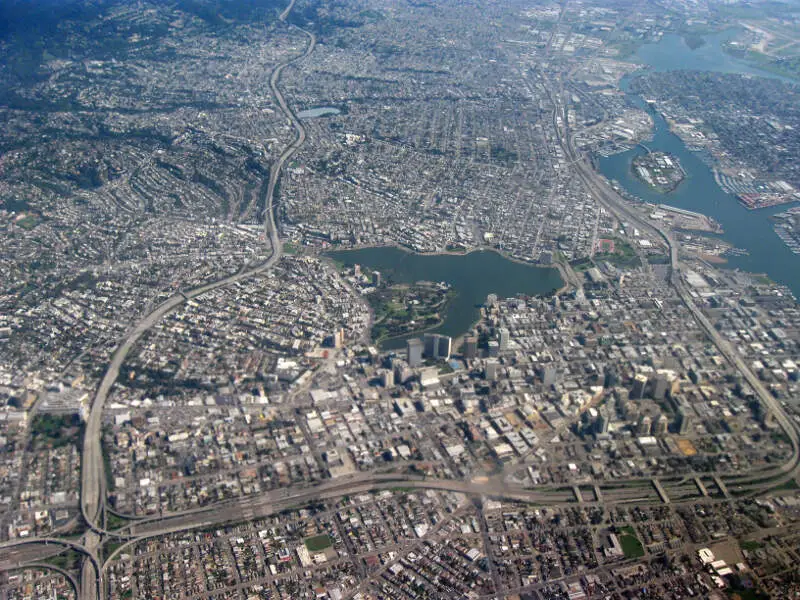
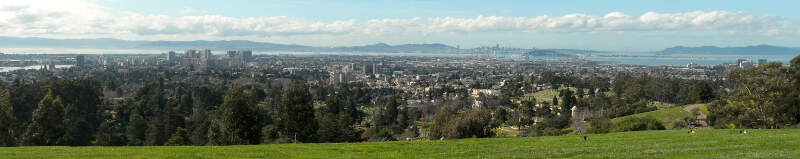
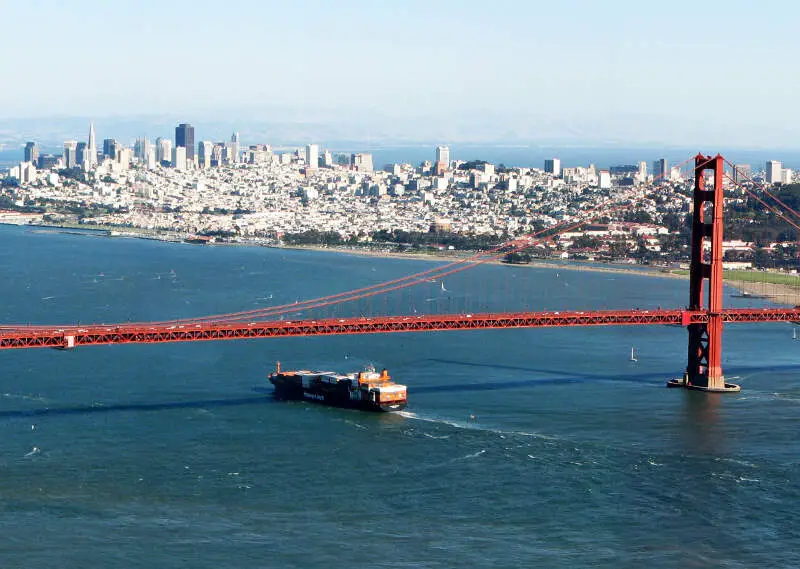
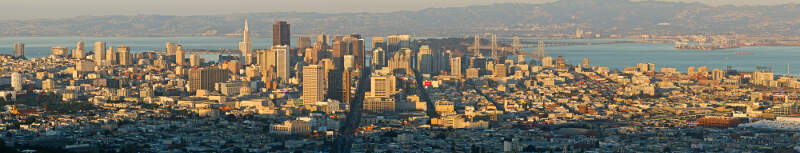
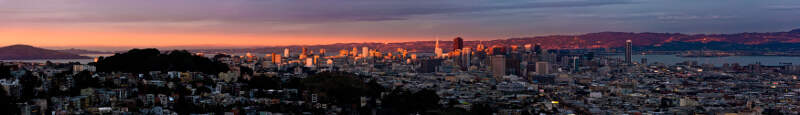
Oakland vs. San Francisco in photos
A side-by-side look at each city.
Cost of living
Oakland is the cheaper city overall — 23% higher in San Francisco than its rival. Index baseline: 100 = national average.
| Living expense | Oakland | San Francisco | US average |
|---|---|---|---|
| Overall | 190 | 247 | 100 |
| Services | 115 | 122 | 100 |
| Groceries | 121 | 125 | 100 |
| Health | 334 | 518 | 100 |
| Housing | 128 | 132 | 100 |
| Transportation | 124 | 128 | 100 |
| Utilities | 134 | 139 | 100 |
Lower index = cheaper. 100 = U.S. national average. Bar inside each cell scales relative to the highest value in the table.
Sources: HomeSnacks Cost of Living indices, normalized so 100 = U.S. national average. Drill in: Oakland cost of living, San Francisco cost of living, or the cheapest cities in America.
Housing breakdown
Home prices are higher in Oakland. Compare absolute price and price-to-income — a $500k home in a $100k-income city is very different from one in a $50k-income city.
| Metric | Oakland | San Francisco | United States |
|---|---|---|---|
| Median Home Value | $716,248 | $1,356,661 | $332,700 |
| Median Rent | $1,979 | $2,476 | $1,413 |
| Median Income | $101,600 | $140,970 | $80,734 |
| Home Value To Income | 7.0x | 9.6x | 4.1x |
| Rent To Monthly Income | 0.23x | 0.21x | 0.21x |
Source: U.S. Census Bureau ACS 2020-2024. See also states with the highest rent in America.
Crime
San Francisco is the safer city — total crime rate of 4,526 per 100k people vs 9,156 for Oakland. US average: 2,119.
| Crime (per 100k) | Oakland | San Francisco | US average |
|---|---|---|---|
| Total crime | 9,156 | 4,526 | 2,119 |
| Murder | 19 | 4 | 5 |
| Robbery | 680 | 267 | 61 |
| Aggravated Assault | 1,158 | 290 | 256 |
| Violent Crime | 1,925 | 596 | 359 |
| Burglary | 787 | 637 | 229 |
| Larceny | 4,165 | 2,619 | 1,272 |
| Car Theft | 2,279 | 673 | 259 |
| Property Crime | 7,230 | 3,929 | 1,760 |
Lower = safer. Bar inside each cell scales relative to the highest crime rate in the table.
Source: FBI Uniform Crime Reporting (2024). All rates are per 100,000 people. City pages: Oakland crime, San Francisco crime. See also: safest cities in America.
Diversity
Oakland is more racially diverse — lower HHI (closer to 0) means a more even mix across groups.
| Group | Oakland | San Francisco | United States |
|---|---|---|---|
| White | 27.8% | 36.8% | 57.4% |
| African American | 19.7% | 4.7% | 11.9% |
| American Indian | 0.3% | 0.2% | 0.5% |
| Asian | 15.7% | 34.9% | 5.9% |
| Hawaiian | 0.4% | 0.3% | 0.2% |
| Other | 0.9% | 0.8% | 0.6% |
| Two Or More | 6.6% | 6.1% | 4.3% |
| Hispanic | 28.7% | 16.2% | 19.3% |
Source: U.S. Census ACS 2020-2024. Lower HHI = more even racial mix. See also: most diverse cities in America.
SnackAbility — overall quality of life
San Francisco scores higher overall — 8.5/10 vs 7/10. SnackAbility is our 1–10 quality-of-life score; the median U.S. city scores a 7.
SnackAbility is a HomeSnacks proprietary 1–10 score blending jobs, housing, education, commute, amenities, affordability, crime, and diversity. Median U.S. city ≈ 7. Data: Census, BLS, FBI. See also: best places to live in America.
Getting around: Oakland vs. San Francisco
How each city handles commuting, transit, walkability, and car culture — the day-to-day reality that shapes where you'd actually want to live.
Both cities sit on opposite ends of the Bay Bridge, which shapes how residents get around. In San Francisco, you can realistically go car-free. Muni's network of buses, light rail, and cable cars covers most neighborhoods, and BART reaches the East Bay, SFO, and the Peninsula.
Biking is aggressive in spots (Nob Hill and Twin Peaks earn their reputation), but flat corridors like the Wiggle make two-wheel commuting practical. Ferry service from the Ferry Building adds a scenic option to Marin and the East Bay.
Oakland is more car-dependent day to day, though BART runs through downtown at 12th Street and 19th Street stations and connects to San Francisco in under 15 minutes. AC Transit handles local bus routes, and the city's flatter terrain makes cycling to the BART station a workable last-mile option. If you commute into SF from Oakland, budget for a Clipper card or regional transit pass: the ride is fast, but the Bay Area's layered transit fares add up.
Either way, expect rush-hour Bay Bridge traffic to be genuinely painful if you drive.
Jobs and careers in Oakland vs. San Francisco
The local job market, dominant industries, and which city to choose based on your career.
San Francisco remains the economic core of the Bay Area tech economy. Corporate headquarters, venture-backed startups, and professional services firms are packed into SoMa, the Financial District, and Mission Bay. That concentration pushes median household income to $140,970, and talent competition keeps salaries high across tech, finance, healthcare, and legal sectors.
The flip side is a cost of living index of 247 against the US average: your paycheck goes further on paper than it does at the grocery store.
Oakland, at a median household income of $101,600 and a cost of living index of 190, offers a meaningful value trade-off. Major employers include Kaiser Permanente, whose national headquarters anchors the city, along with Clorox, UCSF Benioff Children's Hospital Oakland, and the Port of Oakland, one of the busiest container ports on the West Coast. The startup scene in the Uptown corridor has matured, and remote workers priced out of SF have made Oakland a genuine alternative rather than just a bedroom community.
If your employer offers location flexibility, the rent savings alone (median rent of $1,979 versus San Francisco's $2,476) change the math quickly.
Weather and climate
What to expect day-to-day — sun, fog, heat, rain, and the seasonal extremes that shape the lifestyle.
The Bay divides these two cities by only a few miles, but it carves a notable climate gap. San Francisco is famous for Karl the Fog, the marine layer that rolls in through the Golden Gate each summer. It can keep neighborhoods like the Outer Sunset and Inner Richmond gray and in the low 60s well into August.
Winters are mild and wet, rarely dipping below 45°F, but the fog-driven chill is real year-round. The Mission District and the eastern slopes catch more sun than the western side, so your specific neighborhood matters a lot.
Oakland sits on the eastern shore of the Bay and sees substantially more sunshine. The hills block some of the marine influence, and summer afternoons in Temescal or Piedmont routinely hit the low 70s while SF residents are reaching for a jacket. Annual rainfall is similar, roughly 20 inches, with most falling between November and March.
Both cities avoid extreme cold and extreme heat by most standards. If consistent sunshine is a priority for you, Oakland wins that comparison. The East Bay's warm, dry summers are a genuine lifestyle difference.
Culture, nightlife, and entertainment
Food, music, neighborhoods, and the city vibe that gives each place its personality.
San Francisco punches above its population weight culturally. The Castro, Haight-Ashbury, Chinatown, and North Beach are living neighborhoods with layered histories that shape the city's identity. The symphony, ballet, Opera House, and SFMOMA anchor a formal arts scene, while smaller venues like the Fillmore and the Independent keep the live-music calendar dense.
Late-night options stretch across the Mission's bar row on Valencia Street and the SoMa club corridor, though the nightlife scene has contracted since the pandemic reshuffled commercial real estate.
Oakland's cultural identity is grounded and less polished, which is precisely the appeal for a lot of people. The Fox Theater on Telegraph Avenue hosts touring acts in a beautifully restored 1928 venue, and the Paramount Theatre next door is one of the finest Art Deco buildings in the country. The Uptown neighborhood's gallery scene, the Fruitvale District's murals and restaurants, and Jack London Square's waterfront dining give you distinct neighborhoods with actual texture.
Oakland has a deep hip-hop and funk heritage that still surfaces in local venues. If you want a city where culture feels earned rather than curated, Oakland is the pick.
Outdoor activities and day trips
Parks, beaches, hikes, and the weekend escapes that define life outside the city limits.
Golden Gate Park is San Francisco's headline: 1,017 acres with a bison paddock, two world-class museums, a botanical garden, and weekend car-free roads that fill with cyclists and roller skaters. Ocean Beach and Crissy Field give you actual ocean access, and the Marin Headlands are a 20-minute drive across the Golden Gate Bridge for serious hiking with views of the bay. Day trips to Point Reyes National Seashore put wilderness coast within reach in under two hours.
Oakland's outdoor scene is less celebrated but more accessible for everyday use. Lake Merritt, a tidal lagoon ringed by a 3.4-mile walking path in the middle of the city, is the city's backyard: kayak rentals, picnic areas, and a weekly farmers market keep it busy on weekends. The East Bay Regional Park District manages over 73 parks covering 125,000 acres, including Redwood Regional Park and Tilden Regional Park up in the hills, both within 20 minutes of downtown Oakland.
For trail runners and mountain bikers who want to get out before work, that proximity to East Bay hills gives Oakland residents a practical edge over SF commuters navigating city traffic to reach the same trailheads.
Bottom line: which city is right for you?
Based on the head-to-head data above, here's the short version — pick the city that lines up with what you actually care about.
Choose Oakland if you prioritize…
- a lower cost of living (cheaper groceries, services, and day-to-day expenses).
- more affordable housing relative to San Francisco.
- a more racially diverse community (lower HHI on Census data).
Choose San Francisco if you prioritize…
- lower crime — a safer place to live, work, and raise a family.
- a higher overall SnackAbility quality-of-life score.
Methodology: winners are picked from public data — U.S. Census Bureau ACS (income, home value, rent, race/HHI), FBI Uniform Crime Reporting (crime rates per 100k), and HomeSnacks' proprietary SnackAbility quality-of-life score, which blends Bureau of Labor Statistics data with the above.
More about California

Best Places To Live In California
Photo: Public domain
Cheapest Places To Live In California
Photo: Public domain
Most Dangerous Cities In California
Photo: Public domain
Best Places To Raise A Family In California
Photo: Public domain
Best Places To Retire In California
Photo: Public domain
Richest Cities In California
Photo: Public domain
Safest Places In California
Photo: Public domain
Worst Places To Live In California
Photo: Public domain