San Josevs.Oakland Which City Is Right for You in 2026?
A head-to-head guide to cost of living, jobs, transportation, weather, crime, and quality of life — so you can decide where to live, work, or visit.
Updated 2026-05-26 · By HomeSnacks Editorial
San Jose vs. Oakland at a glance
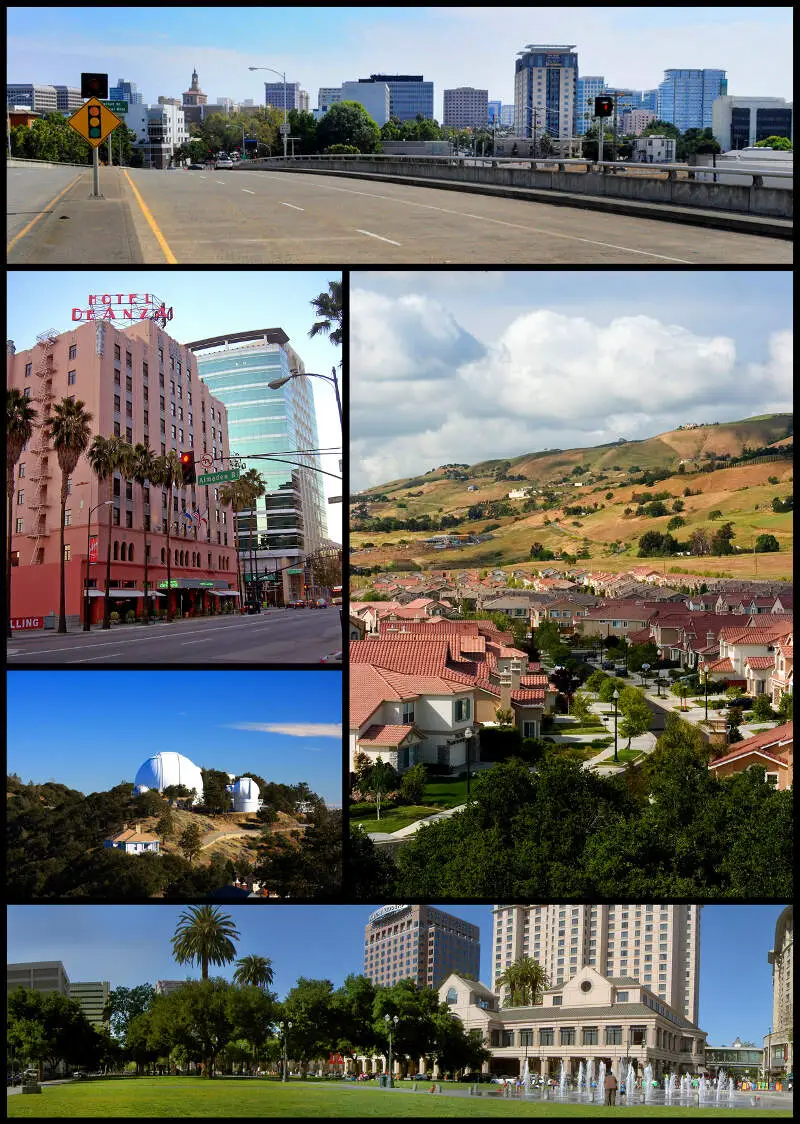
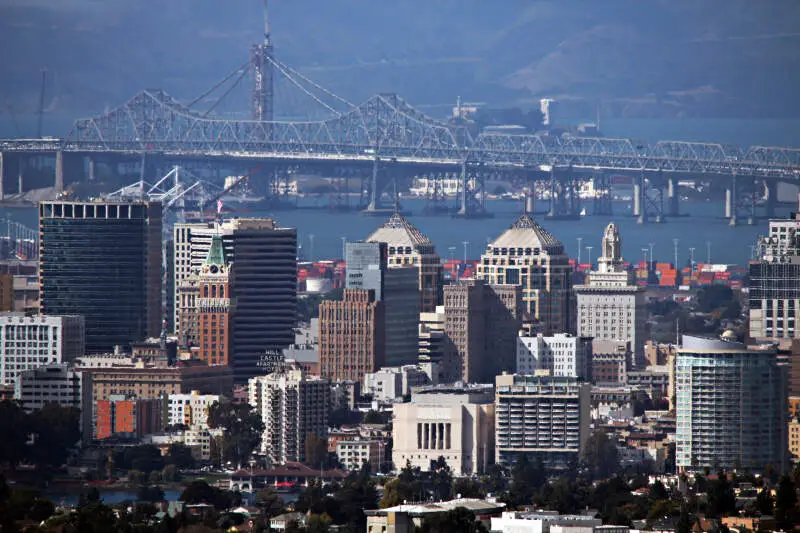
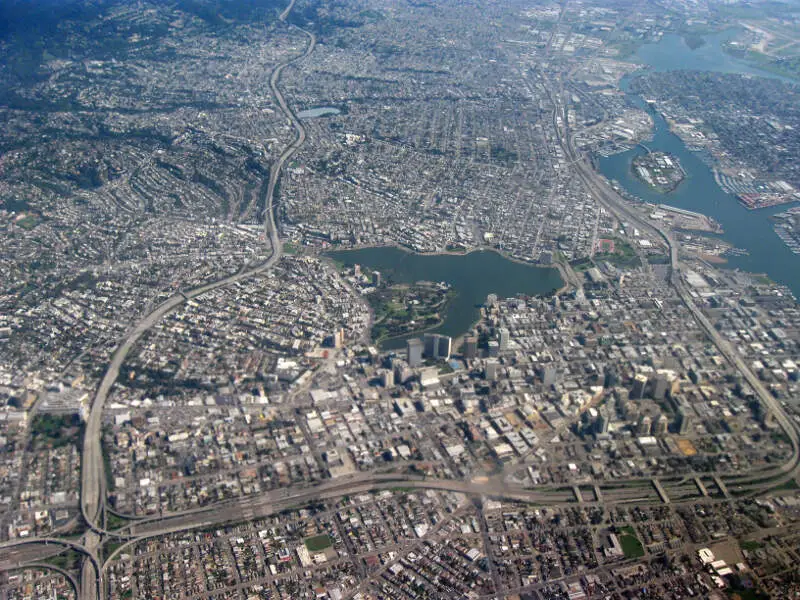
San Jose, CA and Oakland, CA are frequently compared, and for good reason — they offer very different lifestyles at very different price points. San Jose, officially the City of San José, is the most populous city in the San Francisco Bay Area and Northern California, and the 13th-most populous in the United States, with 997,368 residents. Oakland is a city in the East Bay region of the San Francisco Bay Area in the U.S. state of California. It is the county seat of and the most populous city in Alameda County, California, with a population of 440,646 in 2020.
On cost of living, Oakland is the cheaper city: its overall index sits at 190 versus 216 in San Jose (100 = national average). Median home values run $1,463,614 in San Jose and $716,248 in Oakland, with median rents at $2,669 and $1,979 respectively. That puts the home-value-to-income ratio at 10.0x in San Jose versus 7.0x in Oakland.
Public safety is another point of divergence. San Jose reports 3,195 total crimes per 100,000 residents annually versus 9,156 in Oakland. Oakland is the more racially diverse of the two on a Herfindahl index basis — San Jose skews 39% Asian while Oakland skews 29% Hispanic. On HomeSnacks' overall SnackAbility score, San Jose edges ahead at 8.5/10 versus 7/10 for Oakland.
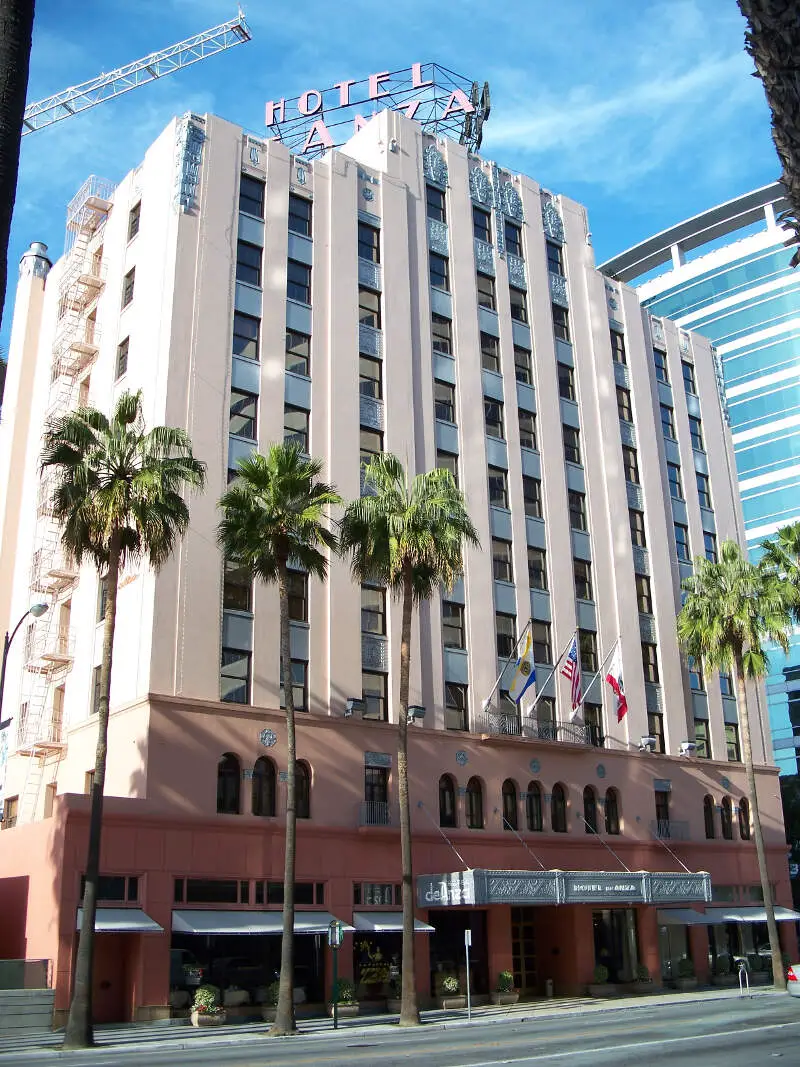
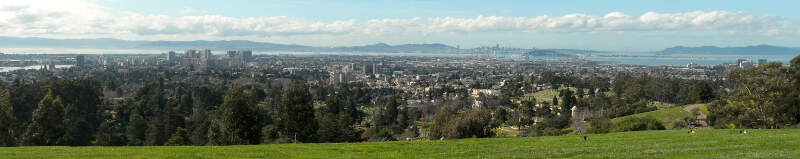
San Jose vs. Oakland in photos
A side-by-side look at each city.

Cost of living
Oakland is the cheaper city overall — 14% higher in San Jose than its rival. Index baseline: 100 = national average.
| Living expense | San Jose | Oakland | US average |
|---|---|---|---|
| Overall | 216 | 190 | 100 |
| Services | 119 | 115 | 100 |
| Groceries | 125 | 121 | 100 |
| Health | 425 | 334 | 100 |
| Housing | 135 | 128 | 100 |
| Transportation | 132 | 124 | 100 |
| Utilities | 136 | 134 | 100 |
Lower index = cheaper. 100 = U.S. national average. Bar inside each cell scales relative to the highest value in the table.
Sources: HomeSnacks Cost of Living indices, normalized so 100 = U.S. national average. Drill in: San Jose cost of living, Oakland cost of living, or the cheapest cities in America.
Housing breakdown
Home prices are higher in Oakland. Compare absolute price and price-to-income — a $500k home in a $100k-income city is very different from one in a $50k-income city.
| Metric | San Jose | Oakland | United States |
|---|---|---|---|
| Median Home Value | $1,463,614 | $716,248 | $332,700 |
| Median Rent | $2,669 | $1,979 | $1,413 |
| Median Income | $146,427 | $101,600 | $80,734 |
| Home Value To Income | 10.0x | 7.0x | 4.1x |
| Rent To Monthly Income | 0.22x | 0.23x | 0.21x |
Source: U.S. Census Bureau ACS 2020-2024. See also states with the highest rent in America.
Crime
San Jose is the safer city — total crime rate of 3,195 per 100k people vs 9,156 for Oakland. US average: 2,119.
| Crime (per 100k) | San Jose | Oakland | US average |
|---|---|---|---|
| Total crime | 3,195 | 9,156 | 2,119 |
| Murder | 3 | 19 | 5 |
| Robbery | 141 | 680 | 61 |
| Aggravated Assault | 386 | 1,158 | 256 |
| Violent Crime | 607 | 1,925 | 359 |
| Burglary | 427 | 787 | 229 |
| Larceny | 1,523 | 4,165 | 1,272 |
| Car Theft | 638 | 2,279 | 259 |
| Property Crime | 2,588 | 7,230 | 1,760 |
Lower = safer. Bar inside each cell scales relative to the highest crime rate in the table.
Source: FBI Uniform Crime Reporting (2024). All rates are per 100,000 people. City pages: San Jose crime, Oakland crime. See also: safest cities in America.
Diversity
Oakland is more racially diverse — lower HHI (closer to 0) means a more even mix across groups.
| Group | San Jose | Oakland | United States |
|---|---|---|---|
| White | 22.3% | 27.8% | 57.4% |
| African American | 2.7% | 19.7% | 11.9% |
| American Indian | 0.2% | 0.3% | 0.5% |
| Asian | 39.2% | 15.7% | 5.9% |
| Hawaiian | 0.5% | 0.4% | 0.2% |
| Other | 0.5% | 0.9% | 0.6% |
| Two Or More | 3.8% | 6.6% | 4.3% |
| Hispanic | 30.8% | 28.7% | 19.3% |
Source: U.S. Census ACS 2020-2024. Lower HHI = more even racial mix. See also: most diverse cities in America.
SnackAbility — overall quality of life
San Jose scores higher overall — 8.5/10 vs 7/10. SnackAbility is our 1–10 quality-of-life score; the median U.S. city scores a 7.
SnackAbility is a HomeSnacks proprietary 1–10 score blending jobs, housing, education, commute, amenities, affordability, crime, and diversity. Median U.S. city ≈ 7. Data: Census, BLS, FBI. See also: best places to live in America.
Getting around: San Jose vs. Oakland
How each city handles commuting, transit, walkability, and car culture — the day-to-day reality that shapes where you'd actually want to live.
San Jose is a car city. Freeways 101, 280, and 87 carry most daily commuters, and most errands assume you have a vehicle. The VTA operates light rail and buses, but route coverage is thin and waits can be discouraging.
BART now reaches the Berryessa station on the city's east side, and Caltrain links San Jose to San Francisco with stops in between, useful if your employer is along that corridor. Oakland is a different story. BART runs through the urban core with major stations at 12th Street, 19th Street, MacArthur, and Lake Merritt, making car-free commuting to San Francisco or Berkeley genuinely practical.
AC Transit fills in neighborhood gaps, and the city's flat grid makes cycling in Temescal, Rockridge, or Uptown a real option. If you're commuting south toward the Valley's tech campuses, San Jose's freeway access wins. If you want to live without a car, Oakland has far more infrastructure to support that.
Jobs and careers in San Jose vs. Oakland
The local job market, dominant industries, and which city to choose based on your career.
San Jose sits in Silicon Valley's employment core. Cisco, Adobe, and eBay are headquartered here; Apple is a short drive north in Cupertino; Intel anchors Santa Clara nearby. The job market skews heavily toward software engineering, hardware, and the business functions around them.
That concentration shows in the numbers: median household income is $146,427, among the highest of any large U.S. city. Oakland's economy is more diversified. Kaiser Permanente is headquartered here, the Port of Oakland ranks among the West Coast's busiest cargo hubs, and tech and creative workers priced out of San Francisco have built a real presence in Uptown and Jack London Square.
The median household income of $101,600 trails San Jose's by a wide margin, though Oakland's lower cost of living index (190 vs. 216) softens that gap somewhat. For depth in tech and engineering roles, San Jose is the stronger market.
Weather and climate
What to expect day-to-day — sun, fog, heat, rain, and the seasonal extremes that shape the lifestyle.
San Jose's inland position makes it the warmest, sunniest major city in the Bay Area. Summers regularly push into the low-to-mid 90s, and the marine layer that keeps coastal neighborhoods cool rarely makes it over the hills. Winters are mild (hard freezes are rare), but the valley can trap smoke and particulates during hot, still stretches.
Oakland catches considerably more bay influence. Summer highs often run 10 to 15 degrees below San Jose's peaks, with afternoon fog or overcast skies rolling in through the Golden Gate. That natural cooling is a real quality-of-life advantage: you're less likely to need air conditioning and more likely to enjoy outdoor dining without wilting.
Both cities follow the same Mediterranean rhythm: the vast majority of annual rainfall arrives between November and March, with long dry summers. If you run hot or dread air-conditioning bills, Oakland's climate is the easier one to live in.
Culture, nightlife, and entertainment
Food, music, neighborhoods, and the city vibe that gives each place its personality.
Oakland's live music and arts scene runs deep for a city its size. The Fox Theater anchors an Uptown arts district that draws national touring acts, and the city's roots in blues, soul, and hip-hop continue to shape venues throughout Oakland. Fruitvale is a dense destination for Mexican food and community, while Grand Lake and Temescal are packed with independent restaurants, wine bars, and coffee shops.
San Jose's cultural footprint is larger in raw terms but feels more suburban in character. Santana Row is a polished outdoor dining and retail corridor; the San Pedro Square Market is a lively indoor food hall; and the SAP Center hosts the Sharks alongside major arena concerts. Downtown San Jose has grown considerably, but it still lacks the walkable, block-by-block density of nightlife Oakland offers.
For gallery openings, independent venues, and late-night dining variety, Oakland has a clear edge.
Outdoor activities and day trips
Parks, beaches, hikes, and the weekend escapes that define life outside the city limits.
San Jose is surrounded by excellent open space. Alum Rock Park offers canyon hiking just east of the city; Almaden Quicksilver County Park to the south has miles of trails through historic mining terrain; and the Santa Cruz Mountains (accessible via Highway 17) put redwood forest roughly 30 minutes from downtown. The Los Gatos Creek Trail is a flat, paved favorite for cyclists and joggers.
Oakland draws on the East Bay Regional Parks District, one of the strongest urban park systems in the country. Redwood Regional Park and Joaquin Miller Park both sit within city limits, giving you serious hiking through second-growth redwood groves without leaving town. Lake Merritt is Oakland's outdoor living room for runners, kayakers, and weekend picnickers.
Mount Diablo is a short drive east. Both cities are well-positioned for outdoor recreation; the practical difference is that Oakland's best parks sit closer to its densest neighborhoods, making them easier to reach without a car.
Bottom line: which city is right for you?
Based on the head-to-head data above, here's the short version — pick the city that lines up with what you actually care about.
Choose San Jose if you prioritize…
- lower crime — a safer place to live, work, and raise a family.
- a higher overall SnackAbility quality-of-life score.
Choose Oakland if you prioritize…
- a lower cost of living (cheaper groceries, services, and day-to-day expenses).
- more affordable housing relative to San Jose.
- a more racially diverse community (lower HHI on Census data).
Methodology: winners are picked from public data — U.S. Census Bureau ACS (income, home value, rent, race/HHI), FBI Uniform Crime Reporting (crime rates per 100k), and HomeSnacks' proprietary SnackAbility quality-of-life score, which blends Bureau of Labor Statistics data with the above.
More about California

Best Places To Live In California
Photo: Public domain
Cheapest Places To Live In California
Photo: Public domain
Most Dangerous Cities In California
Photo: Public domain
Best Places To Raise A Family In California
Photo: Public domain
Best Places To Retire In California
Photo: Public domain
Richest Cities In California
Photo: Public domain
Safest Places In California
Photo: Public domain
Worst Places To Live In California
Photo: Public domain