Wichitavs.Tulsa Which City Is Right for You in 2026?
A head-to-head guide to cost of living, jobs, transportation, weather, crime, and quality of life — so you can decide where to live, work, or visit.
Updated 2026-05-26 · By HomeSnacks Editorial
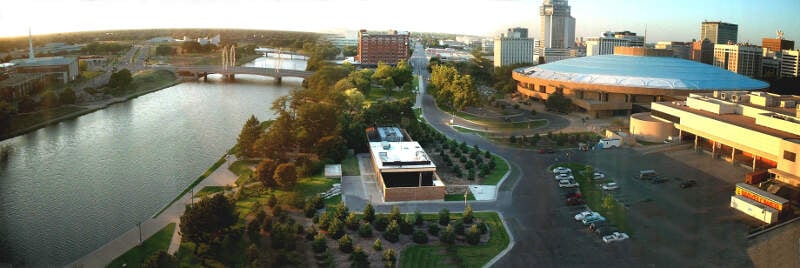
Wichita
Wichita vs. Tulsa at a glance
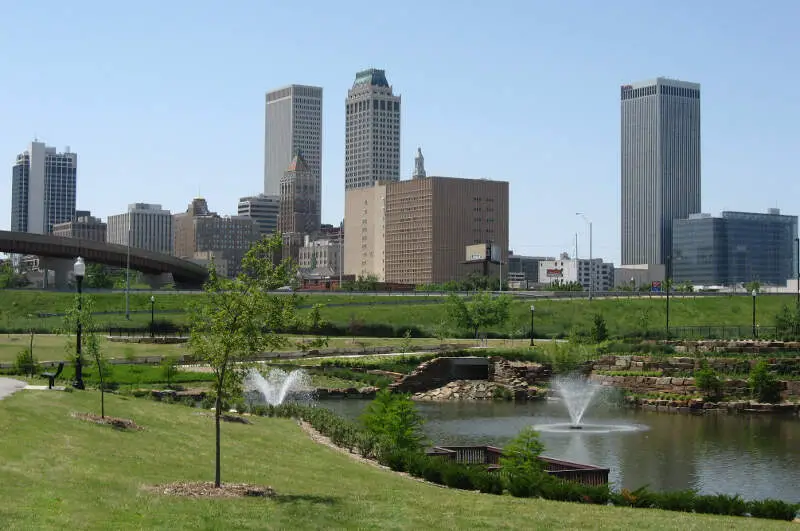
Choosing between Wichita, KS and Tulsa, OK comes down to which trade-offs you're willing to make. Wichita is the most populous city in the U.S. state of Kansas and the county seat of Sedgwick County. As of the 2020 census, the population of the city was 397,532, and the Wichita metropolitan area had a population of 647,610. Tulsa is the second-most-populous city in the U.S. state of Oklahoma and the 48th-most populous city in the United States. The population was 413,066 as of the 2020 census.
Cost of living is roughly comparable — Wichita comes in at 92 on the overall index and Tulsa at 93 (100 = national average). The housing market diverges more sharply: median home values are $202,719 in Wichita and $217,450 in Tulsa, against median household incomes of $64,620 and $59,838.
Public safety is another point of divergence. Wichita reports 2,842 total crimes per 100,000 residents annually versus 4,569 in Tulsa. Tulsa is the more racially diverse of the two on a Herfindahl index basis — Wichita skews 59% White while Tulsa skews 50% White. On HomeSnacks' overall SnackAbility score, Wichita edges ahead at 7/10 versus 4/10 for Tulsa.
Wichita vs. Tulsa in photos
A side-by-side look at each city.


Cost of living
Wichita is the cheaper city overall — 1% higher in Tulsa than its rival. Index baseline: 100 = national average.
| Living expense | Wichita | Tulsa | US average |
|---|---|---|---|
| Overall | 92 | 93 | 100 |
| Services | 98 | 96 | 100 |
| Groceries | 92 | 94 | 100 |
| Health | 80 | 84 | 100 |
| Housing | 97 | 95 | 100 |
| Transportation | 95 | 91 | 100 |
| Utilities | 94 | 94 | 100 |
Lower index = cheaper. 100 = U.S. national average. Bar inside each cell scales relative to the highest value in the table.
Sources: HomeSnacks Cost of Living indices, normalized so 100 = U.S. national average. Drill in: Wichita cost of living, Tulsa cost of living, or the cheapest cities in America.
Housing breakdown
Home prices are higher in Tulsa. Compare absolute price and price-to-income — a $500k home in a $100k-income city is very different from one in a $50k-income city.
| Metric | Wichita | Tulsa | United States |
|---|---|---|---|
| Median Home Value | $202,719 | $217,450 | $332,700 |
| Median Rent | $975 | $1,052 | $1,413 |
| Median Income | $64,620 | $59,838 | $80,734 |
| Home Value To Income | 3.1x | 3.6x | 4.1x |
| Rent To Monthly Income | 0.18x | 0.21x | 0.21x |
Source: U.S. Census Bureau ACS 2020-2024. See also states with the highest rent in America.
Crime
Wichita is the safer city — total crime rate of 2,842 per 100k people vs 4,569 for Tulsa. US average: 2,119.
| Crime (per 100k) | Wichita | Tulsa | US average |
|---|---|---|---|
| Total crime | 2,842 | 4,569 | 2,119 |
| Murder | 8 | 9 | 5 |
| Robbery | 50 | 99 | 61 |
| Aggravated Assault | 447 | 728 | 256 |
| Violent Crime | 539 | 942 | 359 |
| Burglary | 263 | 747 | 229 |
| Larceny | 1,791 | 2,398 | 1,272 |
| Car Theft | 249 | 483 | 259 |
| Property Crime | 2,303 | 3,627 | 1,760 |
Lower = safer. Bar inside each cell scales relative to the highest crime rate in the table.
Source: FBI Uniform Crime Reporting (2024). All rates are per 100,000 people. City pages: Wichita crime, Tulsa crime. See also: safest cities in America.
Diversity
Tulsa is more racially diverse — lower HHI (closer to 0) means a more even mix across groups.
| Group | Wichita | Tulsa | United States |
|---|---|---|---|
| White | 59.5% | 50.5% | 57.4% |
| African American | 9.3% | 13.7% | 11.9% |
| American Indian | 0.4% | 3.6% | 0.5% |
| Asian | 4.9% | 3.4% | 5.9% |
| Hawaiian | 0.0% | 0.3% | 0.2% |
| Other | 0.5% | 0.4% | 0.6% |
| Two Or More | 6.4% | 8.4% | 4.3% |
| Hispanic | 19.0% | 19.8% | 19.3% |
Source: U.S. Census ACS 2020-2024. Lower HHI = more even racial mix. See also: most diverse cities in America.
SnackAbility — overall quality of life
Wichita scores higher overall — 7/10 vs 4/10. SnackAbility is our 1–10 quality-of-life score; the median U.S. city scores a 7.
SnackAbility is a HomeSnacks proprietary 1–10 score blending jobs, housing, education, commute, amenities, affordability, crime, and diversity. Median U.S. city ≈ 7. Data: Census, BLS, FBI. See also: best places to live in America.
Getting around: Wichita vs. Tulsa
How each city handles commuting, transit, walkability, and car culture — the day-to-day reality that shapes where you'd actually want to live.
Both Wichita and Tulsa are built for drivers, and car ownership isn't really optional in either city. Wichita Transit runs bus routes across the metro, but service is thin outside the core. The city's flat grid makes getting around predictable, and Dwight D. Eisenhower National Airport connects you to major hubs without the crowding of a large hub.
Tulsa Transit covers similar ground with similar limitations. Where Tulsa has an edge is its inner core: neighborhoods like the Brady Arts District and Cherry Street are genuinely walkable in a way most of Wichita isn't. Tulsa International Airport has solid regional connectivity.
Factor in car ownership costs either way. Neither city is close to transit-friendly.
Jobs and careers in Wichita vs. Tulsa
The local job market, dominant industries, and which city to choose based on your career.
Wichita's economy centers on aerospace manufacturing. Spirit AeroSystems, Textron Aviation (Cessna and Beechcraft), and a dense supply chain of suppliers anchor the local economy and pay well for skilled trades and engineering roles. The city earned the nickname "Air Capital of the World" for good reason.
Koch Industries, headquartered in Wichita, draws finance and operations talent. Median household income is $64,620.
Tulsa leans on energy: ONEOK and Williams Companies are two of the largest employers, and the oil-and-gas supply chain runs deep. Healthcare is a second pillar, with Saint Francis Health System and Ascension St. John both major employers. Tulsa's median household income of $59,838 runs a bit lower, though cost of living indexes (92 vs. 93) are nearly identical, so purchasing power differences are modest.
Weather and climate
What to expect day-to-day — sun, fog, heat, rain, and the seasonal extremes that shape the lifestyle.
You're in tornado country either way. Both cities sit squarely in the southern Great Plains, and spring severe-weather seasons in either place demand a weather app and a basement plan. That part isn't negotiable.
Wichita averages around 29 inches of annual rainfall. Summers are hot and dry, routinely hitting the upper 90s. Winters bring occasional ice storms and snow events that can disrupt a city not built for them.
Tulsa is noticeably more humid and wetter, averaging closer to 40 inches of rain per year. That keeps things greener but muggier from June through August. Winters are marginally milder than Wichita's, though ice storms are a recurring nuisance.
If you prefer drier air and don't mind sharper winters, Wichita edges ahead. If you want slightly warmer winters and can handle humidity, Tulsa fits better.
Culture, nightlife, and entertainment
Food, music, neighborhoods, and the city vibe that gives each place its personality.
Wichita punches above its weight culturally for a metro its size. Old Town, a converted warehouse neighborhood, has live music venues, bars, and restaurants that draw a genuine crowd on weekends. The Wichita Art Museum holds a solid American collection, and Intrust Bank Arena books national touring acts.
The Keeper of the Plains sculpture at the confluence of the Arkansas and Little Arkansas rivers is one of the more striking public art installations in the region.
Tulsa has a richer and more varied cultural scene overall. The Philbrook Museum of Art is a legitimate destination, and Cain's Ballroom is a historic music venue with real national standing. The Brady Arts District and Blue Dome District give the city distinct, walkable nightlife pockets.
Tulsa's Art Deco architecture downtown is genuinely impressive. If arts, live music variety, and a more developed bar and restaurant scene matter to you, Tulsa holds the edge.
Outdoor activities and day trips
Parks, beaches, hikes, and the weekend escapes that define life outside the city limits.
Wichita's outdoor options are pleasant but understated. Cheney Reservoir to the west is a popular spot for boating and fishing, and the Arkansas River trail system through the city gives cyclists and runners a usable greenway. Sedgwick County Park covers camping, disc golf, and nature trails.
The Flint Hills tallgrass prairie, less than an hour east, is unlike anything else in the region and worth the drive.
Tulsa's standout is Gathering Place, a 100-acre park on the Arkansas River that opened in 2018. It regularly ranks among the best urban parks in the country and is genuinely good for families, cyclists, and casual visitors. Turkey Mountain Urban Wilderness has real trail hiking just minutes from downtown, and Keystone Lake just west of the city expands options for boating and camping.
For outdoor recreation within and near the city, Tulsa has a clear advantage.
Bottom line: which city is right for you?
Based on the head-to-head data above, here's the short version — pick the city that lines up with what you actually care about.
Choose Wichita if you prioritize…
- a lower cost of living (cheaper groceries, services, and day-to-day expenses).
- lower crime — a safer place to live, work, and raise a family.
- a higher overall SnackAbility quality-of-life score.
Choose Tulsa if you prioritize…
- more affordable housing relative to Wichita.
- a more racially diverse community (lower HHI on Census data).
Methodology: winners are picked from public data — U.S. Census Bureau ACS (income, home value, rent, race/HHI), FBI Uniform Crime Reporting (crime rates per 100k), and HomeSnacks' proprietary SnackAbility quality-of-life score, which blends Bureau of Labor Statistics data with the above.
More about Kansas & Oklahoma

Best Places To Live In Kansas
Photo: Public domain
Cheapest Places To Live In Kansas
Photo: Public domain
Most Dangerous Places In Kansas
Photo: Public domain
Best Places To Retire In Kansas
Photo: Public domain
Richest Cities In Kansas
Photo: Public domain
Safest Places In Kansas
Photo: Public domain
Worst Places To Live In Kansas
Photo: Public domain
Best Places To Live In Oklahoma
Photo: Public domain