Sandy Springs, GA
Demographics And Statistics
Living In Sandy Springs, Georgia Summary
Life in Sandy Springs research summary. HomeSnacks has been using Saturday Night Science to research the quality of life in Sandy Springs over the past nine years using Census, FBI, Zillow, and other primary data sources. Based on the most recently available data, we found the following about life in Sandy Springs:
The population in Sandy Springs is 107,198.
The median home value in Sandy Springs is $669,955.
The median income in Sandy Springs is $101,593.
The cost of living in Sandy Springs is 135 which is 1.4x higher than the national average.
The median rent in Sandy Springs is $1,789.
The unemployment rate in Sandy Springs is 3.7%.
The poverty rate in Sandy Springs is 7.4%.
The average high in Sandy Springs is 71.0° and the average low is 50.3°.
Sandy Springs SnackAbility
Overall SnackAbility
Sandy Springs, GA Crime Report
Crime in Sandy Springs summary. We use data from the FBI to determine the crime rates in Sandy Springs. Key points include:
There were 1,689 total crimes in Sandy Springs in the last reporting year.
The overall crime rate per 100,000 people in Sandy Springs is 1,599.7 / 100k people.
The violent crime rate per 100,000 people in Sandy Springs is 139.2 / 100k people.
The property crime rate per 100,000 people in Sandy Springs is 1,460.5 / 100k people.
Overall, crime in Sandy Springs is -24.51% below the national average.
Total Crimes
Below National Average
Crime In Sandy Springs Comparison Table
| Statistic | Count Raw |
Sandy Springs / 100k People |
Georgia / 100k People |
National / 100k People |
|---|---|---|---|---|
| Total Crimes Per 100K | 1,689 | 1,599.7 | 2,000.6 | 2,119.2 |
| Violent Crime | 147 | 139.2 | 325.7 | 359.0 |
| Murder | 1 | 0.9 | 6.9 | 5.0 |
| Robbery | 16 | 15.2 | 40.8 | 61.0 |
| Aggravated Assault | 106 | 100.4 | 245.9 | 256.0 |
| Property Crime | 1,542 | 1,460.5 | 1,674.9 | 1,760.0 |
| Burglary | 209 | 198.0 | 202.8 | 229.0 |
| Larceny | 1,182 | 1,119.5 | 1,247.3 | 1,272.0 |
| Car Theft | 151 | 143.0 | 224.7 | 259.0 |
Sandy Springs, GA Cost Of Living
Cost of living in Sandy Springs summary. We use data on the cost of living to determine how expensive it is to live in Sandy Springs. Real estate prices drive most of the variance in cost of living around Georgia. Key points include:
The cost of living in Sandy Springs is 135 with 100 being average.
The cost of living in Sandy Springs is 1.4x higher than the national average.
The median home value in Sandy Springs is $669,955.
The median income in Sandy Springs is $101,593.
Sandy Springs's Overall Cost Of Living
Higher Than The National Average
Cost Of Living In Sandy Springs Comparison Table
| Living Expense | Sandy Springs | Georgia | National Average | |
|---|---|---|---|---|
| Overall | 135 | 91 | 100 | |
| Services | 102 | 99 | 100 | |
| Groceries | 99 | 99 | 100 | |
| Health | 110 | 100 | 100 | |
| Housing | 223 | 85 | 100 | |
| Transportation | 98 | 92 | 100 | |
| Utilities | 82 | 86 | 100 | |
Sandy Springs, GA Weather
The average high in Sandy Springs is 71.0° and the average low is 50.3°.
There are 76.7 days of precipitation each year.
Expect an average of 52.1 inches of precipitation each year with 1.0 inches of snow.
| Stat | Sandy Springs |
|---|---|
| Average Annual High | 71.0 |
| Average Annual Low | 50.3 |
| Annual Precipitation Days | 76.7 |
| Average Annual Precipitation | 52.1 |
| Average Annual Snowfall | 1.0 |
Average High
Days of Rain
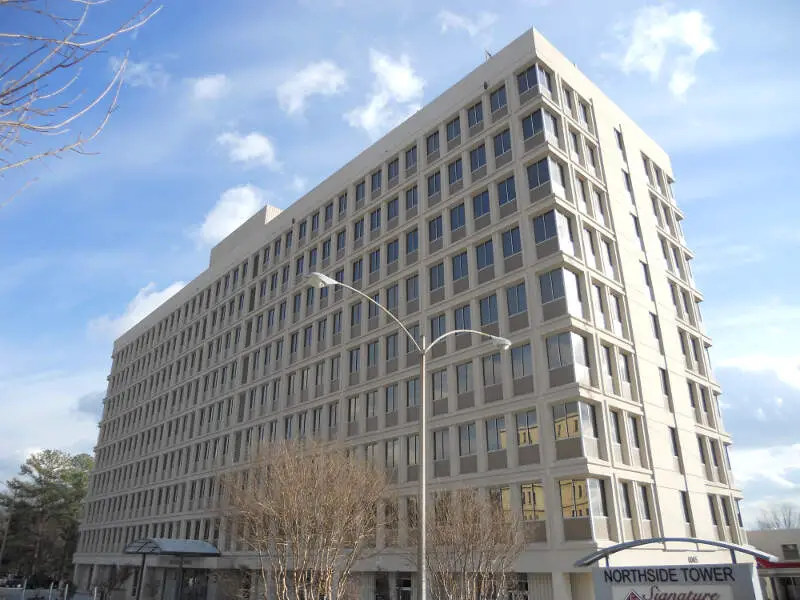
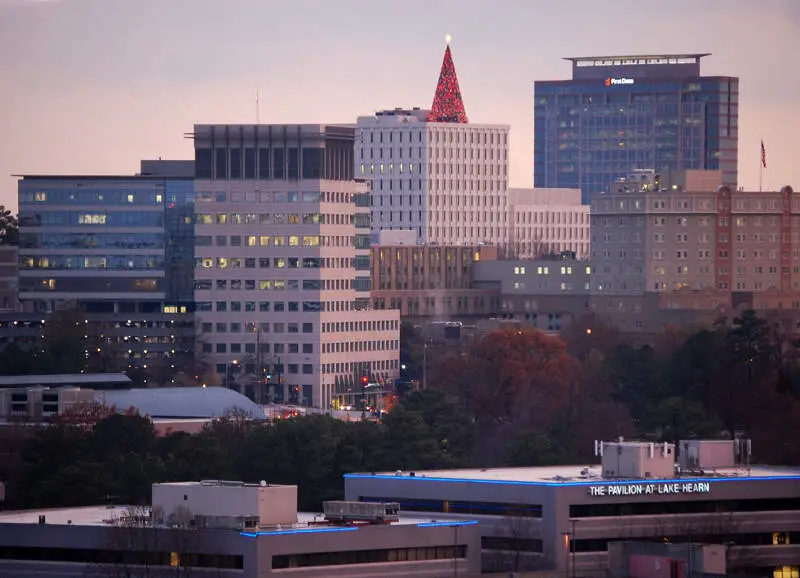
Sandy Springs, GA Photos


Rankings for Sandy Springs in Georgia


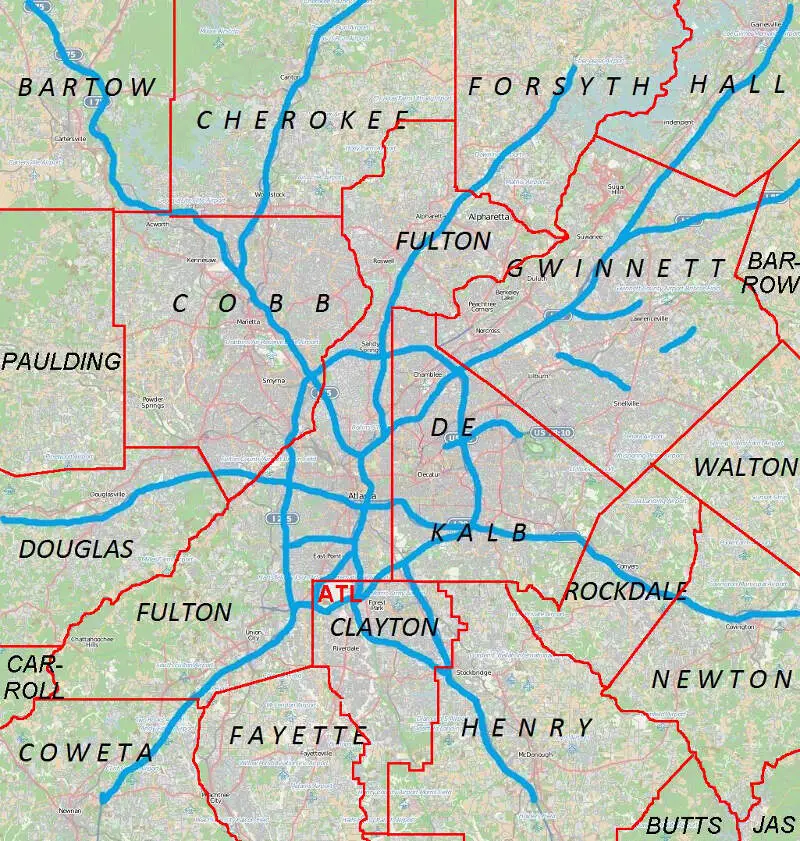
Locations Around Sandy Springs
Map Of Sandy Springs, GA
Best Places Around Sandy Springs
Alpharetta, GA
Population 66,355
Roswell, GA
Population 92,577
Mountain Park, GA
Population 13,102
Mountain Park, GA
Population 13,102
Johns Creek, GA
Population 82,115
Decatur, GA
Population 24,470
Suwanee, GA
Population 21,811
Woodstock, GA
Population 36,297
Duluth, GA
Population 31,958
Acworth, GA
Population 22,370
Sandy Springs Demographics And Statistics
Population over time in Sandy Springs
The current population in Sandy Springs is 107,198. The population has increased 18.0% from 2010.
| Year | Population | % Change |
|---|---|---|
| 2023 | 107,198 | -0.0% |
| 2022 | 107,221 | 0.6% |
| 2021 | 106,605 | -1.5% |
| 2020 | 108,180 | 1.0% |
| 2019 | 107,072 | 1.6% |
| 2018 | 105,411 | 1.6% |
| 2017 | 103,703 | 1.5% |
| 2016 | 102,212 | 1.5% |
| 2015 | 100,691 | 2.2% |
| 2014 | 98,480 | 2.0% |
| 2013 | 96,584 | 1.9% |
| 2012 | 94,816 | 2.2% |
| 2011 | 92,768 | 2.1% |
| 2010 | 90,826 | - |
Race / Ethnicity in Sandy Springs
Sandy Springs is:
56.4% White with 60,484 White residents.
19.5% African American with 20,857 African American residents.
0.1% American Indian with 67 American Indian residents.
7.6% Asian with 8,184 Asian residents.
0.0% Hawaiian with 13 Hawaiian residents.
0.9% Other with 984 Other residents.
4.1% Two Or More with 4,415 Two Or More residents.
11.4% Hispanic with 12,194 Hispanic residents.
| Race | Sandy Springs | GA | USA |
|---|---|---|---|
| White | 56.4% | 49.8% | 58.2% |
| African American | 19.5% | 31.0% | 12.0% |
| American Indian | 0.1% | 0.1% | 0.5% |
| Asian | 7.6% | 4.3% | 5.7% |
| Hawaiian | 0.0% | 0.1% | 0.2% |
| Other | 0.9% | 0.5% | 0.5% |
| Two Or More | 4.1% | 3.5% | 3.9% |
| Hispanic | 11.4% | 10.7% | 19.0% |
Gender in Sandy Springs
Sandy Springs is 52.2% female with 55,927 female residents.
Sandy Springs is 47.8% male with 51,271 male residents.
| Gender | Sandy Springs | GA | USA |
|---|---|---|---|
| Female | 52.2% | 51.2% | 50.5% |
| Male | 47.8% | 48.8% | 49.5% |
Highest level of educational attainment in Sandy Springs for adults over 25
1.0% of adults in Sandy Springs completed < 9th grade.
1.0% of adults in Sandy Springs completed 9-12th grade.
9.0% of adults in Sandy Springs completed high school / ged.
14.0% of adults in Sandy Springs completed some college.
5.0% of adults in Sandy Springs completed associate's degree.
40.0% of adults in Sandy Springs completed bachelor's degree.
21.0% of adults in Sandy Springs completed master's degree.
7.0% of adults in Sandy Springs completed professional degree.
2.0% of adults in Sandy Springs completed doctorate degree.
| Education | Sandy Springs | GA | USA |
|---|---|---|---|
| < 9th Grade | 1.0% | 3.0% | 5.0% |
| 9-12th Grade | 1.0% | 7.0% | 6.0% |
| High School / GED | 9.0% | 27.0% | 26.0% |
| Some College | 14.0% | 20.0% | 19.0% |
| Associate's Degree | 5.0% | 8.0% | 9.0% |
| Bachelor's Degree | 40.0% | 21.0% | 21.0% |
| Master's Degree | 21.0% | 10.0% | 10.0% |
| Professional Degree | 7.0% | 2.0% | 2.0% |
| Doctorate Degree | 2.0% | 2.0% | 2.0% |
Household Income For Sandy Springs, Georgia
4.1% of households in Sandy Springs earn Less than $10,000.
2.0% of households in Sandy Springs earn $10,000 to $14,999.
3.5% of households in Sandy Springs earn $15,000 to $24,999.
4.1% of households in Sandy Springs earn $25,000 to $34,999.
6.8% of households in Sandy Springs earn $35,000 to $49,999.
13.8% of households in Sandy Springs earn $50,000 to $74,999.
15.1% of households in Sandy Springs earn $75,000 to $99,999.
17.4% of households in Sandy Springs earn $100,000 to $149,999.
10.8% of households in Sandy Springs earn $150,000 to $199,999.
22.5% of households in Sandy Springs earn $200,000 or more.
| Income | Sandy Springs | GA | USA |
|---|---|---|---|
| Less than $10,000 | 4.1% | 5.3% | 4.9% |
| $10,000 to $14,999 | 2.0% | 3.6% | 3.6% |
| $15,000 to $24,999 | 3.5% | 7.0% | 6.6% |
| $25,000 to $34,999 | 4.1% | 7.2% | 6.8% |
| $35,000 to $49,999 | 6.8% | 11.0% | 10.4% |
| $50,000 to $74,999 | 13.8% | 16.2% | 15.7% |
| $75,000 to $99,999 | 15.1% | 13.1% | 12.7% |
| $100,000 to $149,999 | 17.4% | 17.0% | 17.4% |
| $150,000 to $199,999 | 10.8% | 8.7% | 9.3% |
| $200,000 or more | 22.5% | 11.0% | 12.6% |


