

Gayest places in Ohio research summary. We used Saturday Night Science to research the cities in Ohio with the highest percent of same-sex households for 2026. The data comes from the American Community Survey 2020-2024 5-year vintage, which counts same-sex married spouses and same-sex unmarried partners at the city level.
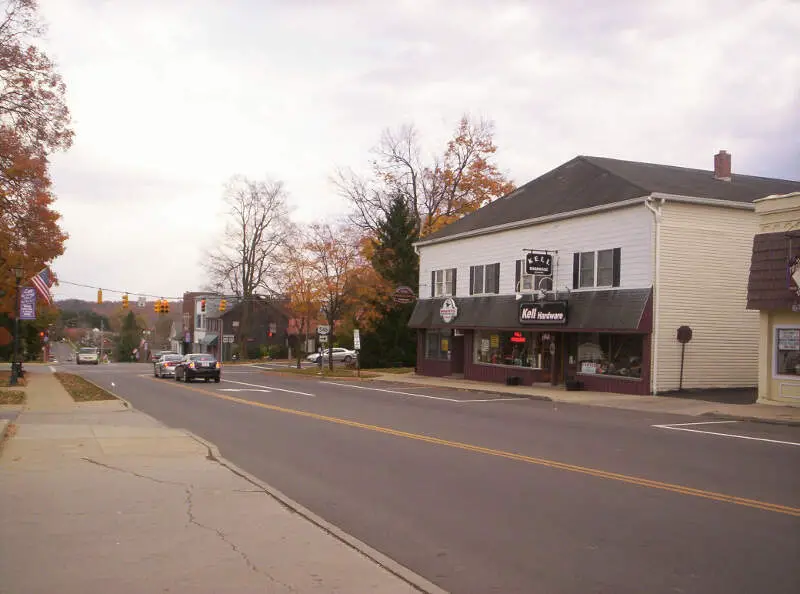
7.6% gay households · #1 gayest in Ohio
 Located in
Richland County, Ohio
Located in
Richland County, Ohio
Lexington is a village in Richland County in the U.S. state of Ohio. It is part of the Mansfield, Ohio Metropolitan Statistical Area. The population was 4,822 at the 2010 census, an increase from 4,165 in 2000.
Data | Movers

4.3% gay households · #2 gayest in Ohio
Data | Movers

4.1% gay households · #3 gayest in Ohio
Data | Movers
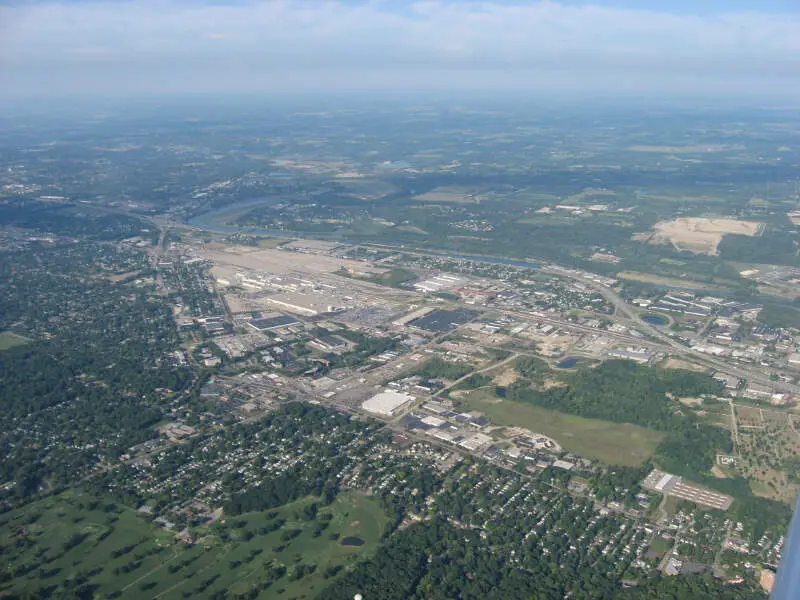
4.1% gay households · #4 gayest in Ohio
 Located in
Montgomery County, Ohio
Located in
Montgomery County, Ohio
Moraine is a city in Montgomery County, Ohio, United States. The population was 6,307 at the 2010 census. The city is part of the Dayton Metropolitan Statistical Area, which includes Montgomery County. Moraine, as part of the Dayton area, is situated within the Miami Valley region of Ohio, just north of the Cincinnati metropolitan area.
Data | Crime | Cost of living | Movers
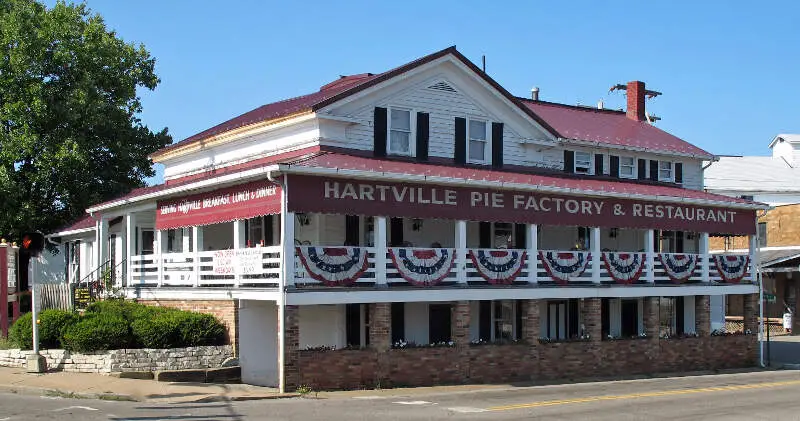
3.3% gay households · #5 gayest in Ohio
Data | Movers
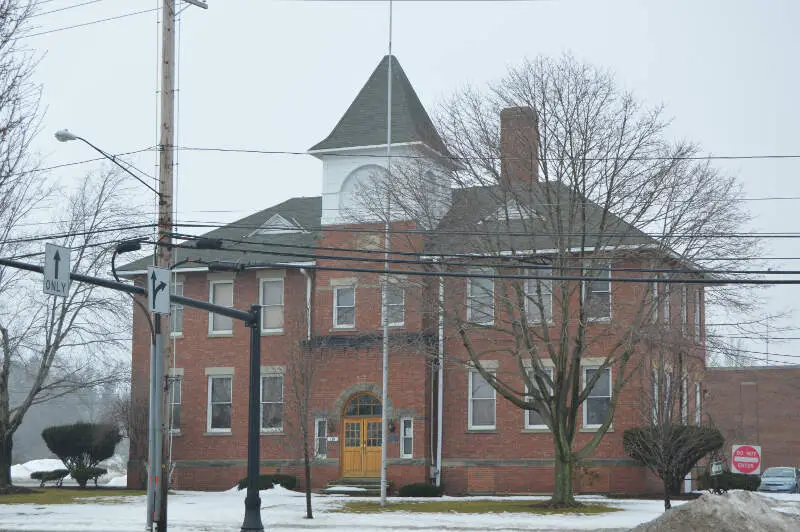
3.3% gay households · #6 gayest in Ohio
Data | Crime | Cost of living | Movers
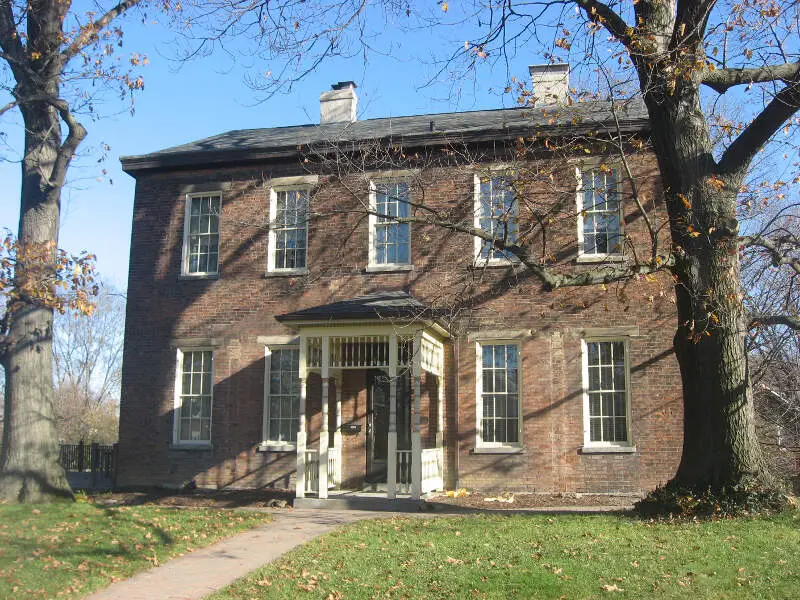
3.1% gay households · #7 gayest in Ohio
Data | Movers
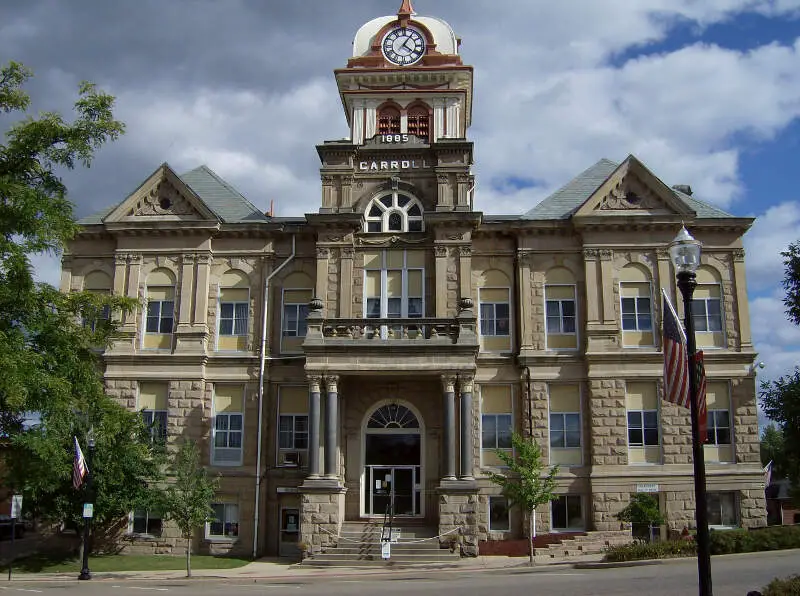
3.1% gay households · #8 gayest in Ohio
Data | Movers
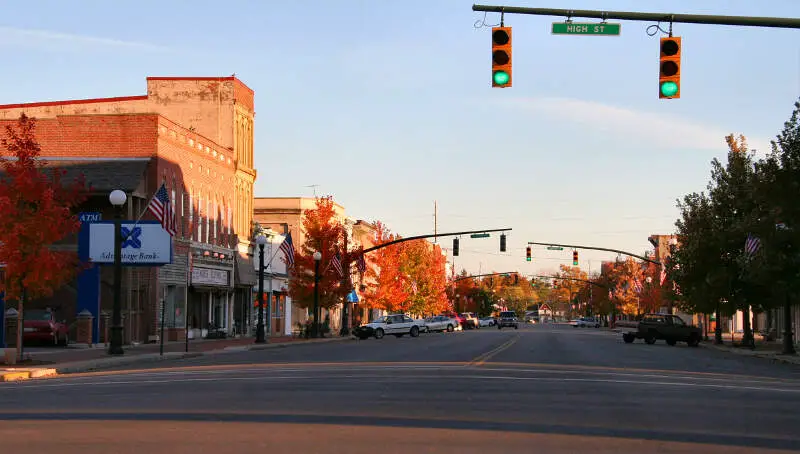
3.1% gay households · #9 gayest in Ohio
 Located in
Madison County, Ohio
Located in
Madison County, Ohio
London is a city in and the county seat of Madison County, Ohio, United States. Located about 25 miles southwest of the Ohio capital of Columbus, London was established in 1811 to serve as the county seat. The population was 9,904 at the 2010 census. The ZIP code is 43140.
Data | Crime | Cost of living | Movers
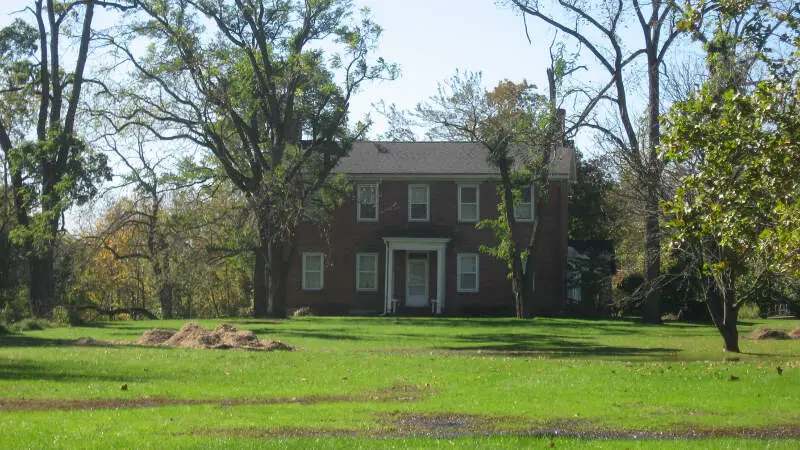
3.0% gay households · #10 gayest in Ohio
Data | Crime | Cost of living | Movers
The receipts
Compare the top ten
Pick a metric. The bars rescale. The red line is Ohio’s statewide median.
On the map
Where Ohio’s LGBTQ households are
Saturday Night Science
How we determined the gayest places in Ohio for 2026
In order to rank the gayest cities in Ohio, we used Saturday Night Science and the 2020-2024 American Community Survey 5-year estimates from the U.S. Census. We looked at:
- Percentage of all households that are unmarried, same-sex partners
We limited the analysis to non-CDPs that have over 1,000 households.
We ranked each place from 1 to 358 with the city containing the highest percentage of unmarried, same-sex partner households being the most gay.
In the end, Lexington ended up being the most gay place with 7.6% gay households.
Skip to the end to see the list of all the places in the state from gayest to straightest.
We updated this report for 2026. This report is our eleventh time ranking the gayest places in Ohio.
The full plate
Gayest Places In Ohio
Click any column to sort. Search by city name.
| Rank | City | Households | LGBTQ Households | % Gay Households |
|---|---|---|---|---|
| 1 | Lexington | 2,049 | 156 | 7.6% |
| 2 | Bellaire | 1,712 | 73 | 4.3% |
| 3 | Fairport Harbor | 1,430 | 59 | 4.1% |
| 4 | Moraine | 2,692 | 110 | 4.1% |
| 5 | Hartville | 1,503 | 50 | 3.3% |
| 6 | Mayfield | 1,364 | 45 | 3.3% |
| 7 | St. Bernard | 1,779 | 56 | 3.1% |
| 8 | Carrollton | 1,251 | 39 | 3.1% |
| 9 | London | 4,646 | 144 | 3.1% |
| 10 | Sheffield | 1,733 | 52 | 3.0% |
| 11 | Groveport | 2,259 | 65 | 2.9% |
| 12 | Greenhills | 1,481 | 39 | 2.6% |
| 13 | Clyde | 2,897 | 76 | 2.6% |
| 14 | Salem | 5,141 | 134 | 2.6% |
| 15 | New Lexington | 1,881 | 49 | 2.6% |
| 16 | Bedford Heights | 5,520 | 133 | 2.4% |
| 17 | Bexley | 4,460 | 106 | 2.4% |
| 18 | Archbold | 1,871 | 44 | 2.4% |
| 19 | Buckeye Lake | 1,072 | 24 | 2.2% |
| 20 | Plain City | 1,547 | 34 | 2.2% |
| 21 | Kenton | 3,347 | 73 | 2.2% |
| 22 | Upper Sandusky | 2,874 | 62 | 2.2% |
| 23 | Ironton | 4,562 | 98 | 2.1% |
| 24 | Celina | 4,530 | 95 | 2.1% |
| 25 | Ottawa Hills | 1,766 | 37 | 2.1% |
| 26 | Reading | 5,158 | 105 | 2.0% |
| 27 | Port Clinton | 2,716 | 53 | 2.0% |
| 28 | Hubbard | 3,520 | 68 | 1.9% |
| 29 | Painesville | 8,348 | 151 | 1.8% |
| 30 | Lakewood | 26,876 | 483 | 1.8% |
| 31 | Dover | 5,544 | 98 | 1.8% |
| 32 | Mariemont | 1,366 | 24 | 1.8% |
| 33 | Mount Vernon | 7,100 | 121 | 1.7% |
| 34 | Middletown | 21,422 | 361 | 1.7% |
| 35 | West Carrollton | 5,888 | 99 | 1.7% |
| 36 | Sidney | 8,904 | 149 | 1.7% |
| 37 | Golf Manor | 1,813 | 30 | 1.7% |
| 38 | Bucyrus | 5,293 | 87 | 1.6% |
| 39 | Mentor | 20,355 | 327 | 1.6% |
| 40 | Geneva | 2,656 | 42 | 1.6% |
| 41 | Wellington | 1,956 | 30 | 1.5% |
| 42 | Broadview Heights | 8,326 | 125 | 1.5% |
| 43 | Norton | 4,942 | 74 | 1.5% |
| 44 | Athens | 7,238 | 108 | 1.5% |
| 45 | South Euclid | 8,604 | 128 | 1.5% |
| 46 | Crestline | 1,903 | 28 | 1.5% |
| 47 | Cleveland Heights | 19,323 | 283 | 1.5% |
| 48 | Harrison | 4,994 | 73 | 1.5% |
| 49 | University Heights | 4,686 | 68 | 1.5% |
| 50 | North College Hill | 3,799 | 55 | 1.4% |
| 51 | Worthington | 6,143 | 88 | 1.4% |
| 52 | Garfield Heights | 11,946 | 171 | 1.4% |
| 53 | Pataskala | 6,920 | 99 | 1.4% |
| 54 | Columbus | 390,528 | 5,587 | 1.4% |
| 55 | Reynoldsburg | 17,280 | 247 | 1.4% |
| 56 | Kent | 10,069 | 143 | 1.4% |
| 57 | Avon Lake | 10,896 | 154 | 1.4% |
| 58 | Maumee | 6,004 | 82 | 1.4% |
| 59 | Cincinnati | 144,297 | 1,950 | 1.4% |
| 60 | Marysville | 10,163 | 137 | 1.3% |
| 61 | Beachwood | 5,930 | 79 | 1.3% |
| 62 | Deer Park | 2,708 | 36 | 1.3% |
| 63 | West Jefferson | 1,656 | 22 | 1.3% |
| 64 | Steubenville | 7,097 | 93 | 1.3% |
| 65 | Cuyahoga Falls | 23,212 | 304 | 1.3% |
| 66 | Garrettsville | 1,222 | 16 | 1.3% |
| 67 | Girard | 4,376 | 57 | 1.3% |
| 68 | Columbiana | 3,458 | 45 | 1.3% |
| 69 | Sabina | 1,157 | 15 | 1.3% |
| 70 | Norwood | 8,899 | 115 | 1.3% |
| 71 | Louisville | 4,238 | 54 | 1.3% |
| 72 | Euclid | 22,433 | 284 | 1.3% |
| 73 | Springfield | 24,650 | 310 | 1.3% |
| 74 | Niles | 8,678 | 107 | 1.2% |
| 75 | Lakemore | 1,348 | 16 | 1.2% |
| 76 | Delta | 1,189 | 14 | 1.2% |
| 77 | Englewood | 5,695 | 67 | 1.2% |
| 78 | South Point | 1,364 | 16 | 1.2% |
| 79 | Fostoria | 5,097 | 59 | 1.2% |
| 80 | Willard | 2,593 | 30 | 1.2% |
| 81 | Grandview Heights | 4,035 | 46 | 1.1% |
| 82 | Parma | 34,287 | 384 | 1.1% |
| 83 | Hamilton | 24,858 | 274 | 1.1% |
| 84 | Canal Winchester | 3,903 | 43 | 1.1% |
| 85 | Lebanon | 8,341 | 91 | 1.1% |
| 86 | Olmsted Falls | 3,823 | 41 | 1.1% |
| 87 | Willowick | 6,354 | 68 | 1.1% |
| 88 | Mansfield | 19,516 | 208 | 1.1% |
| 89 | Brookville | 2,440 | 26 | 1.1% |
| 90 | Powell | 5,163 | 55 | 1.1% |
| 91 | Willoughby | 11,783 | 125 | 1.1% |
| 92 | Sharonville | 7,084 | 75 | 1.1% |
| 93 | Germantown | 2,300 | 24 | 1.0% |
| 94 | South Bloomfield | 1,163 | 12 | 1.0% |
| 95 | Toledo | 118,662 | 1,203 | 1.0% |
| 96 | Cleveland | 169,683 | 1,707 | 1.0% |
| 97 | St. Clairsville | 2,101 | 21 | 1.0% |
| 98 | Barberton | 10,974 | 109 | 1.0% |
| 99 | Silver Lake | 1,012 | 10 | 1.0% |
| 100 | Elyria | 22,899 | 226 | 1.0% |
Source: U.S. Census ACS 2020-2024. Places with over 1,000 households.
Summary
There You Have It – The Most LGBT Friendly Cities In Ohio For 2026
If you’re looking at the number of gay households in Ohio, this is an accurate list.
The gayest cities in Ohio are Lexington, Bellaire, Fairport Harbor, Moraine, Hartville, Mayfield, St. Bernard, Carrollton, London, and Sheffield. Not sold on Ohio? Take the two-minute Find Your Place quiz and see which state actually fits you.
Questions and answers
Gayest Places In Ohio FAQs
What is the gayest city in Ohio?
Lexington is the gayest place in Ohio for 2026, with same-sex couples making up 7.6% of households. Bellaire and Fairport Harbor are next.
What are the gayest places in Ohio?
The gayest places in Ohio are Lexington, Bellaire, Fairport Harbor, Moraine, Hartville, Mayfield, St. Bernard, Carrollton, London, and Sheffield. We ranked all 358 places with over 1,000 households by their share of same-sex partner households.
How do you measure the gayest places?
The Census does not ask about sexual orientation, so we use the closest thing it tracks: the share of households headed by same-sex partners, from the American Community Survey. It undercounts single LGBT residents, but it is consistent from place to place.
What is the straightest place in Ohio?
Newton Falls is the straightest place in Ohio by this measure, with same-sex couples at 0.0% of households. It anchors the other end of the ranking.
Does a town have to be big to make the list?
No. Any Ohio place with more than 1,000 households qualifies, and 358 made the cut this year. Small towns can and do out-rank the big cities on this one.



