Henderson, KY
Demographics And Statistics
Living In Henderson, Kentucky Summary
Life in Henderson research summary. HomeSnacks has been using Saturday Night Science to research the quality of life in Henderson over the past nine years using Census, FBI, Zillow, and other primary data sources. Based on the most recently available data, we found the following about life in Henderson:
The population in Henderson is 27,994.
The median home value in Henderson is $191,880.
The median income in Henderson is $47,176.
The cost of living in Henderson is 88 which is 0.9x lower than the national average.
The median rent in Henderson is $788.
The unemployment rate in Henderson is 2.6%.
The poverty rate in Henderson is 19.7%.
The average high in Henderson is 67.1° and the average low is 46.7°.
Henderson SnackAbility
Overall SnackAbility
Henderson, KY Crime Report
Crime in Henderson summary. We use data from the FBI to determine the crime rates in Henderson. Key points include:
There were 589 total crimes in Henderson in the last reporting year.
The overall crime rate per 100,000 people in Henderson is 2,134.1 / 100k people.
The violent crime rate per 100,000 people in Henderson is 318.8 / 100k people.
The property crime rate per 100,000 people in Henderson is 1,815.2 / 100k people.
Overall, crime in Henderson is 0.70% above the national average.
Total Crimes
Above National Average
Crime In Henderson Comparison Table
| Statistic | Count Raw |
Henderson / 100k People |
Kentucky / 100k People |
National / 100k People |
|---|---|---|---|---|
| Total Crimes Per 100K | 589 | 2,134.1 | 1,563.0 | 2,119.2 |
| Violent Crime | 88 | 318.8 | 213.1 | 359.0 |
| Murder | 1 | 3.6 | 6.1 | 5.0 |
| Robbery | 13 | 47.1 | 35.1 | 61.0 |
| Aggravated Assault | 58 | 210.1 | 139.5 | 256.0 |
| Property Crime | 501 | 1,815.2 | 1,349.9 | 1,760.0 |
| Burglary | 101 | 365.9 | 193.6 | 229.0 |
| Larceny | 334 | 1,210.1 | 930.2 | 1,272.0 |
| Car Theft | 66 | 239.1 | 226.2 | 259.0 |
Henderson, KY Cost Of Living
Cost of living in Henderson summary. We use data on the cost of living to determine how expensive it is to live in Henderson. Real estate prices drive most of the variance in cost of living around Kentucky. Key points include:
The cost of living in Henderson is 88 with 100 being average.
The cost of living in Henderson is 0.9x lower than the national average.
The median home value in Henderson is $191,880.
The median income in Henderson is $47,176.
Henderson's Overall Cost Of Living
Lower Than The National Average
Cost Of Living In Henderson Comparison Table
| Living Expense | Henderson | Kentucky | National Average | |
|---|---|---|---|---|
| Overall | 88 | 92 | 100 | |
| Services | 102 | 101 | 100 | |
| Groceries | 93 | 99 | 100 | |
| Health | 89 | 85 | 100 | |
| Housing | 68 | 71 | 100 | |
| Transportation | 90 | 94 | 100 | |
| Utilities | 122 | 105 | 100 | |
Henderson, KY Weather
The average high in Henderson is 67.1° and the average low is 46.7°.
There are 70.7 days of precipitation each year.
Expect an average of 45.0 inches of precipitation each year with 5.6 inches of snow.
| Stat | Henderson |
|---|---|
| Average Annual High | 67.1 |
| Average Annual Low | 46.7 |
| Annual Precipitation Days | 70.7 |
| Average Annual Precipitation | 45.0 |
| Average Annual Snowfall | 5.6 |
Average High
Days of Rain
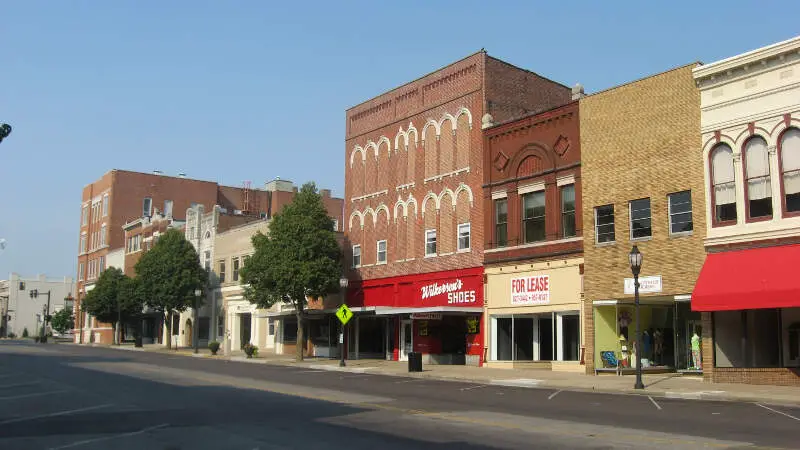
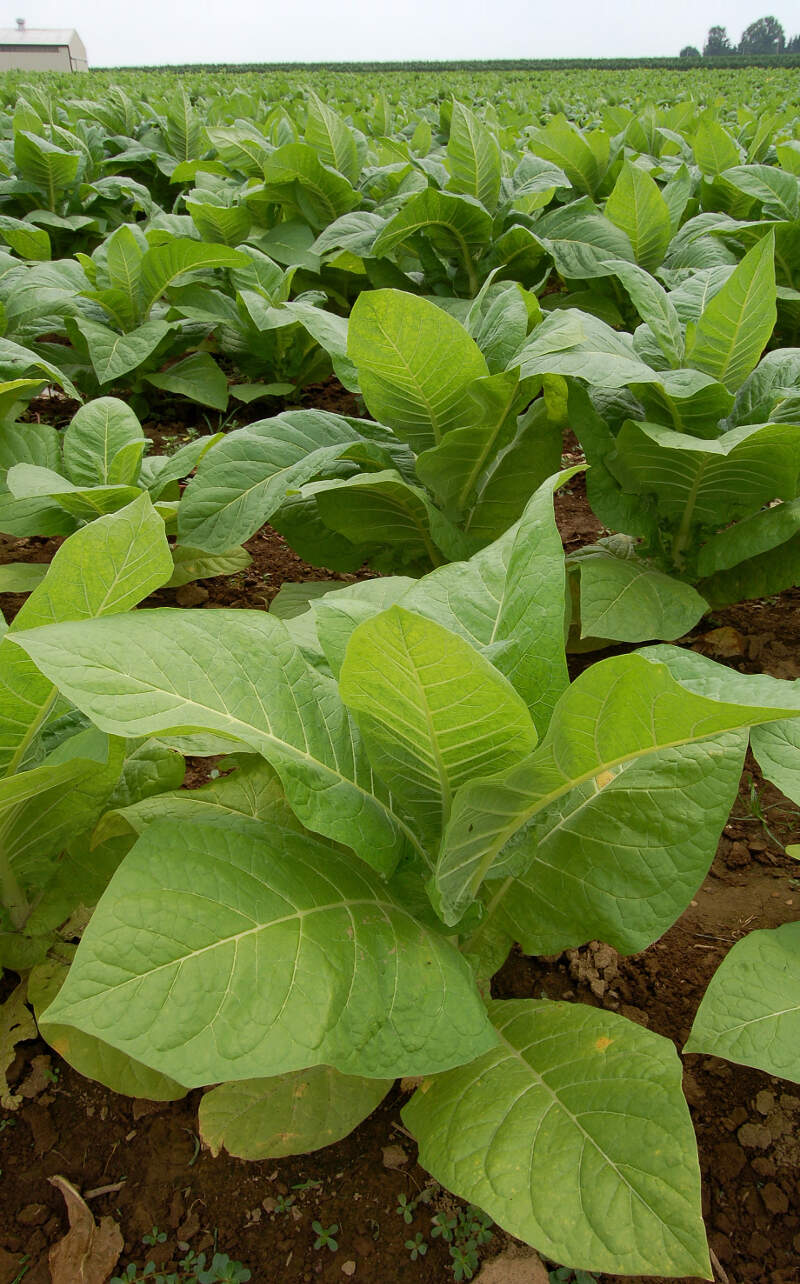
Henderson, KY Photos
Henderson Articles

Rankings for Henderson in Kentucky


Locations Around Henderson
Map Of Henderson, KY
Best Places Around Henderson
Carmi, IL
Population 4,879
Mount Carmel, IL
Population 6,892
Owensboro, KY
Population 60,112
Elizabethtown, KY
Population 31,870
Mount Vernon, IN
Population 6,431
Huntingburg, IN
Population 6,504
Morganfield, KY
Population 3,208
Madisonville, KY
Population 19,442
Central, LA
Population 29,603
Greenville, KY
Population 4,435
Henderson Demographics And Statistics
Population over time in Henderson
The current population in Henderson is 27,994. The population has decreased -1.7% from 2010.
| Year | Population | % Change |
|---|---|---|
| 2023 | 27,994 | -0.6% |
| 2022 | 28,166 | -0.1% |
| 2021 | 28,201 | -0.9% |
| 2020 | 28,469 | -0.5% |
| 2019 | 28,625 | -0.6% |
| 2018 | 28,800 | -0.2% |
| 2017 | 28,859 | -0.0% |
| 2016 | 28,870 | -0.1% |
| 2015 | 28,889 | 0.2% |
| 2014 | 28,840 | 0.2% |
| 2013 | 28,785 | 0.2% |
| 2012 | 28,728 | 0.4% |
| 2011 | 28,602 | 0.5% |
| 2010 | 28,464 | - |
Race / Ethnicity in Henderson
Henderson is:
79.3% White with 22,207 White residents.
10.4% African American with 2,898 African American residents.
0.4% American Indian with 121 American Indian residents.
0.4% Asian with 104 Asian residents.
0.2% Hawaiian with 47 Hawaiian residents.
0.0% Other with 6 Other residents.
4.4% Two Or More with 1,227 Two Or More residents.
4.9% Hispanic with 1,384 Hispanic residents.
| Race | Henderson | KY | USA |
|---|---|---|---|
| White | 79.3% | 82.3% | 58.2% |
| African American | 10.4% | 7.8% | 12.0% |
| American Indian | 0.4% | 0.1% | 0.5% |
| Asian | 0.4% | 1.5% | 5.7% |
| Hawaiian | 0.2% | 0.1% | 0.2% |
| Other | 0.0% | 0.3% | 0.5% |
| Two Or More | 4.4% | 3.3% | 3.9% |
| Hispanic | 4.9% | 4.7% | 19.0% |
Gender in Henderson
Henderson is 52.2% female with 14,619 female residents.
Henderson is 47.8% male with 13,374 male residents.
| Gender | Henderson | KY | USA |
|---|---|---|---|
| Female | 52.2% | 50.5% | 50.5% |
| Male | 47.8% | 49.5% | 49.5% |
Highest level of educational attainment in Henderson for adults over 25
4.0% of adults in Henderson completed < 9th grade.
8.0% of adults in Henderson completed 9-12th grade.
38.0% of adults in Henderson completed high school / ged.
22.0% of adults in Henderson completed some college.
10.0% of adults in Henderson completed associate's degree.
12.0% of adults in Henderson completed bachelor's degree.
5.0% of adults in Henderson completed master's degree.
1.0% of adults in Henderson completed professional degree.
0.0% of adults in Henderson completed doctorate degree.
| Education | Henderson | KY | USA |
|---|---|---|---|
| < 9th Grade | 4.0% | 4.0% | 5.0% |
| 9-12th Grade | 8.0% | 7.0% | 6.0% |
| High School / GED | 38.0% | 33.0% | 26.0% |
| Some College | 22.0% | 20.0% | 19.0% |
| Associate's Degree | 10.0% | 9.0% | 9.0% |
| Bachelor's Degree | 12.0% | 16.0% | 21.0% |
| Master's Degree | 5.0% | 8.0% | 10.0% |
| Professional Degree | 1.0% | 2.0% | 2.0% |
| Doctorate Degree | 0.0% | 1.0% | 2.0% |
Household Income For Henderson, Kentucky
6.5% of households in Henderson earn Less than $10,000.
8.6% of households in Henderson earn $10,000 to $14,999.
11.1% of households in Henderson earn $15,000 to $24,999.
10.3% of households in Henderson earn $25,000 to $34,999.
15.9% of households in Henderson earn $35,000 to $49,999.
15.4% of households in Henderson earn $50,000 to $74,999.
11.3% of households in Henderson earn $75,000 to $99,999.
12.8% of households in Henderson earn $100,000 to $149,999.
4.8% of households in Henderson earn $150,000 to $199,999.
3.2% of households in Henderson earn $200,000 or more.
| Income | Henderson | KY | USA |
|---|---|---|---|
| Less than $10,000 | 6.5% | 6.0% | 4.9% |
| $10,000 to $14,999 | 8.6% | 5.4% | 3.6% |
| $15,000 to $24,999 | 11.1% | 8.5% | 6.6% |
| $25,000 to $34,999 | 10.3% | 8.6% | 6.8% |
| $35,000 to $49,999 | 15.9% | 12.5% | 10.4% |
| $50,000 to $74,999 | 15.4% | 17.1% | 15.7% |
| $75,000 to $99,999 | 11.3% | 12.9% | 12.7% |
| $100,000 to $149,999 | 12.8% | 15.8% | 17.4% |
| $150,000 to $199,999 | 4.8% | 6.7% | 9.3% |
| $200,000 or more | 3.2% | 6.7% | 12.6% |


