We used Saturday Night Science to analyze Ohio’s most recent Census data to determine the divorce rate for each city in Ohio based on the percentage of currently divorced residents.
The city with the highest divorce rate in Ohio is Wellston, with 22.0% of people over 15 years of age being divorced, per the most recent census data. The city with the lowest divorce rate in Ohio is The Village of Indian Hill.
Ohio is 9.0% divorced overall. There are some 850,341 people living in Ohio over fifteen years of age who are divorced. You can compare that to the 28,339,199 Americans who are currently divorced.
Isn’t the divorce rate in America close to 50%? Yes indeed. But we’re measuring something else; we are looking at counts and percentages of people over 15 years old who are currently divorced. That 50% statistic is for the percentage of people who have ever been divorced.
So now that we have you biting your nails, rethinking your worldview, and pulling out your hair, let’s look at the places in Ohio with the highest rates of divorcees.
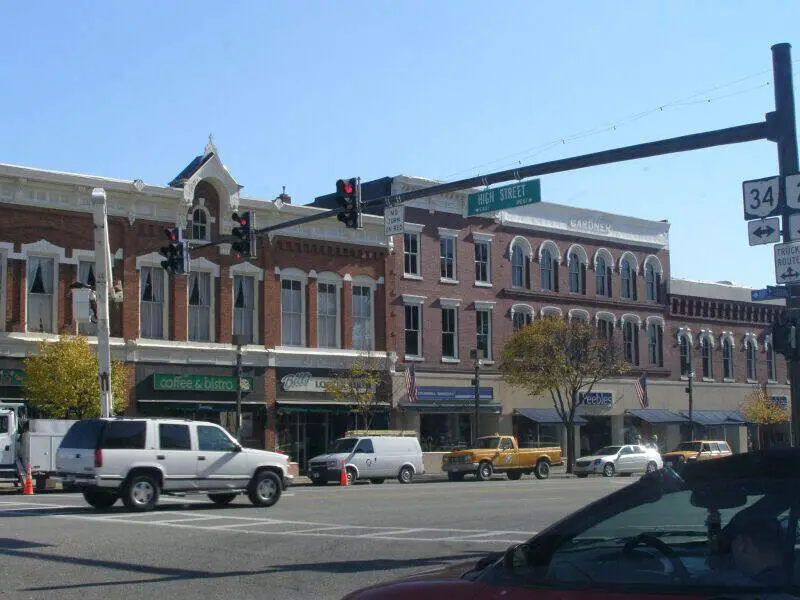
22.0% divorced · #1 highest divorce rate in Ohio
Wellston is a city in Jackson County, Ohio, United States, in the southeastern part of the state. The population was 5,663 at the 2010 census.
Data | Crime | Cost of living | Movers

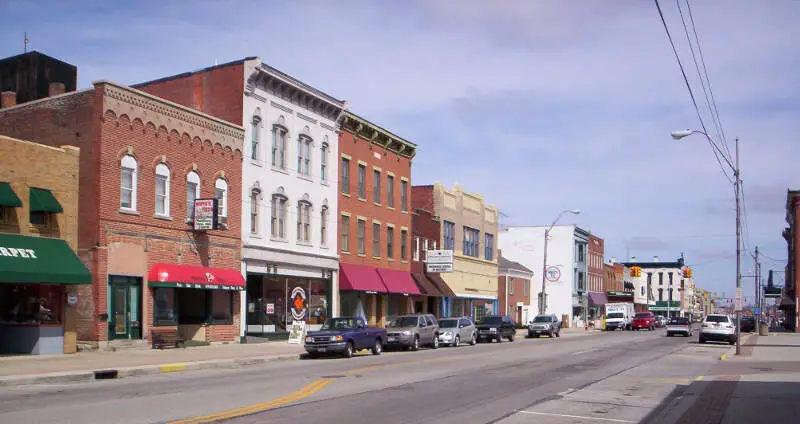
17.0% divorced · #2 highest divorce rate in Ohio
Canal Fulton is a city in Stark County in the U.S. state of Ohio. The population was 5,479 at the 2010 census. It is part of the Canton-Massillon, OH Metropolitan Statistical Area but serves equally as a suburb of Akron.
Data | Crime | Cost of living | Movers
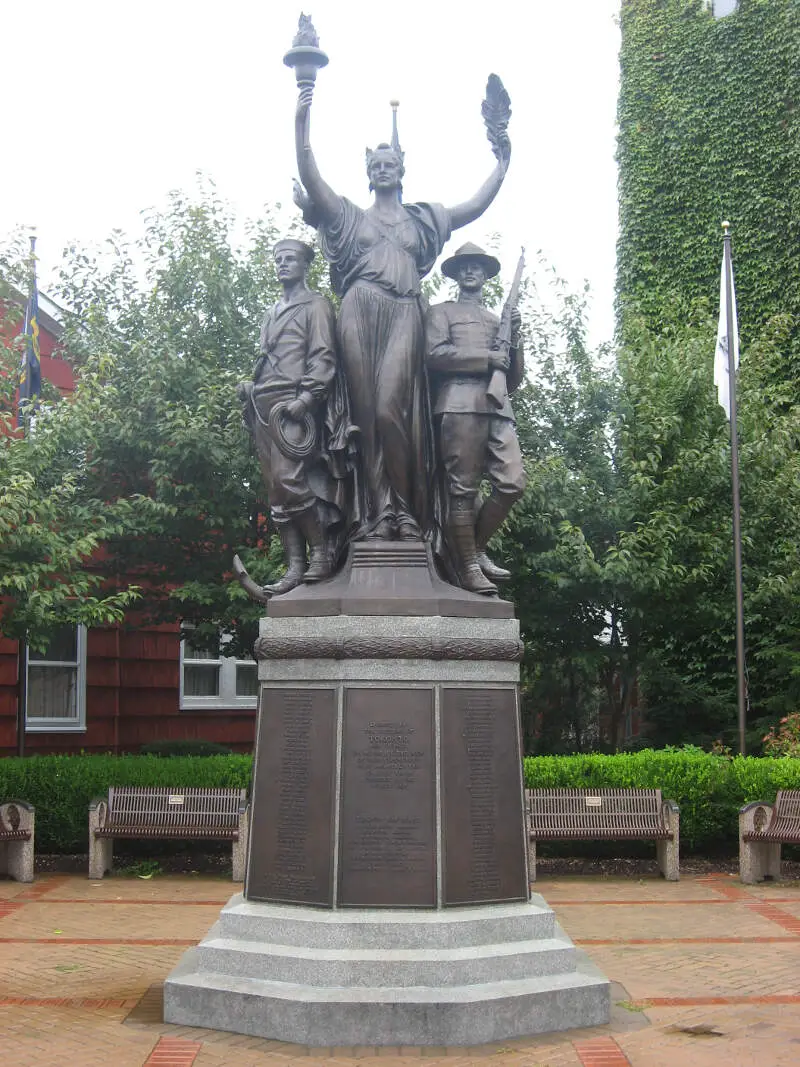
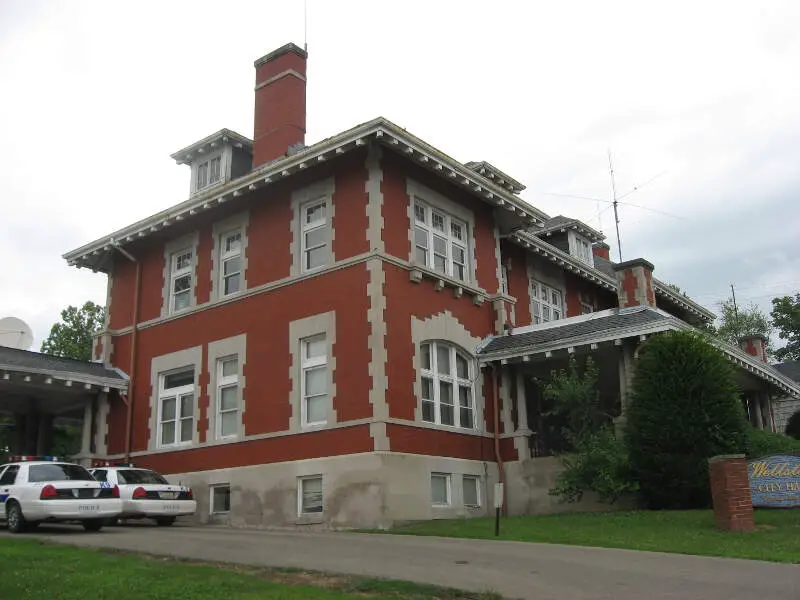
17.0% divorced · #2 highest divorce rate in Ohio
Toronto is the second-largest city in Jefferson County, Ohio, United States, along the Ohio River. The population was 5,091 at the 2010 census. It is part of the Weirton-Steubenville, WV-OH Metropolitan Statistical Area.
Data | Crime | Cost of living | Movers
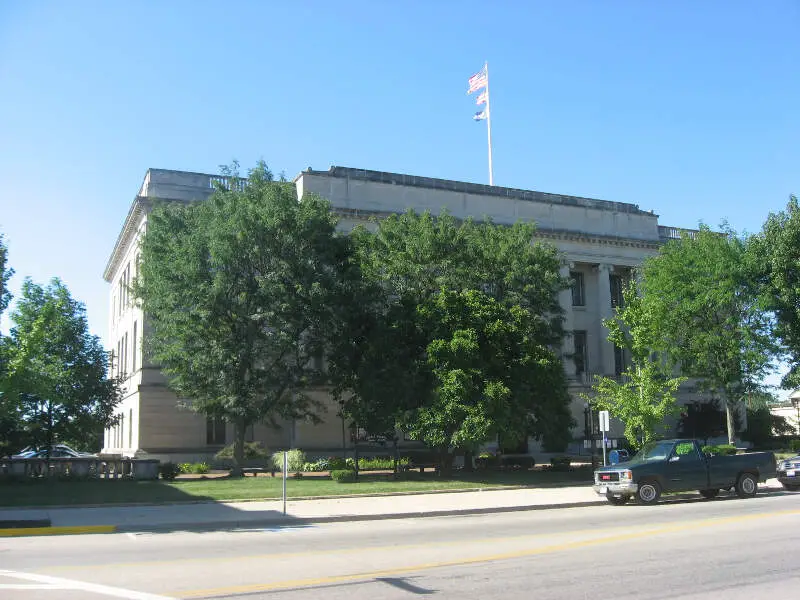
16.0% divorced · #5 highest divorce rate in Ohio
Bryan is a city in and the county seat of Williams County, Ohio, United States, in the state’s northwestern corner. The population was 8,545 at the 2010 census.
Data | Crime | Cost of living | Movers

16.0% divorced · #5 highest divorce rate in Ohio
Data | Crime | Cost of living | Movers
16.0% divorced · #5 highest divorce rate in Ohio
Bucyrus is a city in the U.S. state of Ohio and the county seat of Crawford County, located in northern Ohio approximately 28 miles west of Mansfield. The population was 12,362 at the 2010 census. The city is the largest in Crawford County, and the center of the Bucyrus Micropolitan Statistical Area.
Data | Crime | Cost of living | Movers
15.0% divorced · #8 highest divorce rate in Ohio
Eaton is a city in and the county seat of Preble County, Ohio, United States. The population was 8,407 at the 2010 census. Eaton’s sister city is Rdental bei Coburg.
Data | Crime | Cost of living | Movers
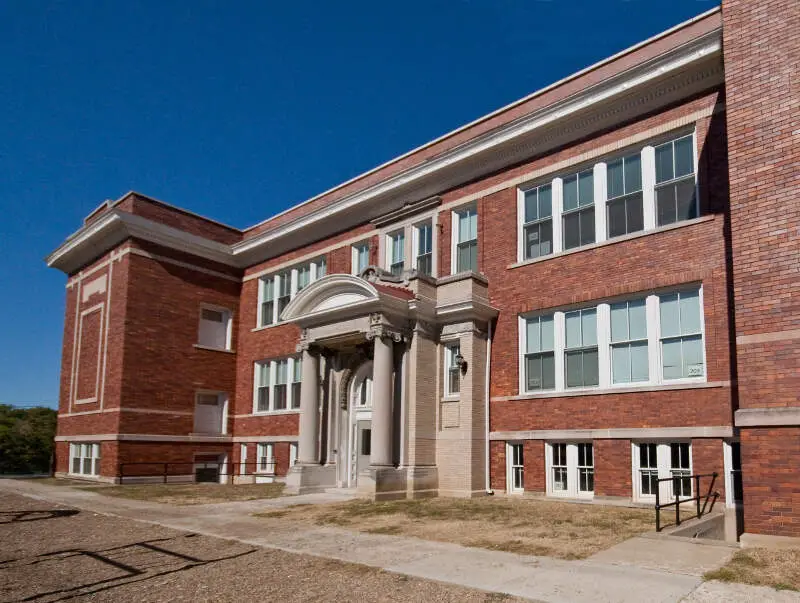
15.0% divorced · #8 highest divorce rate in Ohio
Mount Healthy is a city in Hamilton County, Ohio, United States, in the Cincinnati/Northern Kentucky metropolitan area. The population was 6,098 at the 2010 census.
Data | Crime | Cost of living | Movers

15.0% divorced · #8 highest divorce rate in Ohio
Zanesville is a city in and the county seat of Muskingum County, Ohio, United States. The population was 25,487 at the 2010 census.
Data | Crime | Cost of living | Movers
15.0% divorced · #8 highest divorce rate in Ohio
Data | Crime | Cost of living | Movers
The receipts
Compare the top ten
Pick a metric. The bars rescale. The red line is Ohio’s statewide median.
Ohio statewide median: $71,389
On the map
Where Ohio’s highest divorce rates are
Saturday Night Science
How We Determined The Places In Ohio That Get Un-Hitched The Most
We used Saturday Night Science to look at the U.S. Census Bureau on divorce rates. Because who likes tracking misery more than the U.S. government?
Specifically, we looked at the 2020-2024 American Community Survey table S1201 — Marital Status. Pretty straightforward on that front — we just had to extract the following column of data:
Today, the analysis focuses on the 248 places in Ohio with a population of over 5,000.
- Population 15 Years and Over -> Divorced
We ranked each place by the percentage of divorcees over 15 years of age from highest to lowest. We crowned the divorce capital of Ohio the place with the highest incidence of divorcees, Wellston.
And if you’re trying to avoid divorce, check out The Village of Indian Hill, the city with the lowest divorce rate in Ohio. We updated this article for 2026 and this list is our eleventh time ranking the cities in Ohio with the highest divorce rates.
The full plate
Cities With The Highest Divorce Rates In Ohio
Click any column to sort. Search by city name.
| Rank | City | Population | Divorcees | Divorce Rate |
|---|---|---|---|---|
| 1 | Wellston | 5,452 | 960 | 22.0% |
| 2 | Canal Fulton | 5,337 | 726 | 17.0% |
| 2 | Toronto | 5,293 | 720 | 17.0% |
| 5 | Bryan | 8,631 | 1,105 | 16.0% |
| 5 | Sheffield Lake | 8,966 | 1,148 | 16.0% |
| 5 | Bucyrus | 11,594 | 1,484 | 16.0% |
| 8 | Eaton | 8,339 | 1,001 | 15.0% |
| 8 | Mount Healthy | 6,919 | 830 | 15.0% |
| 8 | Zanesville | 24,740 | 2,969 | 15.0% |
| 8 | Mentor-on-the-Lake | 7,111 | 853 | 15.0% |
| 14 | London | 10,484 | 1,174 | 14.0% |
| 14 | Coshocton | 11,068 | 1,240 | 14.0% |
| 14 | Ashtabula | 17,856 | 2,000 | 14.0% |
| 14 | Chillicothe | 21,902 | 2,453 | 14.0% |
| 14 | Bedford | 12,931 | 1,448 | 14.0% |
| 14 | Greenville | 12,741 | 1,427 | 14.0% |
| 14 | Mayfield Heights | 20,022 | 2,242 | 14.0% |
| 14 | Marion | 35,669 | 3,995 | 14.0% |
| 28 | Mansfield | 47,663 | 4,957 | 13.0% |
| 28 | Urbana | 11,204 | 1,165 | 13.0% |
| 28 | Hillsboro | 6,527 | 679 | 13.0% |
| 28 | Middleburg Heights | 15,786 | 1,642 | 13.0% |
| 28 | Painesville | 20,548 | 2,137 | 13.0% |
| 28 | Washington Court House | 14,439 | 1,502 | 13.0% |
| 28 | Shelby | 8,865 | 922 | 13.0% |
| 28 | Massillon | 32,338 | 3,363 | 13.0% |
| 28 | Willard | 6,164 | 641 | 13.0% |
| 28 | Logan | 6,993 | 727 | 13.0% |
| 28 | Jackson | 6,231 | 648 | 13.0% |
| 28 | Mount Vernon | 17,052 | 1,773 | 13.0% |
| 28 | Fostoria | 12,344 | 1,284 | 13.0% |
| 28 | Cambridge | 10,060 | 1,046 | 13.0% |
| 28 | Louisville | 9,602 | 999 | 13.0% |
| 28 | Bedford Heights | 10,847 | 1,128 | 13.0% |
| 28 | Geneva | 5,886 | 612 | 13.0% |
| 28 | Eastlake | 17,493 | 1,819 | 13.0% |
| 28 | Maple Heights | 23,258 | 2,419 | 13.0% |
| 50 | Euclid | 48,823 | 4,687 | 12.0% |
| 50 | Milford | 6,497 | 624 | 12.0% |
| 50 | Girard | 9,505 | 912 | 12.0% |
| 50 | Napoleon | 8,802 | 845 | 12.0% |
| 50 | East Cleveland | 13,534 | 1,299 | 12.0% |
| 50 | Deer Park | 5,384 | 517 | 12.0% |
| 50 | Celina | 10,903 | 1,047 | 12.0% |
| 50 | Cheviot | 8,660 | 831 | 12.0% |
| 50 | Sandusky | 24,606 | 2,362 | 12.0% |
| 50 | Piqua | 20,646 | 1,982 | 12.0% |
| 50 | East Liverpool | 9,783 | 939 | 12.0% |
| 50 | Van Wert | 10,790 | 1,036 | 12.0% |
| 50 | Bellevue | 8,187 | 786 | 12.0% |
| 50 | Lima | 35,010 | 3,361 | 12.0% |
| 50 | Canton | 69,755 | 6,696 | 12.0% |
| 50 | Portsmouth | 17,728 | 1,702 | 12.0% |
| 50 | Galion | 10,339 | 993 | 12.0% |
| 50 | Grafton | 5,657 | 543 | 12.0% |
| 50 | Warrensville Heights | 13,545 | 1,300 | 12.0% |
| 50 | Salem | 11,758 | 1,129 | 12.0% |
| 50 | Upper Sandusky | 6,558 | 630 | 12.0% |
| 50 | Clyde | 6,331 | 608 | 12.0% |
| 50 | Springfield | 58,190 | 5,586 | 12.0% |
| 50 | Warren | 38,912 | 3,736 | 12.0% |
| 50 | Alliance | 21,478 | 2,062 | 12.0% |
| 50 | Wilmington | 12,620 | 1,212 | 12.0% |
| 78 | Willoughby Hills | 9,975 | 878 | 11.0% |
| 78 | Vandalia | 15,053 | 1,325 | 11.0% |
| 78 | Akron | 189,247 | 16,654 | 11.0% |
| 78 | Circleville | 14,142 | 1,244 | 11.0% |
| 78 | Wauseon | 7,505 | 660 | 11.0% |
| 78 | Norwalk | 17,095 | 1,504 | 11.0% |
| 78 | Niles | 18,287 | 1,609 | 11.0% |
| 78 | Findlay | 40,287 | 3,545 | 11.0% |
| 78 | Lancaster | 41,249 | 3,630 | 11.0% |
| 78 | Bellefontaine | 13,807 | 1,215 | 11.0% |
| 78 | Hubbard | 7,598 | 669 | 11.0% |
| 78 | Brunswick | 35,246 | 3,102 | 11.0% |
| 78 | Barberton | 24,844 | 2,186 | 11.0% |
| 78 | Tiffin | 17,818 | 1,568 | 11.0% |
| 78 | Uhrichsville | 5,189 | 457 | 11.0% |
| 78 | Sidney | 20,501 | 1,804 | 11.0% |
| 78 | Toledo | 267,463 | 23,537 | 11.0% |
| 78 | Ontario | 6,667 | 587 | 11.0% |
| 78 | South Lebanon | 6,712 | 591 | 11.0% |
| 78 | Struthers | 9,923 | 873 | 11.0% |
| 78 | Canfield | 7,649 | 673 | 11.0% |
| 78 | Reading | 10,502 | 924 | 11.0% |
| 78 | Campbell | 7,784 | 685 | 11.0% |
| 78 | Cortland | 7,080 | 623 | 11.0% |
| 78 | Riverside | 24,435 | 2,150 | 11.0% |
| 78 | Newark | 50,783 | 4,469 | 11.0% |
| 78 | Brook Park | 18,284 | 1,609 | 11.0% |
| 78 | Olmsted Falls | 8,639 | 760 | 11.0% |
| 78 | Hamilton | 63,468 | 5,585 | 11.0% |
| 106 | Fairborn | 34,534 | 2,763 | 10.0% |
| 106 | Trotwood | 23,041 | 1,843 | 10.0% |
| 106 | Medina | 25,950 | 2,076 | 10.0% |
| 106 | New Carlisle | 5,544 | 444 | 10.0% |
| 106 | New Philadelphia | 17,520 | 1,402 | 10.0% |
| 106 | Fremont | 15,835 | 1,267 | 10.0% |
| 106 | Brookville | 5,779 | 462 | 10.0% |
| 106 | Middletown | 51,617 | 4,129 | 10.0% |
Source: U.S. Census ACS 2020-2024. 248 cities with more than 5,000 residents.
Summary
Getting Some Closure In Ohio After Untying The Knot
We now have a sense of what places in the Buckeye State don’t pay much attention to the whole “’til death do we part” phrase.
The cities with the highest divorce rate in Ohio are Wellston, Canal Fulton, Toronto, Bryan, Sheffield Lake, Bucyrus, Eaton, Mount Healthy, Zanesville, and Mentor-on-the-Lake.
Try to keep in mind that the reason cities rank where they do in Ohio could be because of the age, education, and income distribution, as all of those things impact the rate of divorce.