Most Asian cities in North Carolina research summary. We analyzed North Carolina’s most recent Census data to determine the most Asian cities in North Carolina based on the percentage of Asian residents. Here are the results of our analysis:
-
The most Asian city in North Carolina is Morrisville based on the most recent Census data.
-
Morrisville is 41.02% Asian.
-
The least Asian city in North Carolina is Hamlet.
-
Hamlet is 0.0% Asian.
-
North Carolina is 3.3% Asian.
-
North Carolina is the 22nd most Asian state in the United States.
Table Of Contents: Top Ten | Methodology | Summary | Table
Here are the cities in North Carolina with the largest Asian population in 2026:
Which city in North Carolina had the largest Asian population? Morrisville took the number one overall spot for the largest Asian in North Carolina for 2026. 41.02% of Morrisville identify as Asian.
Read below to see how we crunched the numbers and how your town ranked.
To see where North Carolina ranked as a state on diversity, we have a ranking of the most diverse states in America.
And if you already knew these places were Asian, check out the best places to live in North Carolina or the most diverse places in North Carolina.
The 10 Most Asian Cities In North Carolina For 2026

/10
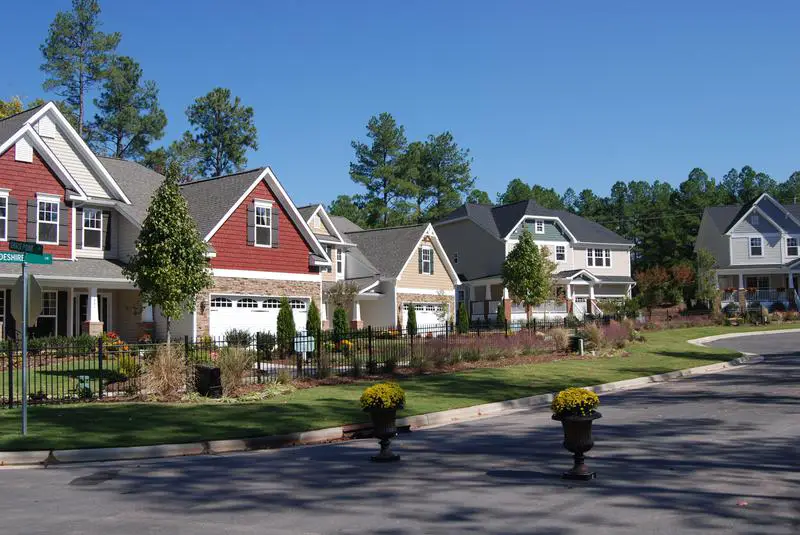
Population: 31,422
% Asian: 41.02%
# Of Asian Residents: 12,888
More on Morrisville: Data | Crime | Cost Of Living | Movers

/10
Population: 179,306
% Asian: 20.32%
# Of Asian Residents: 36,439
More on Cary: Data | Crime | Cost Of Living | Movers

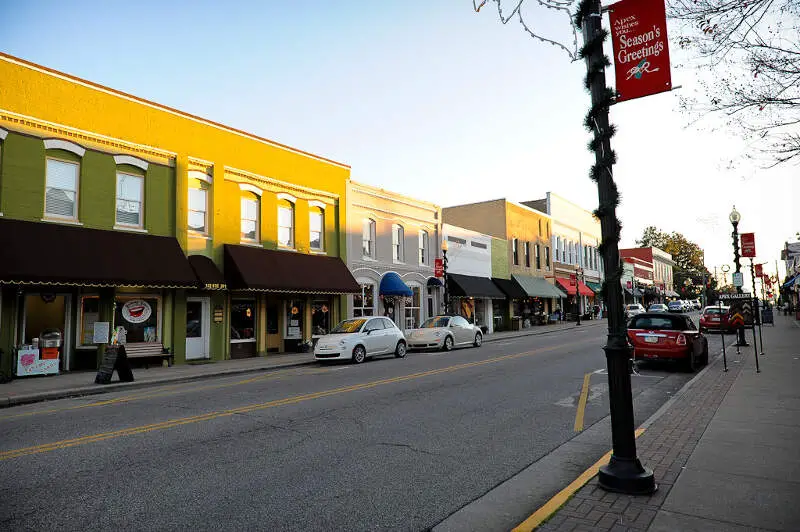
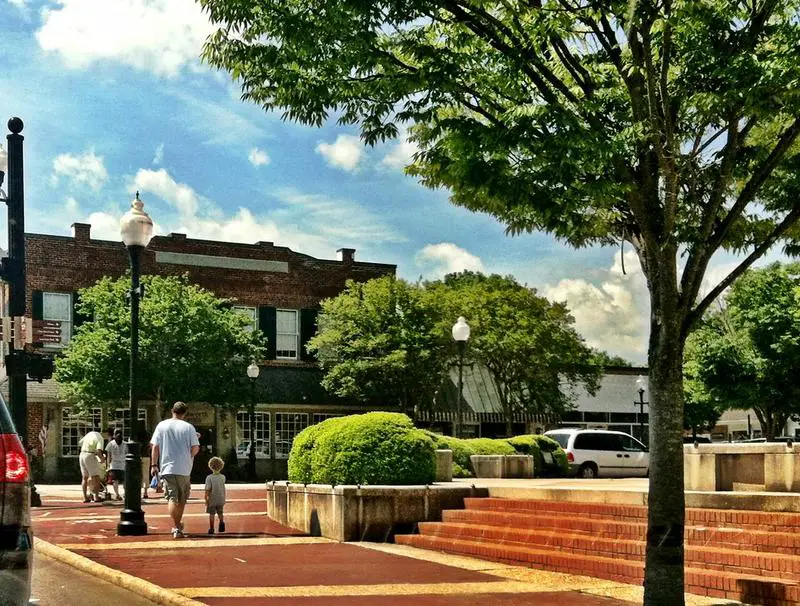
/10
Population: 70,630
% Asian: 19.5%
# Of Asian Residents: 13,770
More on Apex: Data | Crime | Cost Of Living | Movers

/10
Population: 19,633
% Asian: 14.74%
# Of Asian Residents: 2,894
More on Harrisburg: Data | Cost Of Living | Movers

/10
Population: 61,607
% Asian: 13.36%
# Of Asian Residents: 8,232
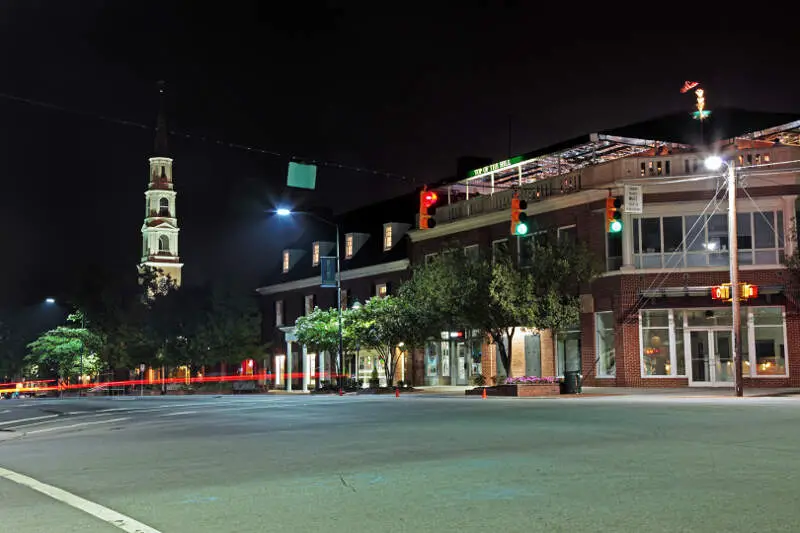
More on Chapel Hill: Data | Crime | Cost Of Living | Movers

/10
Population: 7,744
% Asian: 10.78%
# Of Asian Residents: 835
More on Oak Ridge: Data | Cost Of Living | Movers

/10
Population: 12,087
% Asian: 9.42%
# Of Asian Residents: 1,139
More on Archdale: Data | Crime | Cost Of Living | Movers

/10
Population: 13,333
% Asian: 9.21%
# Of Asian Residents: 1,228
More on Newton: Data | Crime | Cost Of Living | Movers

/10
Population: 13,805
% Asian: 8.82%
# Of Asian Residents: 1,217
More on Weddington: Data | Cost Of Living | Movers

/10
Population: 45,248
% Asian: 8.68%
# Of Asian Residents: 3,929
More on Holly Springs: Data | Crime | Cost Of Living | Movers
Methodology: How We Determined The Cities In North Carolina With The Largest Asian Population For 2026
We used Saturday Night Science to compare Census data on race across every place in North Carolina.
The Census’s most recently available data comes from the 2020-2024 American Community Survey.
Specifically, we looked at table B03002: Hispanic OR LATINO ORIGIN BY RACE. Here are the category names as defined by the Census:
- Hispanic or Latino
- White alone*
- Black or African American alone*
- American Indian and Alaska Native alone*
- Asian alone*
- Native Hawaiian and Other Pacific Islander alone*
- Some other race alone*
- Two or more races*
Our particular column of interest here was the number of people who identified as Asian alone.
We limited our analysis to cities with a population greater than 5,000 people. That left us with 124 cities.
We then calculated the percentage of residents that are Asian. The percentages ranked from 41.0% to 0.0%.
Finally, we ranked each city based on the percentage of Asian population, with a higher score being more Asian than a lower score. Morrisville took the distinction of being the most Asian, while Hamlet was the least Asian city.
We updated this article for 2026. This report reflects our eleventh time ranking the cities in North Carolina with the largest Asian population.
Read on for more information on how the cities in North Carolina ranked by population of Asian residents or, for a more general take on diversity in America, head over to our ranking of the most diverse cities in America.
Summary: Asian Populations Across North Carolina
If you’re looking for a breakdown of Asian populations across North Carolina according to the most recent data, this is an accurate list.
The most Asian cities in North Carolina are Morrisville, Cary, Apex, Harrisburg, Chapel Hill, Oak Ridge, Archdale, Newton, Weddington, and Holly Springs.
If you’re curious enough, here are the least Asian places in North Carolina:
- Hamlet
- Sawmills
- Siler City
For more North Carolina reading, check out:
- Cheapest Places To Live In North Carolina
- Richest Cities In North Carolina
- Best Places To Live In North Carolina
Table: Asian Population By City In North Carolina
| Rank | City | Population | Asian Population | % Asian |
|---|---|---|---|---|
| 1 | Morrisville | 31,422 | 12,888 | 41.02% |
| 2 | Cary | 179,306 | 36,439 | 20.32% |
| 3 | Apex | 70,630 | 13,770 | 19.5% |
| 4 | Harrisburg | 19,633 | 2,894 | 14.74% |
| 5 | Chapel Hill | 61,607 | 8,232 | 13.36% |
| 6 | Oak Ridge | 7,744 | 835 | 10.78% |
| 7 | Archdale | 12,087 | 1,139 | 9.42% |
| 8 | Newton | 13,333 | 1,228 | 9.21% |
| 9 | Weddington | 13,805 | 1,217 | 8.82% |
| 10 | Holly Springs | 45,248 | 3,929 | 8.68% |
| 11 | High Point | 116,245 | 9,534 | 8.2% |
| 12 | Concord | 108,719 | 8,381 | 7.71% |
| 13 | Waxhaw | 22,275 | 1,644 | 7.38% |
| 14 | Summerfield | 11,116 | 811 | 7.3% |
| 15 | Carrboro | 21,204 | 1,529 | 7.21% |
| 16 | Stallings | 16,886 | 1,184 | 7.01% |
| 17 | Charlotte | 903,844 | 58,555 | 6.48% |
| 18 | Matthews | 30,577 | 1,968 | 6.44% |
| 19 | Huntersville | 63,969 | 4,116 | 6.43% |
| 20 | Clemmons | 21,871 | 1,399 | 6.4% |
| 21 | New Bern | 32,734 | 1,934 | 5.91% |
| 22 | Durham | 291,467 | 16,949 | 5.82% |
| 23 | Woodfin | 8,048 | 445 | 5.53% |
| 24 | Greensboro | 301,198 | 15,785 | 5.24% |
| 25 | Mint Hill | 27,556 | 1,440 | 5.23% |
| 26 | Raleigh | 481,031 | 24,783 | 5.15% |
| 27 | Knightdale | 20,214 | 1,019 | 5.04% |
| 28 | Hickory | 44,258 | 2,106 | 4.76% |
| 29 | Marion | 7,579 | 350 | 4.62% |
| 30 | Mebane | 19,538 | 884 | 4.52% |
| 31 | Wesley Chapel | 9,090 | 407 | 4.48% |
| 32 | Pineville | 11,055 | 494 | 4.47% |
| 33 | Mills River | 7,281 | 325 | 4.46% |
| 34 | Mooresville | 52,381 | 2,288 | 4.37% |
| 35 | Elon | 11,032 | 465 | 4.22% |
| 36 | Havelock | 17,691 | 728 | 4.12% |
| 37 | Fletcher | 8,098 | 314 | 3.88% |
| 38 | Lexington | 19,690 | 727 | 3.69% |
| 39 | Indian Trail | 42,036 | 1,487 | 3.54% |
| 40 | Albemarle | 16,762 | 588 | 3.51% |
| 41 | Belmont | 15,546 | 544 | 3.5% |
| 42 | Mount Holly | 18,208 | 620 | 3.41% |
| 43 | Garner | 34,473 | 1,118 | 3.24% |
| 44 | Aberdeen | 9,228 | 297 | 3.22% |
| 45 | Kannapolis | 57,890 | 1,825 | 3.15% |
| 46 | Cornelius | 32,783 | 1,029 | 3.14% |
| 47 | Fayetteville | 210,815 | 6,298 | 2.99% |
| 48 | Davidson | 15,660 | 467 | 2.98% |
| 49 | Wake Forest | 52,844 | 1,554 | 2.94% |
| 50 | Fuquay-Varina | 40,485 | 1,177 | 2.91% |
| 51 | Burlington | 59,610 | 1,685 | 2.83% |
| 52 | Hillsborough | 9,724 | 272 | 2.8% |
| 53 | Greenville | 92,857 | 2,545 | 2.74% |
| 54 | Kings Mountain | 12,039 | 317 | 2.63% |
| 55 | Jacksonville | 71,279 | 1,792 | 2.51% |
| 56 | Winston-Salem | 252,037 | 5,756 | 2.28% |
| 57 | Mount Airy | 10,633 | 239 | 2.25% |
| 58 | Spring Lake | 11,573 | 255 | 2.2% |
| 59 | Williamston | 5,112 | 111 | 2.17% |
| 60 | Trinity | 7,111 | 149 | 2.1% |
| 61 | Kernersville | 27,830 | 561 | 2.02% |
| 62 | Smithfield | 12,116 | 227 | 1.87% |
| 63 | Hope Mills | 17,939 | 335 | 1.87% |
| 64 | Statesville | 29,894 | 552 | 1.85% |
| 65 | Pinehurst | 18,256 | 332 | 1.82% |
| 66 | Boone | 20,032 | 364 | 1.82% |
| 67 | Wilson | 48,370 | 831 | 1.72% |
| 68 | Laurinburg | 15,087 | 251 | 1.66% |
| 69 | Goldsboro | 34,383 | 558 | 1.62% |
| 70 | Clinton | 8,304 | 133 | 1.6% |
| 71 | Forest City | 7,363 | 116 | 1.58% |
| 72 | Lumberton | 18,859 | 290 | 1.54% |
| 73 | Rocky Mount | 54,297 | 800 | 1.47% |
| 74 | Kinston | 19,505 | 286 | 1.47% |
| 75 | Southern Pines | 16,420 | 237 | 1.44% |
| 76 | Henderson | 14,885 | 201 | 1.35% |
| 77 | Morganton | 17,646 | 238 | 1.35% |
| 78 | Wilmington | 120,805 | 1,561 | 1.29% |
| 79 | Gastonia | 82,884 | 1,056 | 1.27% |
| 80 | Kill Devil Hills | 7,761 | 98 | 1.26% |
| 81 | Carolina Beach | 6,745 | 78 | 1.16% |
| 82 | Roanoke Rapids | 14,856 | 169 | 1.14% |
| 83 | Asheville | 94,535 | 1,021 | 1.08% |
| 84 | Asheboro | 27,580 | 294 | 1.07% |
| 85 | Morehead City | 9,806 | 103 | 1.05% |
| 86 | Elizabeth City | 18,871 | 198 | 1.05% |
| 87 | Wendell | 13,064 | 137 | 1.05% |
| 88 | Salisbury | 35,825 | 372 | 1.04% |
| 89 | Monroe | 36,759 | 363 | 0.99% |
| 90 | Sanford | 31,478 | 297 | 0.94% |
| 91 | Lenoir | 18,299 | 172 | 0.94% |
| 92 | Winterville | 10,725 | 96 | 0.9% |
| 93 | Shelby | 22,100 | 196 | 0.89% |
| 94 | Rockingham | 8,967 | 79 | 0.88% |
| 95 | Thomasville | 27,321 | 218 | 0.8% |
| 96 | Hendersonville | 15,408 | 118 | 0.77% |
| 97 | Gibsonville | 9,467 | 68 | 0.72% |
| 98 | Graham | 18,048 | 126 | 0.7% |
| 99 | Oak Island | 9,030 | 61 | 0.68% |
| 100 | Leland | 29,607 | 198 | 0.67% |
| 101 | Clayton | 29,320 | 196 | 0.67% |
| 102 | Dunn | 8,559 | 54 | 0.63% |
| 103 | Selma | 6,817 | 40 | 0.59% |
| 104 | Oxford | 8,914 | 51 | 0.57% |
| 105 | Roxboro | 8,182 | 41 | 0.5% |
| 106 | Nashville | 5,729 | 27 | 0.47% |
| 107 | Black Mountain | 8,513 | 38 | 0.45% |
| 108 | Reidsville | 14,585 | 59 | 0.4% |
| 109 | Bessemer City | 5,580 | 22 | 0.39% |
| 110 | Washington | 9,726 | 34 | 0.35% |
| 111 | Brevard | 7,897 | 24 | 0.3% |
| 112 | Conover | 8,580 | 23 | 0.27% |
| 113 | King | 7,408 | 19 | 0.26% |
| 114 | Waynesville | 10,502 | 26 | 0.25% |
| 115 | Eden | 15,356 | 36 | 0.23% |
| 116 | Lewisville | 13,828 | 32 | 0.23% |
| 117 | Cherryville | 6,226 | 11 | 0.18% |
| 118 | Butner | 8,065 | 13 | 0.16% |
| 119 | Lincolnton | 11,783 | 13 | 0.11% |
| 120 | Unionville | 6,954 | 2 | 0.03% |
| 121 | Tarboro | 10,770 | 1 | 0.01% |
| 122 | Siler City | 7,995 | 0 | 0.0% |
| 123 | Sawmills | 5,042 | 0 | 0.0% |
| 124 | Hamlet | 5,961 | 0 | 0.0% |