
Racial diversity in Wisconsin is a mixed bag.
There are parts of Wisconsin where there’s a high level of diversity. But where will you find the most diverse places in Wisconsin?
To answer that question, we went to the US Census data. Using Saturday Night Science, we measured the Gini coefficient for all 146 cities in Wisconsin to rank them from most to least diverse.
Table Of Contents: Top Ten | Methodology | Summary | Table
Here are the 10 most diverse places in Wisconsin for 2026:
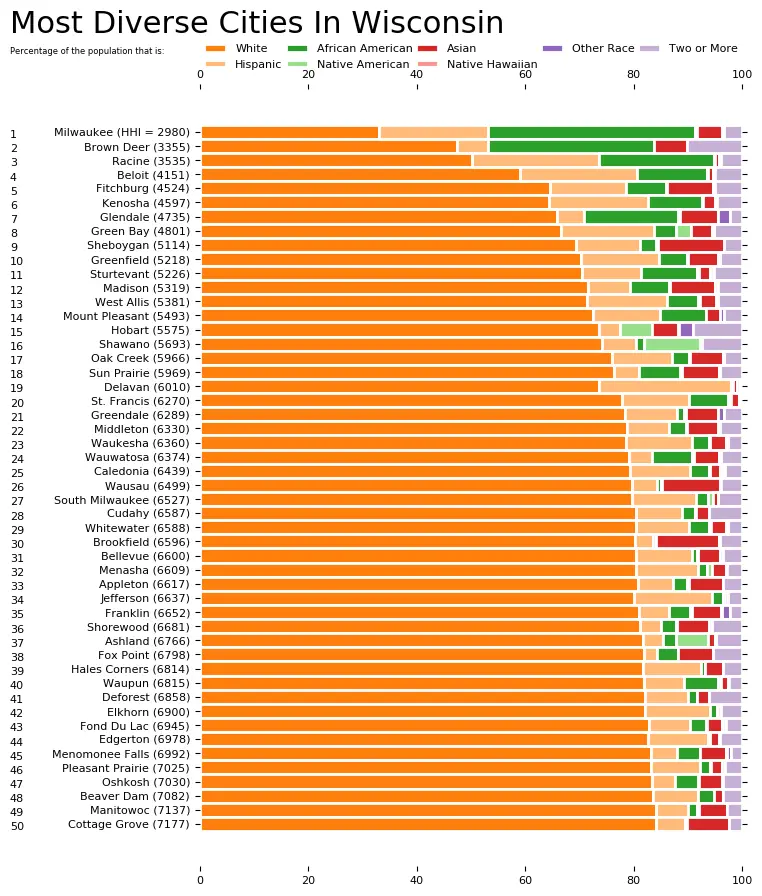
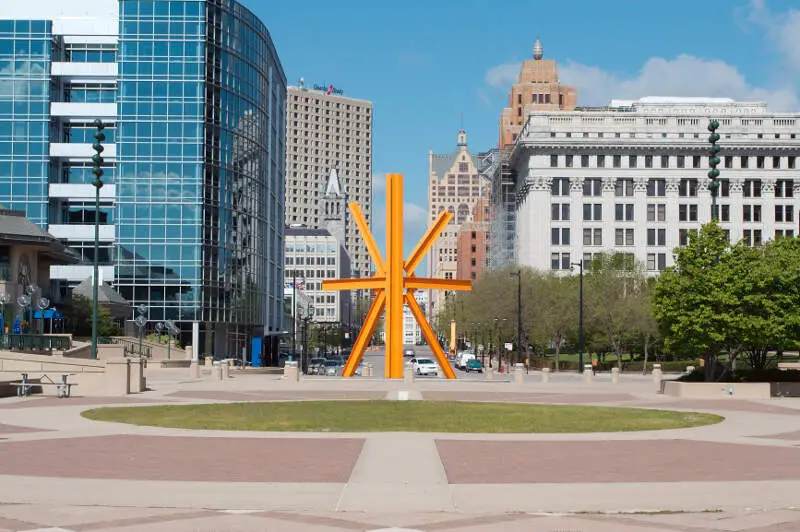
So what city is the most diverse in Wisconsin? According to the most Census data, Milwaukee took the number one over all spot for diversity in Wisconsin.
Read on below to see how we crunched the numbers and how your town ranked. To see where Wisconsin ranked as a state, we have a ranking of the most diverse states in Ameria.
For more Wisconsin reading:
The 10 Most Diverse Places In Wisconsin For 2026

/10
Population: 566,973
HHI: 2,916
% White: 31.7%
% African American: 37.9%
% Hispanic: 20.9%
% Asian: 5.0%
More on Milwaukee: Data | Crime | Cost Of Living | Movers

/10
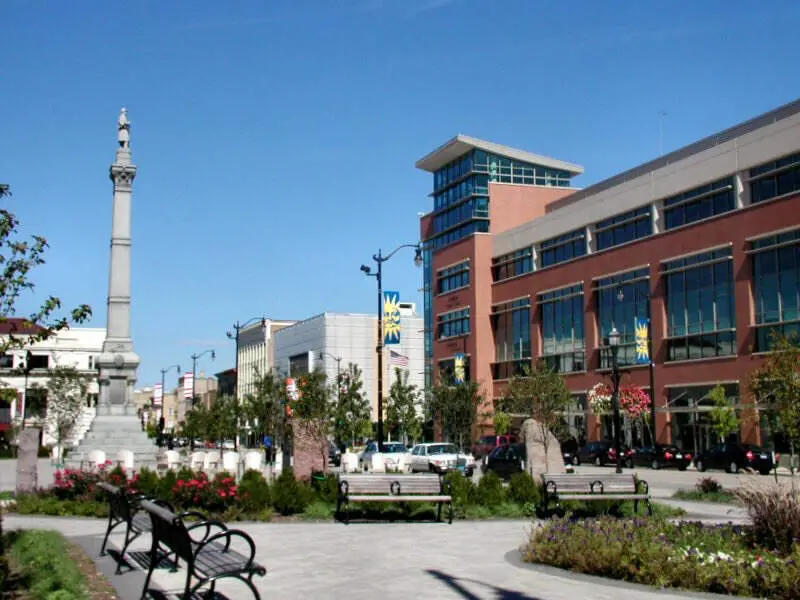
Population: 77,633
HHI: 3,430
% White: 49.0%
% African American: 20.2%
% Hispanic: 24.4%
% Asian: 0.7%
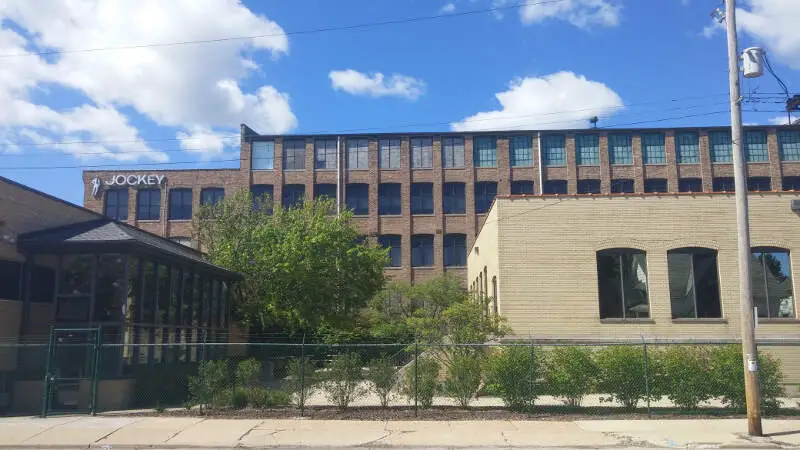
More on Racine: Data | Crime | Cost Of Living | Movers

/10
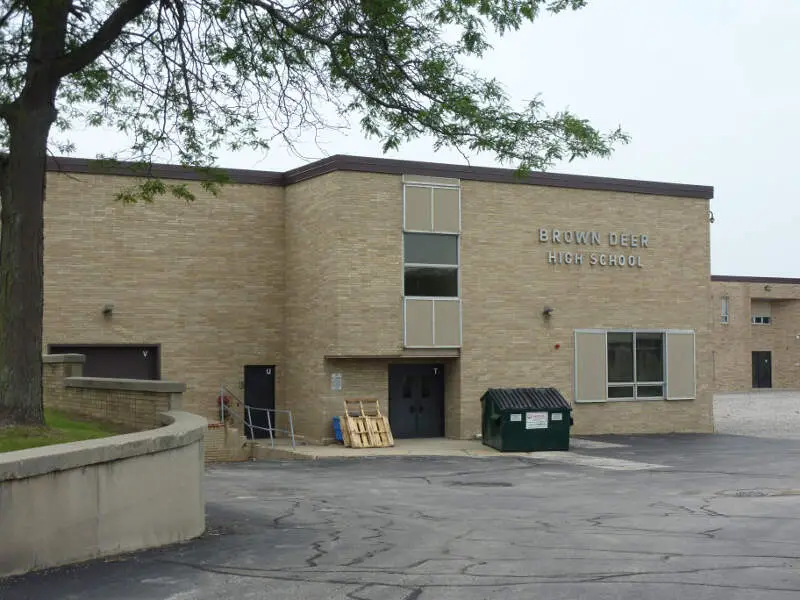
Population: 12,564
HHI: 3,506
% White: 49.8%
% African American: 29.6%
% Hispanic: 8.5%
% Asian: 6.9%
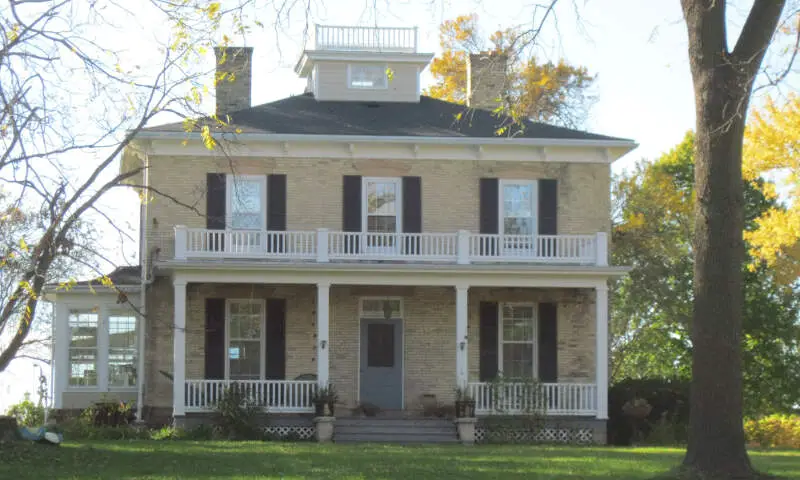
More on Brown Deer: Data | Crime | Cost Of Living | Movers

/10
Population: 36,534
HHI: 4,182
% White: 59.4%
% African American: 13.9%
% Hispanic: 21.0%
% Asian: 0.8%
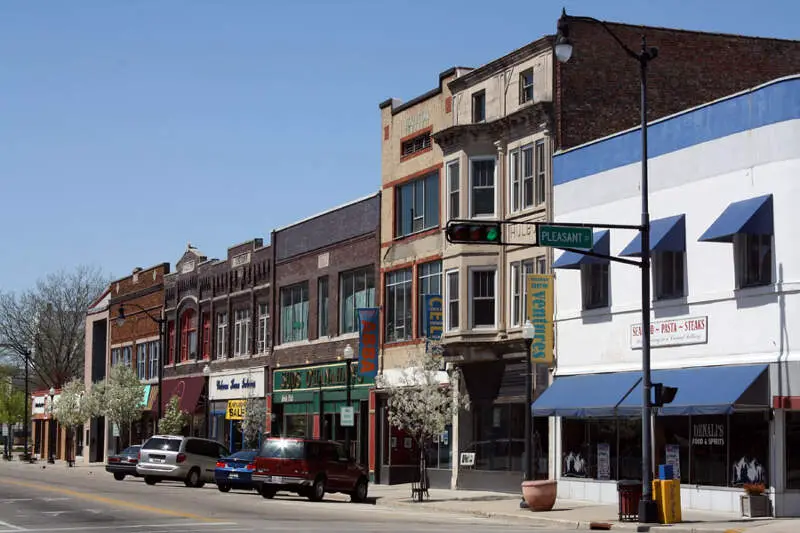
More on Beloit: Data | Crime | Cost Of Living | Movers

/10
Population: 32,619
HHI: 4,203
% White: 61.6%
% African American: 8.7%
% Hispanic: 14.4%
% Asian: 9.9%
More on Fitchburg: Data | Crime | Cost Of Living | Movers

/10
Population: 106,253
HHI: 4,519
% White: 63.9%
% African American: 3.2%
% Hispanic: 18.8%
% Asian: 4.9%
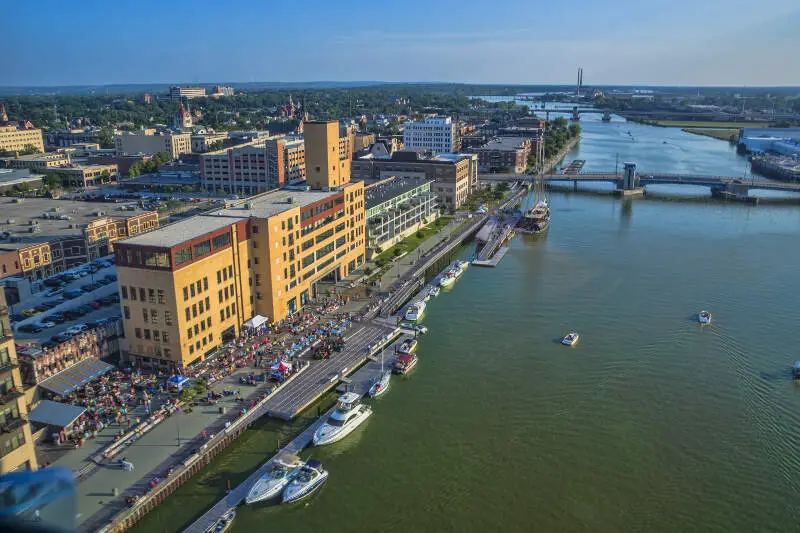
More on Green Bay: Data | Crime | Cost Of Living | Movers

/10
Population: 99,372
HHI: 4,526
% White: 63.6%
% African American: 9.0%
% Hispanic: 19.2%
% Asian: 1.9%
More on Kenosha: Data | Crime | Cost Of Living | Movers

/10
Population: 13,656
HHI: 4,558
% White: 64.8%
% African American: 15.8%
% Hispanic: 6.3%
% Asian: 6.8%
More on Glendale: Data | Crime | Cost Of Living | Movers

/10
Population: 37,345
HHI: 4,910
% White: 67.4%
% African American: 4.1%
% Hispanic: 16.6%
% Asian: 7.2%
More on Greenfield: Data | Crime | Cost Of Living | Movers

/10
Population: 49,645
HHI: 4,990
% White: 68.4%
% African American: 2.9%
% Hispanic: 12.9%
% Asian: 11.1%
More on Sheboygan: Data | Crime | Cost Of Living | Movers
Methodology: How we determined the most diverse cities in Wisconsin for 2026
We still believe in the accuracy of data — especially from the Census — and Saturday Night Science. So that’s where we went to get the race breakdown across Wisconsin.
That leads us to the Census’s most recently available data, the 2020-2024 American Community Survey data from the US Census.
Specifically, we looked at table B03002: HISPANIC OR LATINO ORIGIN BY RACE. Here are the category names as defined by the Census:
- White alone*
- Black or African American alone*
- American Indian and Alaska Native alone*
- Asian alone*
- Native Hawaiian and Other Pacific Islander alone*
- Some other race alone*
- Two or more races*
- Hispanic or Latino
We limited our analysis to non-CDPs with a population greater than 5,000 people. That left us with 146 cities.
We then calculated the HHI for each city by finding the racial breakdown of a city in percent terms, squaring them, and then adding the squares together. This left us with scores ranging from 2,916 (Milwaukee) to 9,277 (Mayville).
Finally, we ranked each city based on the HHI, with a lower score being more diverse than a high score. Milwaukee took the distinction of being the most diverse, while Mayville was the least diverse city.
We updated this article for 2026. This report is our eleventh time ranking the most diverse places in Wisconsin.
Summary: Diversity Across Wisconsin
If you’re looking for a scientific breakdown of diversity across Wisconsin, this is an accurate list.
The most diverse cities in Wisconsin are Milwaukee, Racine, Brown Deer, Beloit, Fitchburg, Green Bay, Kenosha, Glendale, Greenfield, and Sheboygan.
If you’re curious enough, here are the least diverse places in Wisconsin:
- Mayville
- Richfield
- Slinger
For more Wisconsin reading, check out:
- Best Places To Live In Wisconsin
- Cheapest Places To Live In Wisconsin
- Most Dangerous Cities In Wisconsin
- Best Places To Raise A Family In Wisconsin
- Safest Places In Wisconsin
- Worst Places To Live In Wisconsin
Race By City In Wisconsin For 2026
| Rank | City | Population | HHI | % White | % Black | % Hispanic | % Asian |
|---|---|---|---|---|---|---|---|
| 1 | Milwaukee, WI | 566,973 | 2,916 | 31.7% | 37.9% | 20.9% | 5.0% |
| 2 | Racine, WI | 77,633 | 3,430 | 49.0% | 20.2% | 24.4% | 0.7% |
| 3 | Brown Deer, WI | 12,564 | 3,506 | 49.8% | 29.6% | 8.5% | 6.9% |
| 4 | Beloit, WI | 36,534 | 4,182 | 59.4% | 13.9% | 21.0% | 0.8% |
| 5 | Fitchburg, WI | 32,619 | 4,203 | 61.6% | 8.7% | 14.4% | 9.9% |
| 6 | Green Bay, WI | 106,253 | 4,519 | 63.9% | 3.2% | 18.8% | 4.9% |
| 7 | Kenosha, WI | 99,372 | 4,526 | 63.6% | 9.0% | 19.2% | 1.9% |
| 8 | Glendale, WI | 13,656 | 4,558 | 64.8% | 15.8% | 6.3% | 6.8% |
| 9 | Greenfield, WI | 37,345 | 4,910 | 67.4% | 4.1% | 16.6% | 7.2% |
| 10 | Sheboygan, WI | 49,645 | 4,990 | 68.4% | 2.9% | 12.9% | 11.1% |
| 11 | Madison, WI | 278,001 | 5,069 | 69.6% | 7.2% | 9.4% | 8.0% |
| 12 | Sturtevant, WI | 6,772 | 5,179 | 70.1% | 13.4% | 8.2% | 2.0% |
| 13 | West Allis, WI | 59,612 | 5,220 | 69.8% | 5.0% | 17.1% | 2.7% |
| 14 | Mount Pleasant, WI | 27,953 | 5,323 | 71.1% | 8.3% | 13.4% | 2.5% |
| 15 | Middleton, WI | 22,301 | 5,422 | 71.8% | 2.6% | 13.6% | 7.3% |
| 16 | Sun Prairie, WI | 37,570 | 5,542 | 73.2% | 8.5% | 4.7% | 8.6% |
| 17 | Oak Creek, WI | 37,325 | 5,555 | 73.0% | 4.4% | 12.2% | 6.1% |
| 18 | Waupun, WI | 11,174 | 5,935 | 75.7% | 10.4% | 9.3% | 1.2% |
| 19 | Pleasant Prairie, WI | 21,669 | 6,078 | 76.8% | 3.1% | 12.5% | 3.0% |
| 20 | Delavan, WI | 8,689 | 6,101 | 75.0% | 1.4% | 21.8% | 0.1% |
| 21 | Hobart, WI | 10,610 | 6,137 | 77.6% | 0.1% | 6.1% | 1.8% |
| 22 | Wauwatosa, WI | 48,529 | 6,141 | 77.6% | 7.1% | 5.0% | 4.6% |
| 23 | Shorewood, WI | 13,627 | 6,156 | 77.7% | 3.8% | 6.6% | 5.5% |
| 24 | South Milwaukee, WI | 20,442 | 6,159 | 77.2% | 2.5% | 12.2% | 1.3% |
| 25 | Brookfield, WI | 41,273 | 6,182 | 77.5% | 1.4% | 4.4% | 11.2% |
| 26 | Wausau, WI | 39,996 | 6,183 | 77.6% | 0.4% | 5.4% | 10.4% |
| 27 | St. Francis, WI | 9,004 | 6,219 | 77.7% | 6.6% | 11.6% | 1.4% |
| 28 | Cudahy, WI | 17,853 | 6,233 | 77.9% | 2.8% | 11.4% | 2.0% |
| 29 | Reedsburg, WI | 10,168 | 6,264 | 77.7% | 0.5% | 14.3% | 0.1% |
| 30 | Caledonia, WI | 25,257 | 6,278 | 78.1% | 2.4% | 12.2% | 1.4% |
| 31 | Waukesha, WI | 71,233 | 6,293 | 78.2% | 2.6% | 12.3% | 2.6% |
| 32 | Shawano, WI | 9,522 | 6,324 | 78.6% | 0.8% | 4.5% | 0.2% |
| 33 | Menasha, WI | 18,273 | 6,379 | 78.8% | 1.5% | 12.3% | 2.9% |
| 34 | Appleton, WI | 75,023 | 6,431 | 79.5% | 2.8% | 6.6% | 6.6% |
| 35 | Greendale, WI | 14,594 | 6,484 | 79.5% | 1.1% | 11.3% | 4.2% |
| 36 | Elkhorn, WI | 10,221 | 6,506 | 79.2% | 1.3% | 14.5% | 1.1% |
| 37 | Bellevue, WI | 16,442 | 6,511 | 79.7% | 1.9% | 11.7% | 2.8% |
| 38 | Whitewater, WI | 15,807 | 6,540 | 80.1% | 3.1% | 10.3% | 3.1% |
| 39 | Jefferson, WI | 7,732 | 6,555 | 79.5% | 1.2% | 14.6% | 0.1% |
| 40 | Fond Du Lac, WI | 44,494 | 6,559 | 80.3% | 3.0% | 9.4% | 3.6% |
| 41 | Ashland, WI | 7,902 | 6,614 | 80.7% | 0.7% | 4.4% | 1.3% |
| 42 | Union Grove, WI | 5,036 | 6,657 | 80.8% | 8.1% | 8.1% | 0.9% |
| 43 | Fox Point, WI | 6,683 | 6,692 | 81.2% | 4.4% | 1.6% | 6.0% |
| 44 | Deforest, WI | 11,501 | 6,718 | 81.3% | 2.3% | 7.9% | 2.0% |
| 45 | Oshkosh, WI | 66,729 | 6,733 | 81.6% | 4.9% | 4.3% | 4.3% |
| 46 | Franklin, WI | 35,886 | 6,761 | 81.7% | 2.7% | 6.1% | 5.9% |
| 47 | Ashwaubenon, WI | 17,314 | 6,820 | 82.1% | 1.1% | 4.7% | 6.1% |
| 48 | Menomonee Falls, WI | 39,539 | 6,858 | 82.4% | 3.6% | 4.8% | 5.6% |
| 49 | Neenah, WI | 27,336 | 6,904 | 82.5% | 1.7% | 8.5% | 2.7% |
| 50 | New Berlin, WI | 40,270 | 6,959 | 82.9% | 2.0% | 5.7% | 6.3% |
| 51 | Manitowoc, WI | 34,620 | 6,978 | 83.0% | 1.5% | 6.6% | 4.7% |
| 52 | Whitefish Bay, WI | 14,665 | 7,006 | 83.3% | 2.4% | 5.2% | 4.6% |
| 53 | Berlin, WI | 5,562 | 7,021 | 83.0% | 0.3% | 11.1% | 2.4% |
| 54 | Hales Corners, WI | 7,689 | 7,038 | 83.3% | 0.8% | 8.9% | 3.1% |
| 55 | Sussex, WI | 12,066 | 7,057 | 83.5% | 1.9% | 1.9% | 8.0% |
| 56 | Two Rivers, WI | 11,231 | 7,068 | 83.5% | 0.4% | 6.8% | 1.1% |
| 57 | Weston, WI | 15,749 | 7,069 | 83.6% | 1.8% | 4.1% | 7.7% |
| 58 | Fort Atkinson, WI | 12,463 | 7,071 | 82.9% | 0.4% | 13.8% | 0.5% |
| 59 | Janesville, WI | 66,030 | 7,104 | 83.8% | 3.0% | 7.8% | 1.6% |
| 60 | Portage, WI | 10,236 | 7,114 | 83.9% | 5.9% | 6.4% | 0.9% |
| 61 | Edgerton, WI | 6,014 | 7,118 | 83.8% | 0.8% | 6.2% | 1.5% |
| 62 | Mukwonago, WI | 8,415 | 7,123 | 83.9% | 1.9% | 7.6% | 4.4% |
| 63 | Germa, WI | 20,962 | 7,150 | 84.2% | 3.7% | 3.1% | 5.6% |
| 64 | Mcfarland, WI | 9,160 | 7,208 | 84.5% | 1.8% | 3.8% | 4.6% |
| 65 | Onalaska, WI | 19,348 | 7,209 | 84.6% | 2.7% | 2.6% | 5.3% |
| 66 | Beaver Dam, WI | 16,565 | 7,212 | 84.2% | 1.1% | 10.6% | 1.3% |
| 67 | Hartland, WI | 9,972 | 7,214 | 84.5% | 0.6% | 5.0% | 4.1% |
| 68 | Mequon, WI | 25,270 | 7,221 | 84.6% | 2.5% | 4.3% | 4.4% |
| 69 | Burlington, WI | 10,987 | 7,239 | 84.6% | 1.5% | 8.2% | 2.2% |
| 70 | Cottage Grove, WI | 8,513 | 7,263 | 84.8% | 1.6% | 5.0% | 6.1% |
| 71 | North Fond Du Lac, WI | 5,392 | 7,314 | 84.6% | 1.0% | 12.0% | 0.0% |
| 72 | Eau Claire, WI | 70,322 | 7,364 | 85.5% | 1.6% | 2.9% | 5.4% |
| 73 | Monona, WI | 8,527 | 7,400 | 85.7% | 3.3% | 2.6% | 2.8% |
| 74 | Watertown, WI | 22,774 | 7,401 | 85.4% | 0.4% | 9.5% | 0.2% |
| 75 | Waunakee, WI | 15,687 | 7,447 | 85.9% | 1.4% | 7.3% | 1.6% |
| 76 | Oregon, WI | 11,547 | 7,497 | 86.3% | 5.3% | 2.8% | 1.3% |
| 77 | Allouez, WI | 13,975 | 7,518 | 86.3% | 6.6% | 4.2% | 0.4% |
| 78 | La Crosse, WI | 51,356 | 7,544 | 86.6% | 2.0% | 3.4% | 4.4% |
| 79 | Milton, WI | 5,706 | 7,556 | 86.3% | 0.0% | 8.9% | 0.0% |
| 80 | Stevens Point, WI | 25,785 | 7,557 | 86.7% | 1.5% | 4.5% | 3.0% |
| 81 | Plover, WI | 13,884 | 7,570 | 86.6% | 0.4% | 6.7% | 4.2% |
| 82 | De Pere, WI | 25,301 | 7,581 | 86.9% | 1.7% | 3.9% | 2.7% |
| 83 | Sparta, WI | 9,950 | 7,597 | 86.8% | 2.6% | 6.2% | 0.7% |
| 84 | Little Chute, WI | 11,754 | 7,603 | 86.9% | 1.7% | 4.9% | 2.7% |
| 85 | West Salem, WI | 5,330 | 7,618 | 86.9% | 0.1% | 2.9% | 5.0% |
| 86 | Delafield, WI | 7,202 | 7,625 | 87.0% | 1.9% | 5.3% | 2.0% |
| 87 | Altoona, WI | 8,878 | 7,651 | 87.2% | 1.3% | 5.0% | 1.1% |
| 88 | Sturgeon Bay, WI | 9,806 | 7,663 | 87.2% | 0.0% | 6.1% | 0.9% |
| 89 | Rice Lake, WI | 9,030 | 7,671 | 87.3% | 2.6% | 5.0% | 0.5% |
| 90 | Verona, WI | 15,232 | 7,687 | 87.4% | 0.4% | 5.0% | 2.3% |
| 91 | Hartford, WI | 15,821 | 7,732 | 87.6% | 0.9% | 6.1% | 1.1% |
| 92 | Pewaukee, WI | 16,211 | 7,736 | 87.7% | 0.3% | 4.1% | 4.2% |
| 93 | Baraboo, WI | 12,769 | 7,742 | 87.7% | 0.7% | 3.5% | 0.6% |
| 94 | Holmen, WI | 11,372 | 7,754 | 87.7% | 0.4% | 1.1% | 6.4% |
| 95 | Pewaukee, WI | 8,196 | 7,759 | 87.8% | 0.5% | 4.4% | 2.5% |
| 96 | Mount Horeb, WI | 7,736 | 7,769 | 87.9% | 0.9% | 4.3% | 2.0% |
| 97 | Rothschild, WI | 5,600 | 7,774 | 87.9% | 3.3% | 0.8% | 4.6% |
| 98 | New Richmond, WI | 10,539 | 7,804 | 88.0% | 1.5% | 2.5% | 0.1% |
| 99 | Lake Mills, WI | 6,470 | 7,805 | 87.9% | 1.0% | 8.6% | 0.5% |
| 100 | West Bend, WI | 32,030 | 7,816 | 88.2% | 1.9% | 4.6% | 0.9% |