Before you decide to relocate to Missouri, it’s important to research the exact cost of living around the state. And that’s what we’re going to help you do.
These are the places in Missouri that cost a pretty penny — the most expensive cities in the state.
We used Saturday Night Science to compare the 2020-2024 American Community Survey on cost of living for the 131 places in Missouri with more than 5,000 people.
After we saved up for months and could finally afford it, we landed on this list of the ten most expensive cities in Missouri for 2026.
$250,001 median income · $1,331,344 median home · #1 home prices in Missouri
Ladue is an inner-ring suburb of St. Louis, located in central St. Louis County, Missouri, United States. As of the 2013 census, the city had a population of 8,560.
Data | Crime | Cost of living | Movers
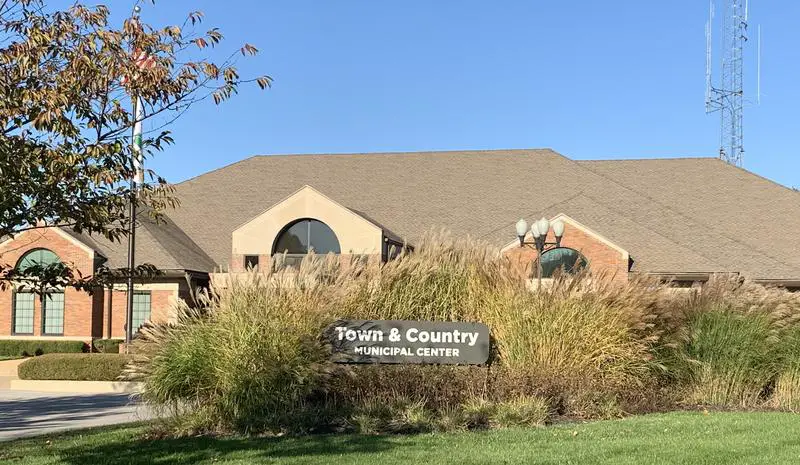
$232,534 median income · $1,146,742 median home · #2 home prices in Missouri
Data | Crime | Cost of living | Movers
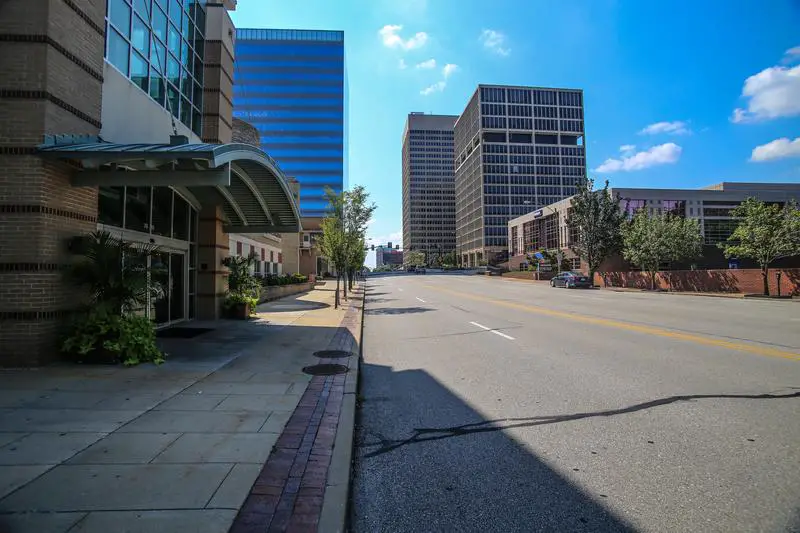
$123,000 median income · $871,223 median home · #3 home prices in Missouri
Data | Crime | Cost of living | Movers
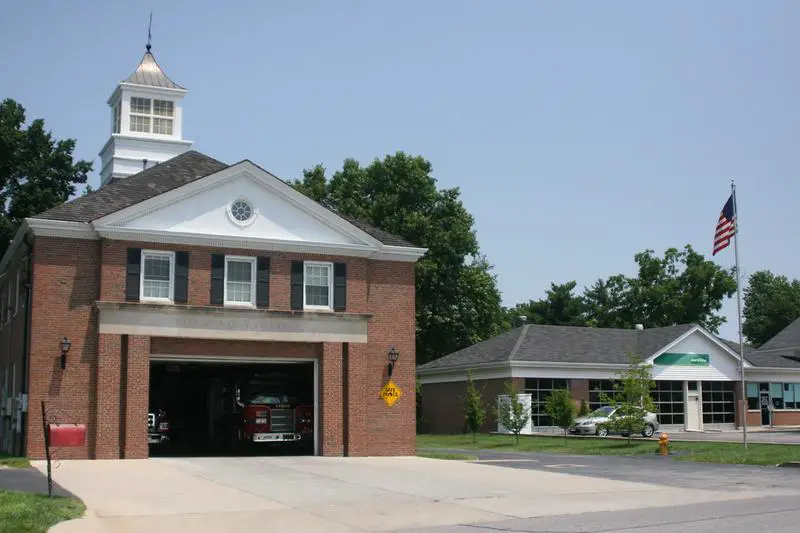
$224,327 median income · $693,377 median home · #4 home prices in Missouri
Des Peres is a city in St. Louis County, Missouri, United States. The population was 8,373 at the 2010 census.
Data | Crime | Cost of living | Movers
$138,144 median income · $610,688 median home · #7 home prices in Missouri
Sunset Hills is a city in St. Louis County, Missouri, United States. The population was 8,496 at the 2010 census.
Data | Crime | Cost of living | Movers
$127,188 median income · $614,771 median home · #6 home prices in Missouri
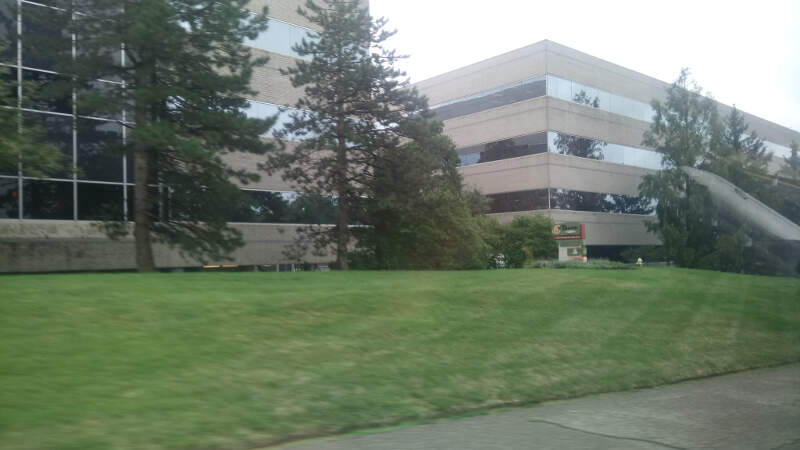
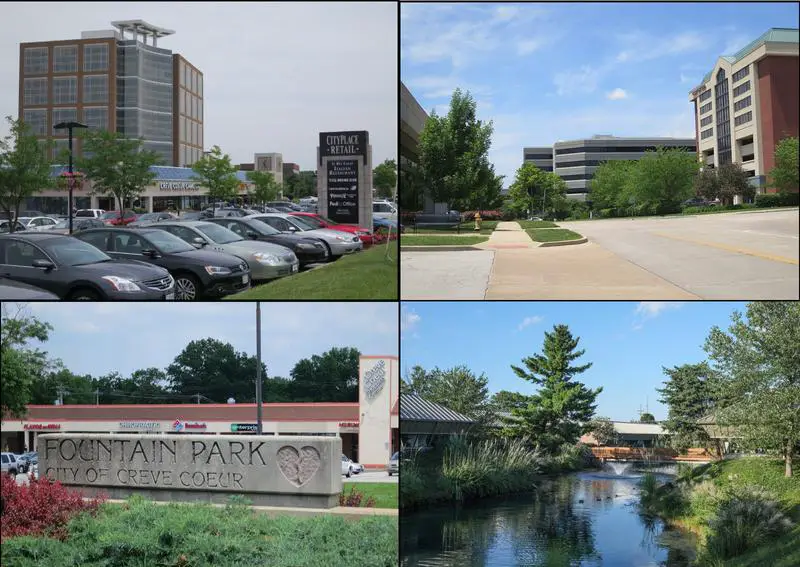
Creve Coeur is a city located in west St. Louis County, Missouri, United States, in Greater St. Louis. The population was 17,833 at the 2010 census. Creve Coeur borders and shares a ZIP code with the neighboring city of Town and Country. It is home to the headquarters of Monsanto and Drury Hotels.
Data | Crime | Cost of living | Movers
$158,548 median income · $629,191 median home · #5 home prices in Missouri
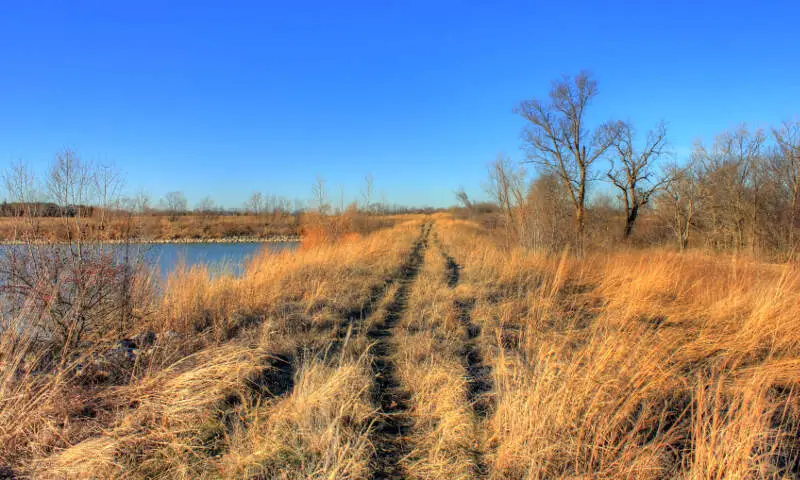
Weldon Spring is a city in St. Charles County, Missouri, United States. The population was 5,443 at the 2010 census. It was the location of the largest World War 2 explosives plant and later a uranium refining faculty.
Data | Crime | Cost of living | Movers
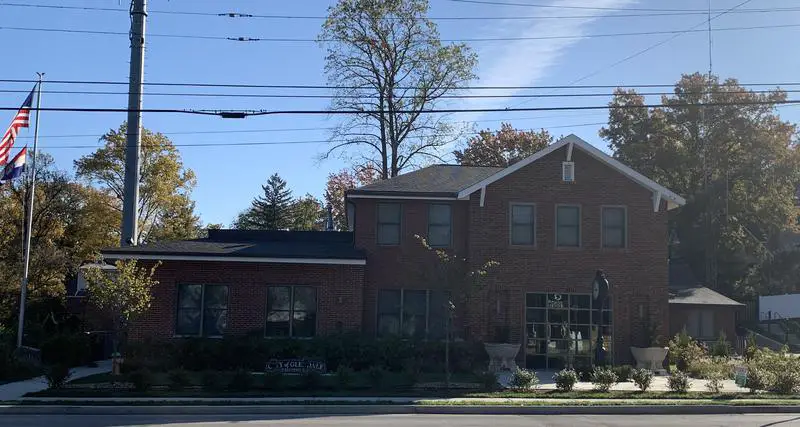
$170,700 median income · $565,844 median home · #11 home prices in Missouri
Glendale is a city in St. Louis County, Missouri, United States. The population was 5,925 at the 2010 census.
Data | Crime | Cost of living | Movers
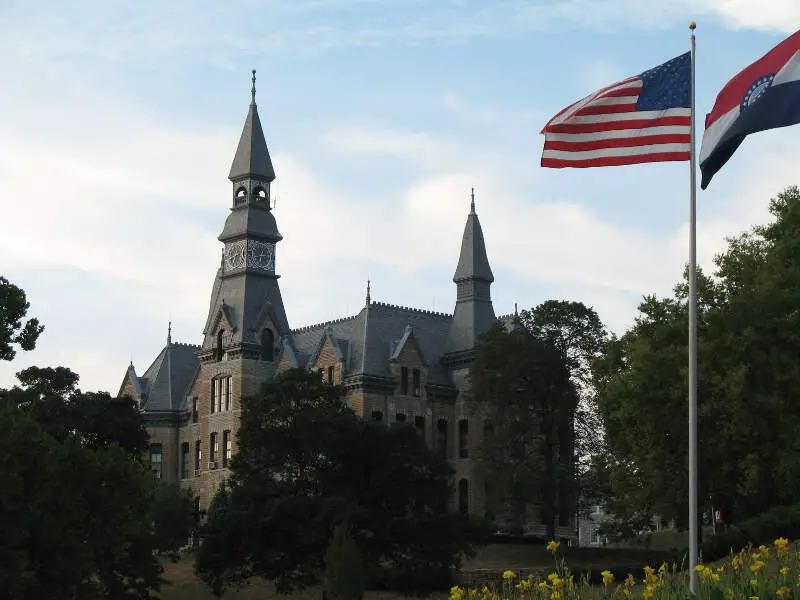
$171,271 median income · $578,744 median home · #8 home prices in Missouri
Parkville is a city in Platte County, Missouri, United States. The population was 5,554 at the 2010 census. Parkville is known for its antique shops, art galleries, and historic downtown. The city is home to Park University and English Landing Park.
Data | Crime | Cost of living | Movers
$111,660 median income · $488,323 median home · #13 home prices in Missouri
Olivette is an inner-ring suburb of St. Louis, located in St. Louis County, Missouri, United States. The population was 7,737 at the 2010 census.
Data | Crime | Cost of living | Movers
The receipts
Compare the top ten
Pick a metric. The bars rescale. The red line is Missouri’s statewide median.
Missouri statewide median: $263,040
Missouri statewide median: $70,702
On the map
Mapping the most expensive places in Missouri
Saturday Night Science
Methodology: How We Determined The Most Expensive Places To Live In The Show Me State For 2026
The two most important things to think about when it comes to being able to afford a city in Missouri are how much money you make and how much you have to spend to live there.
You need to understand your costs in the context of how much money you make.
For example, if the median household earns $100,000 and spends $40,000 on housing, it’s actually cheaper to live there than a place with a median income of $50,000 and housing costs of $21,000. You might spend more on housing, but you have more money overall to play with.
With that example in mind, we derived several statistics from the latest Census American Community Survey 2020-2024 around incomes and costs. They are:
- Overall Cost Of Living Index
- Median Home Price / Median Income (lower is better)
- Median Income / Median Rent (Higher is better)
- Median Home Price
You can then compare these metrics in each of the places in Missouri to figure out which is the most expensive.
You are left with a “Cost of Living Index” by taking the average rank of each of these metrics for each city.
So we used that cost of living index to rank all of the 131 places in Missouri that have more than 5,000 people.
The place with the highest cost of living in Missouri according to the data is Ladue. We updated this article for 2026. This article is our eleventh time ranking the most expensive places to live in Missouri. The median Missouri home is 48 years old — old enough that it pays to compare home warranty plans before something expensive breaks.
The full plate
Most Expensive Cities In Missouri
Click any column to sort. Search by city name.
| Rank | City | Cost Of Living | Population | Median Income | Average Home Price | Home/Income Ratio |
|---|---|---|---|---|---|---|
| 1 | Ladue | 198 | 8,940 | $250,001 | $1,331,344 | 5.3x |
| 2 | Town and Country | 168 | 11,607 | $232,534 | $1,146,742 | 4.9x |
| 3 | Clayton | 151 | 17,380 | $123,000 | $871,223 | 7.1x |
| 4 | Des Peres | 139 | 9,170 | $224,327 | $693,377 | 3.1x |
| 5 | Sunset Hills | 139 | 9,112 | $138,144 | $610,688 | 4.4x |
| 6 | Creve Coeur | 135 | 18,643 | $127,188 | $614,771 | 4.8x |
| 7 | Weldon Spring | 134 | 5,310 | $158,548 | $629,191 | 4.0x |
| 8 | Glendale | 131 | 6,114 | $170,700 | $565,844 | 3.3x |
| 9 | Parkville | 125 | 8,366 | $171,271 | $578,744 | 3.4x |
| 10 | Olivette | 124 | 8,645 | $111,660 | $488,323 | 4.4x |
| 11 | Wildwood | 122 | 35,133 | $161,060 | $576,009 | 3.6x |
| 12 | Chesterfield | 121 | 49,574 | $133,037 | $570,325 | 4.3x |
| 13 | Cottleville | 119 | 5,937 | $131,310 | $491,929 | 3.7x |
| 14 | Kirkwood | 117 | 29,363 | $121,270 | $462,235 | 3.8x |
| 15 | Webster Groves | 117 | 23,712 | $115,227 | $438,955 | 3.8x |
| 16 | Dardenne Prairie | 115 | 13,503 | $152,500 | $469,903 | 3.1x |
| 17 | University City | 109 | 34,685 | $80,694 | $265,837 | 3.3x |
| 18 | Ballwin | 109 | 31,279 | $124,626 | $412,225 | 3.3x |
| 19 | Lake St. Louis | 109 | 18,066 | $125,693 | $431,422 | 3.4x |
| 20 | Ellisville | 109 | 10,002 | $113,309 | $403,570 | 3.6x |
| 21 | Brentwood | 109 | 8,144 | $99,719 | $265,327 | 2.7x |
| 22 | Eureka | 108 | 13,081 | $108,394 | $403,523 | 3.7x |
| 23 | Manchester | 106 | 18,160 | $97,801 | $374,848 | 3.8x |
| 24 | Richmond Heights | 106 | 9,153 | $94,460 | $390,830 | 4.1x |
| 25 | O’Fallon | 105 | 93,801 | $110,443 | $376,395 | 3.4x |
| 26 | Wentzville | 105 | 47,061 | $112,394 | $396,786 | 3.5x |
| 27 | Herculaneum | 104 | 5,071 | $93,438 | $299,331 | 3.2x |
| 28 | Raymore | 103 | 24,526 | $104,447 | $356,402 | 3.4x |
| 29 | Crestwood | 103 | 12,295 | $107,169 | $339,629 | 3.2x |
| 30 | Lee’s Summit | 102 | 103,656 | $102,531 | $389,364 | 3.8x |
| 31 | St. Charles | 102 | 71,508 | $85,937 | $344,643 | 4.0x |
| 32 | Kearney | 102 | 10,885 | $103,622 | $390,530 | 3.8x |
| 33 | Greenwood | 102 | 6,013 | $107,250 | $355,951 | 3.3x |
| 34 | Columbia | 101 | 128,548 | $66,498 | $321,091 | 4.8x |
| 35 | Shrewsbury | 101 | 6,316 | $80,757 | $285,844 | 3.5x |
| 36 | Pleasant Hill | 100 | 8,847 | $95,602 | $364,998 | 3.8x |
| 37 | Valley Park | 100 | 6,795 | $67,898 | $295,375 | 4.4x |
| 38 | Liberty | 99 | 30,689 | $88,542 | $324,253 | 3.7x |
| 39 | Grain Valley | 99 | 16,271 | $89,649 | $326,296 | 3.6x |
| 40 | Bridgeton | 99 | 11,369 | $72,005 | $273,069 | 3.8x |
| 41 | Smithville | 99 | 10,705 | $101,165 | $371,403 | 3.7x |
| 42 | Kansas City | 98 | 510,612 | $69,166 | $250,208 | 3.6x |
| 43 | Maryland Heights | 98 | 27,880 | $86,436 | $258,829 | 3.0x |
| 44 | Blue Springs | 97 | 59,965 | $88,920 | $307,947 | 3.5x |
| 45 | St. Peters | 97 | 59,092 | $91,637 | $318,220 | 3.5x |
| 46 | Waynesville | 97 | 5,442 | $56,836 | $242,455 | 4.3x |
| 47 | Ozark | 96 | 22,417 | $74,182 | $316,347 | 4.3x |
| 48 | Jackson | 96 | 15,659 | $77,105 | $271,918 | 3.5x |
| 49 | Belton | 95 | 25,008 | $69,226 | $270,041 | 3.9x |
| 50 | Nixa | 95 | 24,836 | $83,385 | $318,320 | 3.8x |
| 51 | Troy | 95 | 13,947 | $79,012 | $311,433 | 3.9x |
| 52 | Carl Junction | 95 | 8,339 | $82,879 | $250,863 | 3.0x |
| 53 | Maplewood | 95 | 8,156 | $65,125 | $267,091 | 4.1x |
| 54 | St. Robert | 95 | 5,356 | $62,641 | $231,890 | 3.7x |
| 55 | Gladstone | 94 | 27,207 | $79,271 | $266,727 | 3.4x |
| 56 | Washington | 94 | 15,130 | $79,173 | $306,588 | 3.9x |
| 57 | Branson | 94 | 12,817 | $51,978 | $248,361 | 4.8x |
| 58 | Willard | 94 | 6,488 | $84,600 | $272,134 | 3.2x |
| 59 | Peculiar | 94 | 5,958 | $94,519 | $357,230 | 3.8x |
| 60 | Wright City | 94 | 5,240 | $80,152 | $307,152 | 3.8x |
| 61 | Arnold | 93 | 20,956 | $78,370 | $273,572 | 3.5x |
| 62 | Festus | 93 | 13,201 | $73,532 | $299,935 | 4.1x |
| 63 | Oak Grove | 93 | 8,538 | $75,102 | $291,503 | 3.9x |
| 64 | Battlefield | 93 | 6,165 | $94,542 | $303,753 | 3.2x |
| 65 | Ste. Genevieve | 93 | 5,010 | $48,097 | $196,909 | 4.1x |
| 66 | Jefferson City | 92 | 42,488 | $66,371 | $272,649 | 4.1x |
| 67 | Cape Girardeau | 92 | 40,344 | $55,658 | $219,807 | 3.9x |
| 68 | Odessa | 92 | 5,620 | $100,022 | $256,903 | 2.6x |
| 69 | Warrensburg | 91 | 19,582 | $57,067 | $266,468 | 4.7x |
| 70 | Farmington | 91 | 18,282 | $53,729 | $254,729 | 4.7x |
| 71 | Union | 91 | 12,781 | $73,435 | $257,223 | 3.5x |
| 72 | Fulton | 91 | 12,617 | $51,429 | $245,451 | 4.8x |
| 73 | Bolivar | 91 | 11,170 | $49,622 | $252,896 | 5.1x |
| 74 | Harrisonville | 91 | 9,970 | $62,473 | $294,225 | 4.7x |
| 75 | Perryville | 91 | 8,536 | $51,897 | $222,682 | 4.3x |
| 76 | Cameron | 91 | 8,519 | $61,791 | $243,891 | 3.9x |
| 77 | Pacific | 91 | 7,475 | $62,860 | $245,537 | 3.9x |
| 78 | St. Joseph | 90 | 71,236 | $57,956 | $180,020 | 3.1x |
| 79 | Rolla | 90 | 20,287 | $46,204 | $237,605 | 5.1x |
| 80 | Republic | 90 | 19,829 | $65,729 | $268,263 | 4.1x |
| 81 | Kirksville | 90 | 17,563 | $50,071 | $150,865 | 3.0x |
| 82 | Excelsior Springs | 90 | 10,484 | $72,609 | $223,588 | 3.1x |
| 83 | Warrenton | 90 | 9,066 | $61,031 | $299,573 | 4.9x |
| 84 | Black Jack | 90 | 6,589 | $78,331 | $217,916 | 2.8x |
| 85 | Pevely | 90 | 6,055 | $56,000 | $273,663 | 4.9x |
| 86 | St. Louis | 89 | 288,512 | $56,160 | $181,928 | 3.2x |
| 87 | Independence | 89 | 121,740 | $60,339 | $208,158 | 3.4x |
| 88 | Sikeston | 89 | 16,320 | $58,915 | $158,611 | 2.7x |
| 89 | Overland | 89 | 15,695 | $61,773 | $150,450 | 2.4x |
| 90 | Webb City | 89 | 13,221 | $65,469 | $222,929 | 3.4x |
| 91 | Maryville | 89 | 10,428 | $53,352 | $222,767 | 4.2x |
| 92 | Marshfield | 89 | 7,696 | $67,642 | $253,421 | 3.7x |
| 93 | Savannah | 89 | 5,053 | $62,535 | $266,126 | 4.3x |
| 94 | Florissant | 88 | 51,773 | $65,318 | $191,524 | 2.9x |
| 95 | Raytown | 88 | 29,445 | $68,840 | $205,243 | 3.0x |
| 96 | Hazelwood | 88 | 25,114 | $55,908 | $157,629 | 2.8x |
| 97 | Boonville | 88 | 7,689 | $56,429 | $192,609 | 3.4x |
| 98 | Joplin | 87 | 52,593 | $52,097 | $200,472 | 3.8x |
| 99 | Grandview | 87 | 26,527 | $53,447 | $216,734 | 4.1x |
| 100 | Sedalia | 87 | 22,003 | $50,990 | $182,165 | 3.6x |
Source: U.S. Census ACS 2020-2024, Zillow research. 131 places with more than 5,000 residents.
Summary
Summary: Taking A Chunk Out Of Your Paycheck In Missouri For 2026
Well, there you have it, the places in Missouri that have the highest cost of living, with Ladue ranking as the most expensive city in the Show Me State.
The most expensive cities in Missouri are Ladue, Town and Country, Clayton, Des Peres, Sunset Hills, Creve Coeur, Weldon Spring, Glendale, Parkville, and Olivette. Not sold on Missouri? Take the two-minute Find Your Place quiz and see which state actually fits you.
Questions and answers
Most Expensive Places In Missouri FAQs
What is the most expensive place to live in Missouri?
Ladue is the most expensive place to live in Missouri for 2026. The median home there runs $1,331,344, and it posts the highest cost of living of the 131 places we scored.
What are the 10 most expensive cities in Missouri?
The ten most expensive cities in Missouri are Ladue, Town and Country, Clayton, Des Peres, Sunset Hills, Creve Coeur, Weldon Spring, Glendale, Parkville, and Olivette. We ranked all 131 places with more than 5,000 residents on home prices, incomes, and an overall cost of living index.
How expensive are homes in Ladue?
The median home value in Ladue is $1,331,344, versus $263,040 across Missouri as a whole. Across the ten most expensive cities, the median home runs $621,981.
What salary do you need to live in the most expensive parts of Missouri?
The median household income in the ten most expensive Missouri cities starts at $111,660, and in Ladue it is $250,001. If your paycheck is closer to the statewide median of $70,702, these places will squeeze your budget.
What is the cheapest place to live in Missouri?
Nevada is the cheapest of the 131 Missouri places we ranked on cost of living. It sits at the very bottom of the same index that put Ladue on top.